The same plot in 14 other libraries — JavaScript: Chart.js, D3.js, Highcharts, MUI X Charts; Python: Altair, Bokeh, lets-plot, Matplotlib, Plotly, plotnine, Pygal, Seaborn; R: ggplot2; Julia: Makie.jl. Compare all 15 side by side: Spine Plot for Two-Variable Proportions in Python, R, Julia and JavaScript.
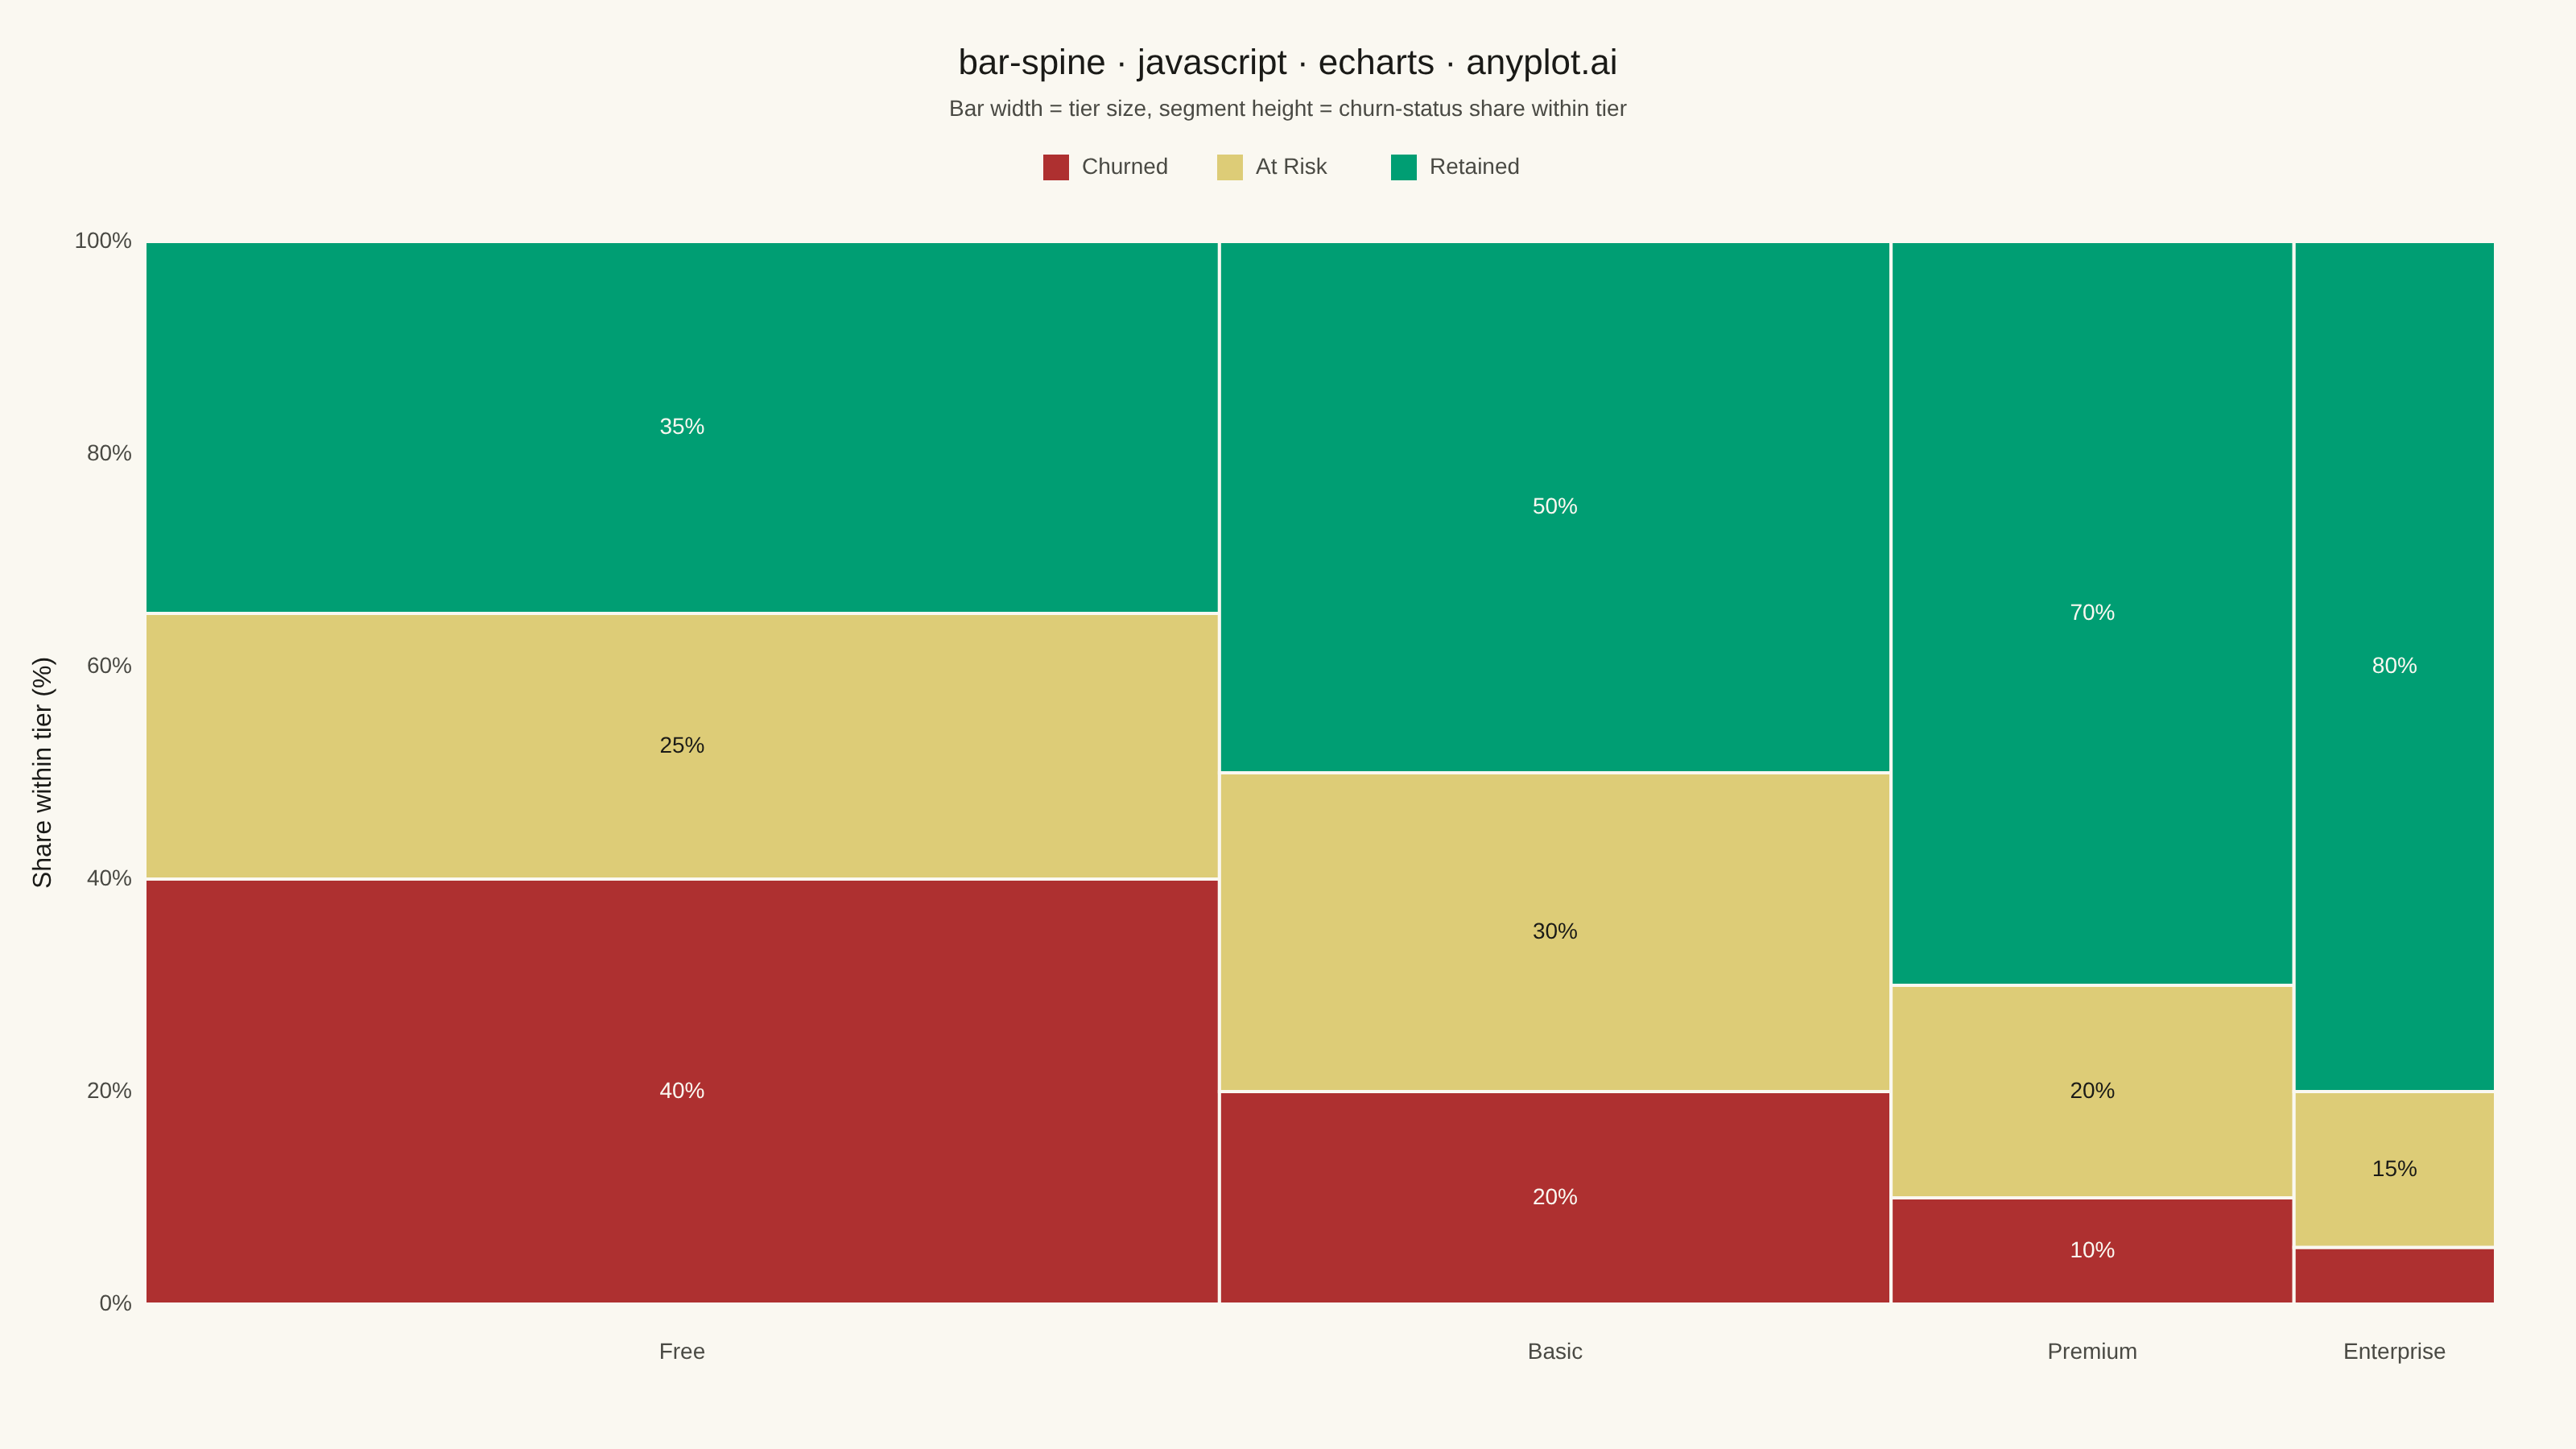
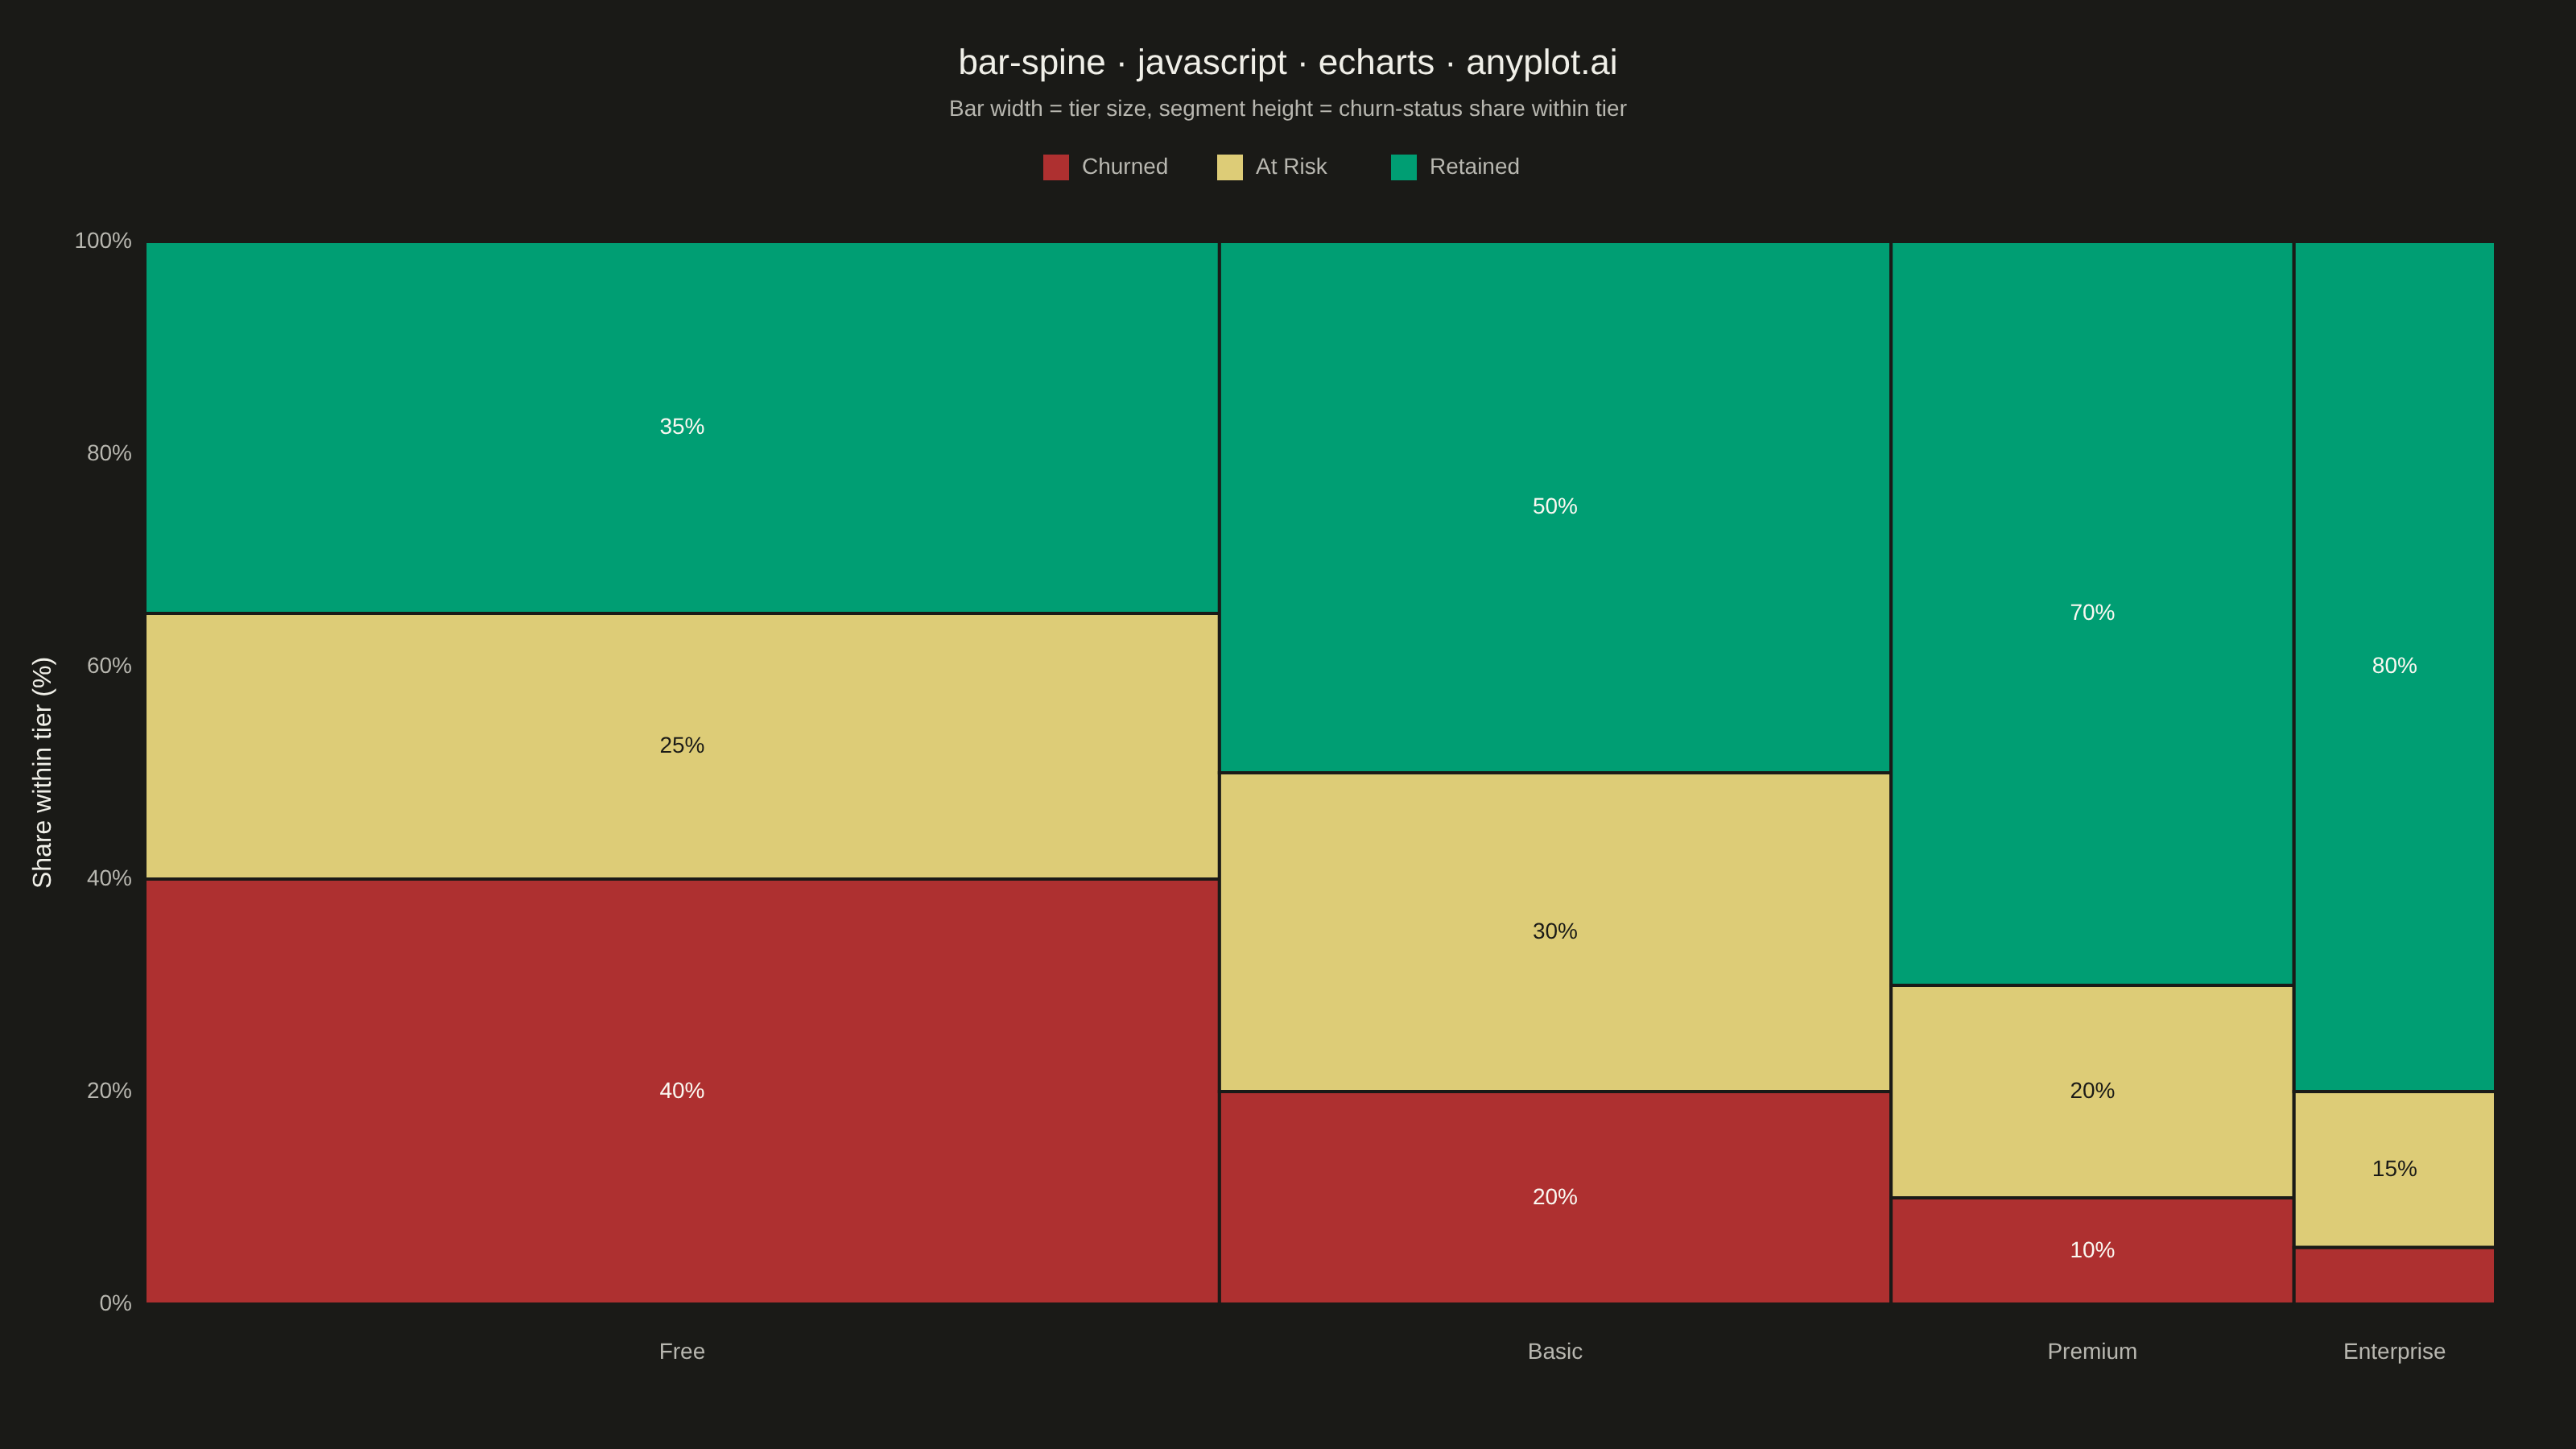
A spine plot (spineplot) is a stacked bar chart where bar widths are proportional to the marginal frequency of one categorical variable and the subdivisions within each bar show the conditional distribution of a second categorical variable. All bars are normalized to the same height (100%), so visual comparison focuses on how the conditional proportions shift across categories. It is a one-dimensional specialization of mosaic plots and excels at revealing associations between two categorical variables in contingency table data.
// anyplot.ai
// bar-spine: Spine Plot for Two-Variable Proportions
// Library: echarts 6.1.0 | JavaScript 22.23.2
// Quality: 90/100 | Updated: 2026-09-27

const t = window.ANYPLOT_TOKENS;

// --- Data (in-memory, deterministic) ----------------------------------------
// Customer counts by subscription tier and churn status. Bar width encodes
// each tier's share of the total customer base; segment height encodes the
// churn-status share within that tier.
const tiers = [
  { name: "Free", counts: { Churned: 320, "At Risk": 200, Retained: 280 } },
  { name: "Basic", counts: { Churned: 100, "At Risk": 150, Retained: 250 } },
  { name: "Premium", counts: { Churned: 30, "At Risk": 60, Retained: 210 } },
  { name: "Enterprise", counts: { Churned: 8, "At Risk": 22, Retained: 120 } },
];
const statusOrder = ["Churned", "At Risk", "Retained"];
const statusColor = { Churned: t.palette[4], "At Risk": t.amber, Retained: t.palette[0] };
// Fixed (non-theme-adaptive) label colors chosen for contrast against each
// status's own fixed data fill — the fills never change between themes, so
// the label colors must not either (t.ink/t.pageBg flip per theme and would
// invert the contrast in dark mode).
const LABEL_LIGHT = "#FAF8F1";
const LABEL_DARK = "#1A1A17";
const statusTextColor = { Churned: LABEL_LIGHT, "At Risk": LABEL_DARK, Retained: LABEL_LIGHT };
// Retained's light-on-green label sits near the WCAG AA floor (~3:1); a heavier
// weight adds enough stroke thickness to remove any residual ambiguity.
const statusLabelWeight = { Churned: 500, "At Risk": 500, Retained: 700 };

const totals = tiers.map((tier) => statusOrder.reduce((sum, status) => sum + tier.counts[status], 0));
const grandTotal = totals.reduce((sum, total) => sum + total, 0);

let cursorX = 0;
const tierMeta = [];
const segments = [];
tiers.forEach((tier, i) => {
  const total = totals[i];
  const width = (total / grandTotal) * 100;
  const x0 = cursorX;
  const x1 = cursorX + width;
  cursorX = x1;
  tierMeta.push({ name: tier.name, x0, x1 });

  let cursorY = 0;
  statusOrder.forEach((status) => {
    const count = tier.counts[status];
    const pct = (count / total) * 100;
    const y0 = cursorY;
    const y1 = cursorY + pct;
    cursorY = y1;
    segments.push({ x0, x1, y0, y1, count, pct, tier: tier.name, status });
  });
});

// --- Custom-series renderer for variable-width stacked segments -------------
function segmentRenderItem(params, api) {
  const seg = segments[params.dataIndex];
  const p1 = api.coord([seg.x0, seg.y0]);
  const p2 = api.coord([seg.x1, seg.y1]);
  const rectShape = echarts.graphic.clipRectByRect(
    { x: p1[0], y: p2[1], width: p2[0] - p1[0], height: p1[1] - p2[1] },
    { x: params.coordSys.x, y: params.coordSys.y, width: params.coordSys.width, height: params.coordSys.height }
  );
  if (!rectShape) return;
  const children = [
    // Thin (not thick) seam: definition between segments without competing
    // with the spec's gap-free, continuous-proportion-axis emphasis.
    { type: "rect", shape: rectShape, style: { fill: statusColor[seg.status], stroke: t.pageBg, lineWidth: 1 } },
  ];
  if (rectShape.width > 70 && rectShape.height > 40) {
    children.push({
      type: "text",
      x: rectShape.x + rectShape.width / 2,
      y: rectShape.y + rectShape.height / 2,
      style: {
        text: `${Math.round(seg.pct)}%`,
        fill: statusTextColor[seg.status],
        fontSize: 14,
        fontWeight: statusLabelWeight[seg.status],
        align: "center",
        verticalAlign: "middle",
      },
    });
  }
  return { type: "group", children };
}

// --- Custom-series renderer for centered tier labels below the axis --------
function tierLabelRenderItem(params, api) {
  const meta = tierMeta[params.dataIndex];
  const p = api.coord([(meta.x0 + meta.x1) / 2, 0]);
  return {
    type: "text",
    x: p[0],
    y: p[1] + 30,
    style: { text: meta.name, fill: t.inkSoft, fontSize: 14, align: "center", verticalAlign: "middle" },
  };
}

// --- Custom-series renderer for a manually laid out legend row -------------
// ECharts' built-in legend only syncs to series names; since the segments
// live in one "custom" series, the legend swatches are drawn directly instead.
const legendY = 96;
const legendItems = statusOrder.map((status) => ({ status, width: 16 + 8 + status.length * 8 }));
const legendTotalWidth = legendItems.reduce((sum, item) => sum + item.width, 0) + 28 * (legendItems.length - 1);
let legendCursorX = (window.ANYPLOT_SIZE.width - legendTotalWidth) / 2;
legendItems.forEach((item) => {
  item.x0 = legendCursorX;
  legendCursorX += item.width + 28;
});

function legendRenderItem(params, api) {
  const item = legendItems[params.dataIndex];
  return {
    type: "group",
    children: [
      {
        type: "rect",
        shape: { x: item.x0, y: legendY, width: 16, height: 16 },
        style: { fill: statusColor[item.status] },
      },
      {
        type: "text",
        x: item.x0 + 24,
        y: legendY + 8,
        style: { text: item.status, fill: t.inkSoft, fontSize: 14, verticalAlign: "middle" },
      },
    ],
  };
}

// --- Init ---------------------------------------------------------------
const chart = echarts.init(document.getElementById("container"));

// --- Option ---------------------------------------------------------------
chart.setOption({
  animation: false,
  backgroundColor: "transparent",
  title: {
    text: "bar-spine · javascript · echarts · anyplot.ai",
    subtext: "Bar width = tier size, segment height = churn-status share within tier",
    left: "center",
    top: 24,
    textStyle: { color: t.ink, fontSize: 22, fontWeight: 500 },
    subtextStyle: { color: t.inkSoft, fontSize: 14 },
  },
  grid: { left: 90, right: 50, top: 150, bottom: 90 },
  xAxis: { type: "value", min: 0, max: 100, show: false },
  yAxis: {
    type: "value",
    min: 0,
    max: 100,
    name: "Share within tier (%)",
    nameLocation: "center",
    nameGap: 55,
    nameTextStyle: { color: t.ink, fontSize: 16 },
    axisLabel: { color: t.inkSoft, fontSize: 14, formatter: "{value}%" },
    axisLine: { show: false },
    axisTick: { show: false },
    splitLine: { lineStyle: { color: t.grid } },
  },
  tooltip: {
    trigger: "item",
    formatter: (params) => {
      if (params.seriesName !== "segments") return "";
      const seg = segments[params.dataIndex];
      return `${seg.tier} — ${seg.status}<br/>${seg.count} customers (${seg.pct.toFixed(1)}%)`;
    },
  },
  series: [
    {
      type: "custom",
      name: "segments",
      renderItem: segmentRenderItem,
      data: segments.map((seg) => seg.count),
      z: 2,
    },
    {
      type: "custom",
      name: "__tier_labels",
      silent: true,
      renderItem: tierLabelRenderItem,
      data: tierMeta.map(() => 0),
      z: 3,
    },
    {
      type: "custom",
      name: "__legend",
      silent: true,
      renderItem: legendRenderItem,
      data: legendItems.map(() => 0),
      z: 3,
    },
  ],
});
Runnable source as JSON, for any HTTP client: https://api.anyplot.ai/specs/bar-spine/echarts/code. Any spec id and library id listed in llms-full.txt fit the same URL shape; every URL below is complete and callable.
{
  "spec_id": "bar-spine",
  "language": "javascript",
  "library": "echarts",
  "page": "https://anyplot.ai/bar-spine/javascript/echarts",
  "hub": "https://anyplot.ai/bar-spine",
  "code_json": "https://api.anyplot.ai/specs/bar-spine/echarts/code",
  "spec_json": "https://api.anyplot.ai/specs/bar-spine",
  "render_light_png": "https://storage.googleapis.com/anyplot-images/plots/bar-spine/javascript/echarts/plot-light.png",
  "render_dark_png": "https://storage.googleapis.com/anyplot-images/plots/bar-spine/javascript/echarts/plot-dark.png",
  "interactive_light_html": "https://storage.googleapis.com/anyplot-images/plots/bar-spine/javascript/echarts/plot-light.html",
  "interactive_dark_html": "https://storage.googleapis.com/anyplot-images/plots/bar-spine/javascript/echarts/plot-dark.html",
  "quality_score": 90.0,
  "license": "MIT",
  "guide": "https://anyplot.ai/llms.txt"
}
Part of Spine Plot for Two-Variable Proportions on anyplot.ai.