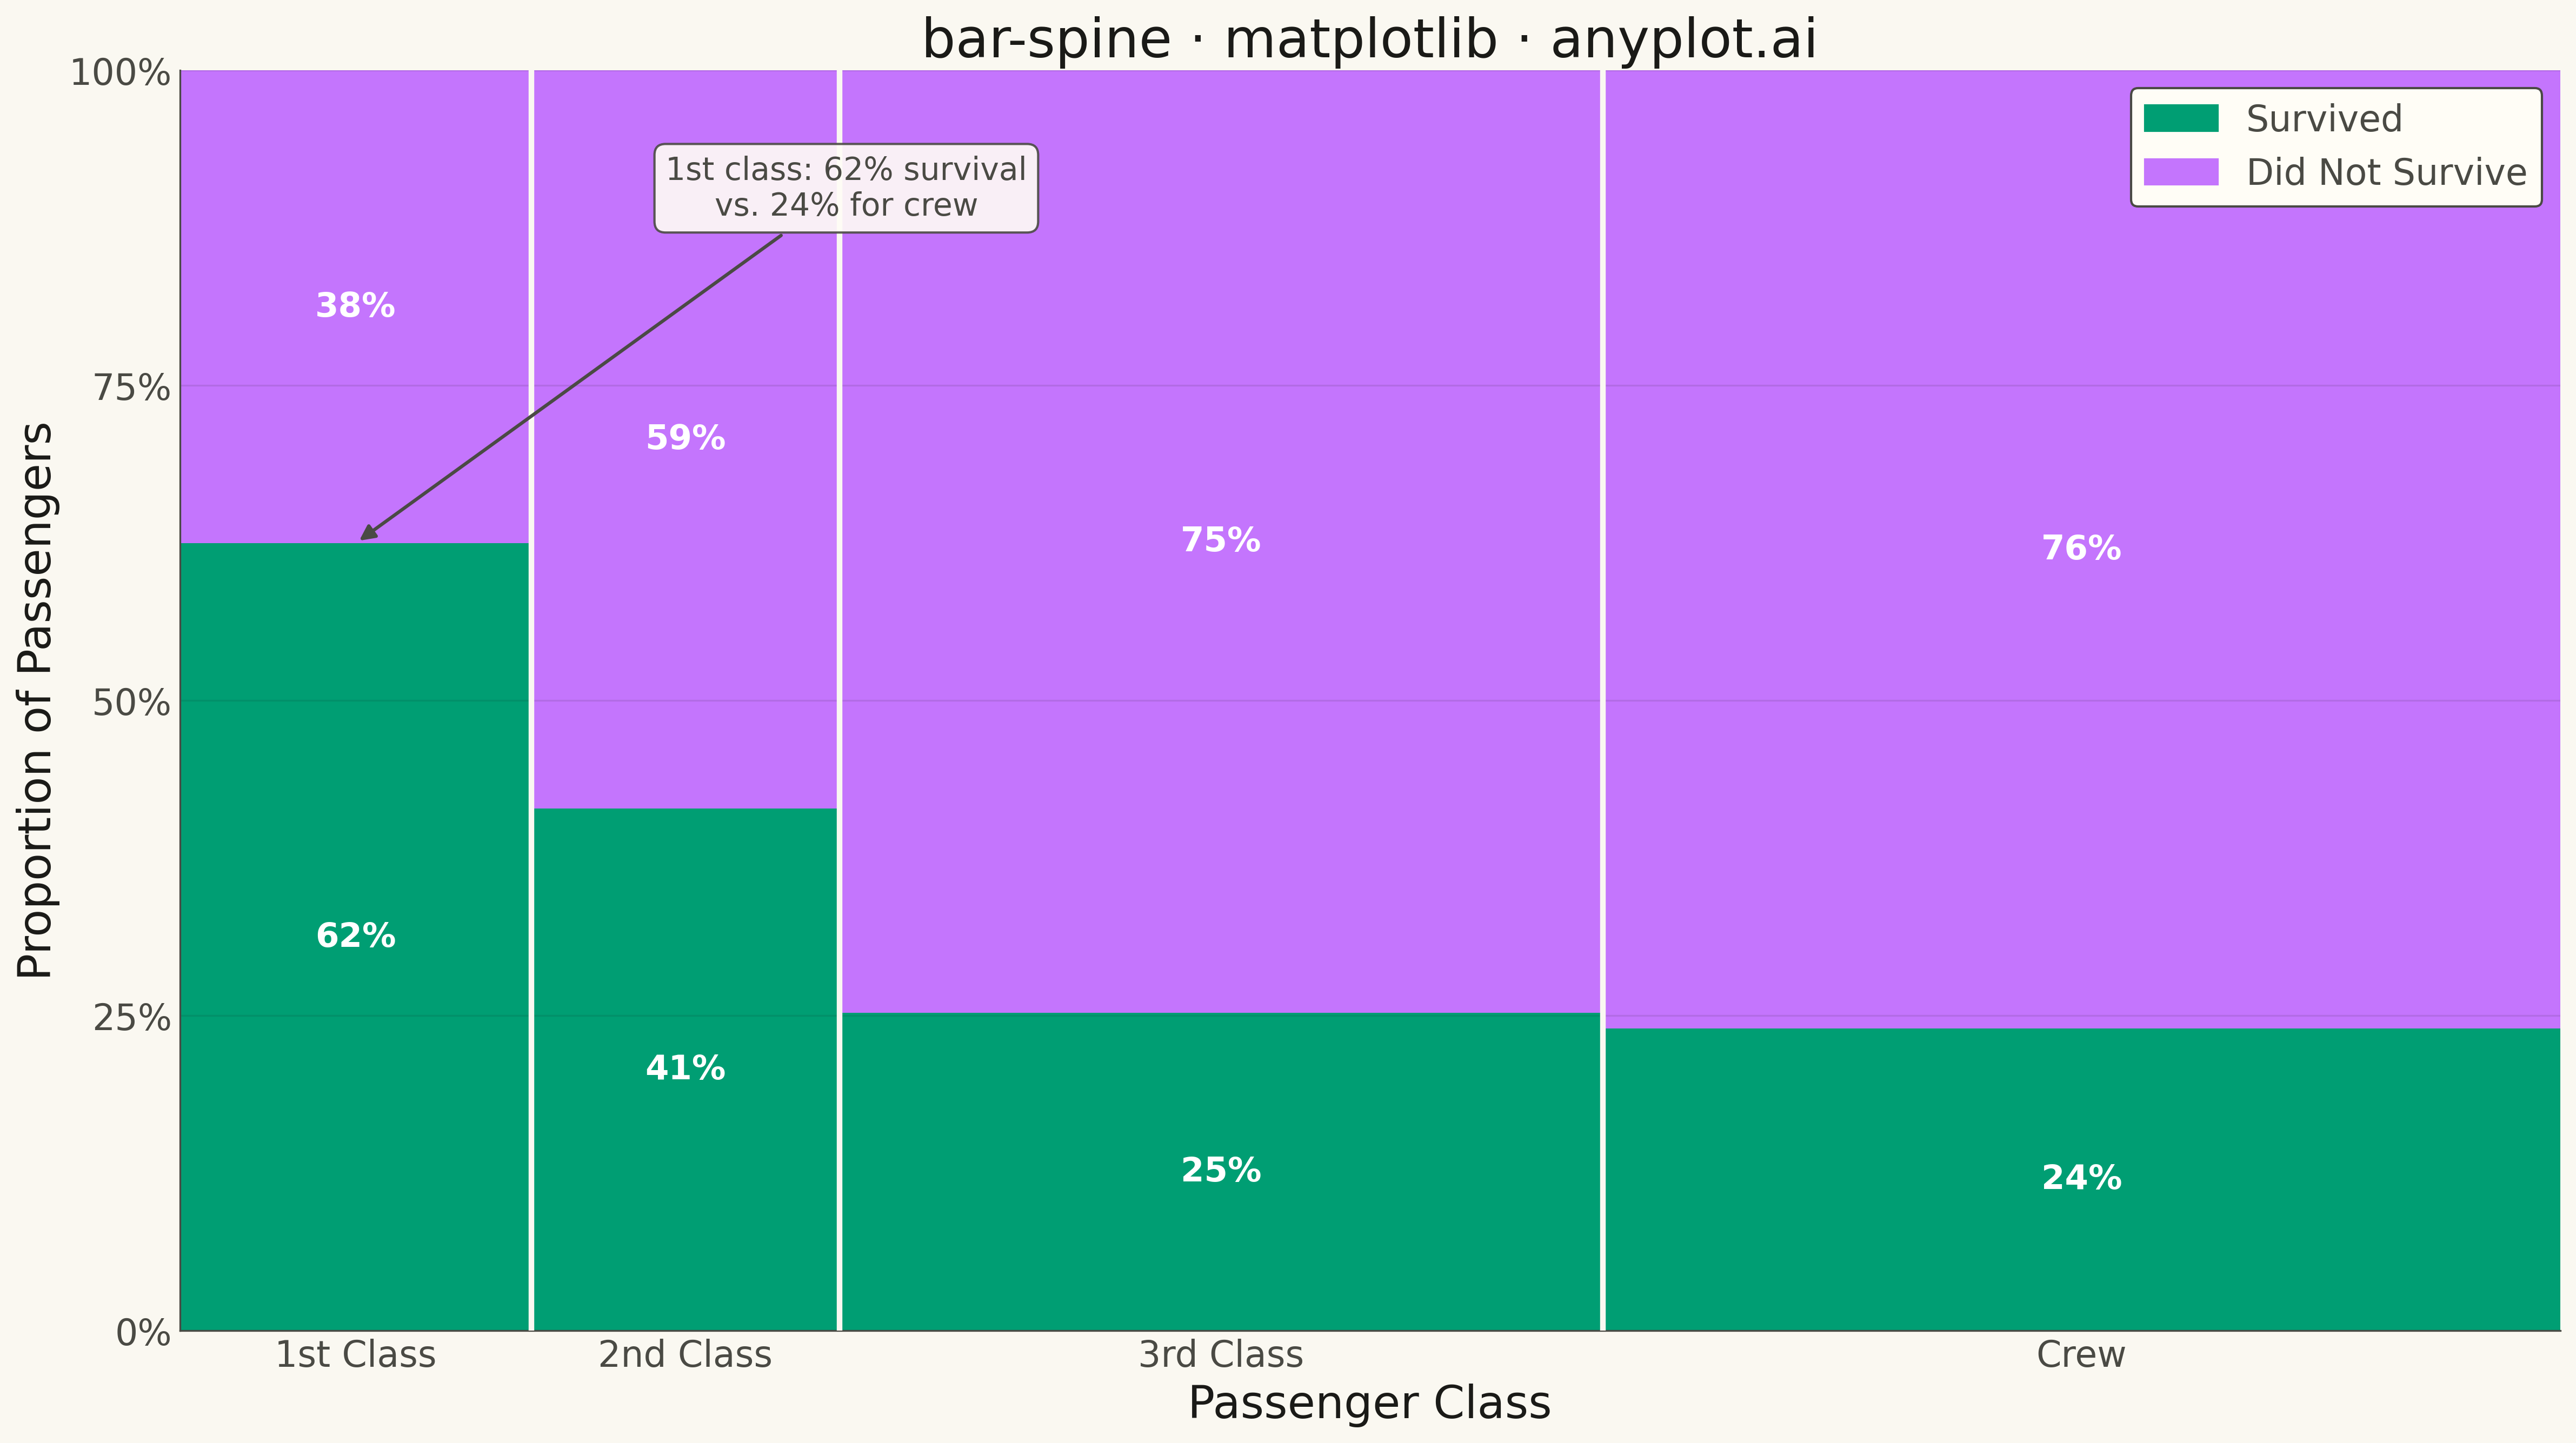
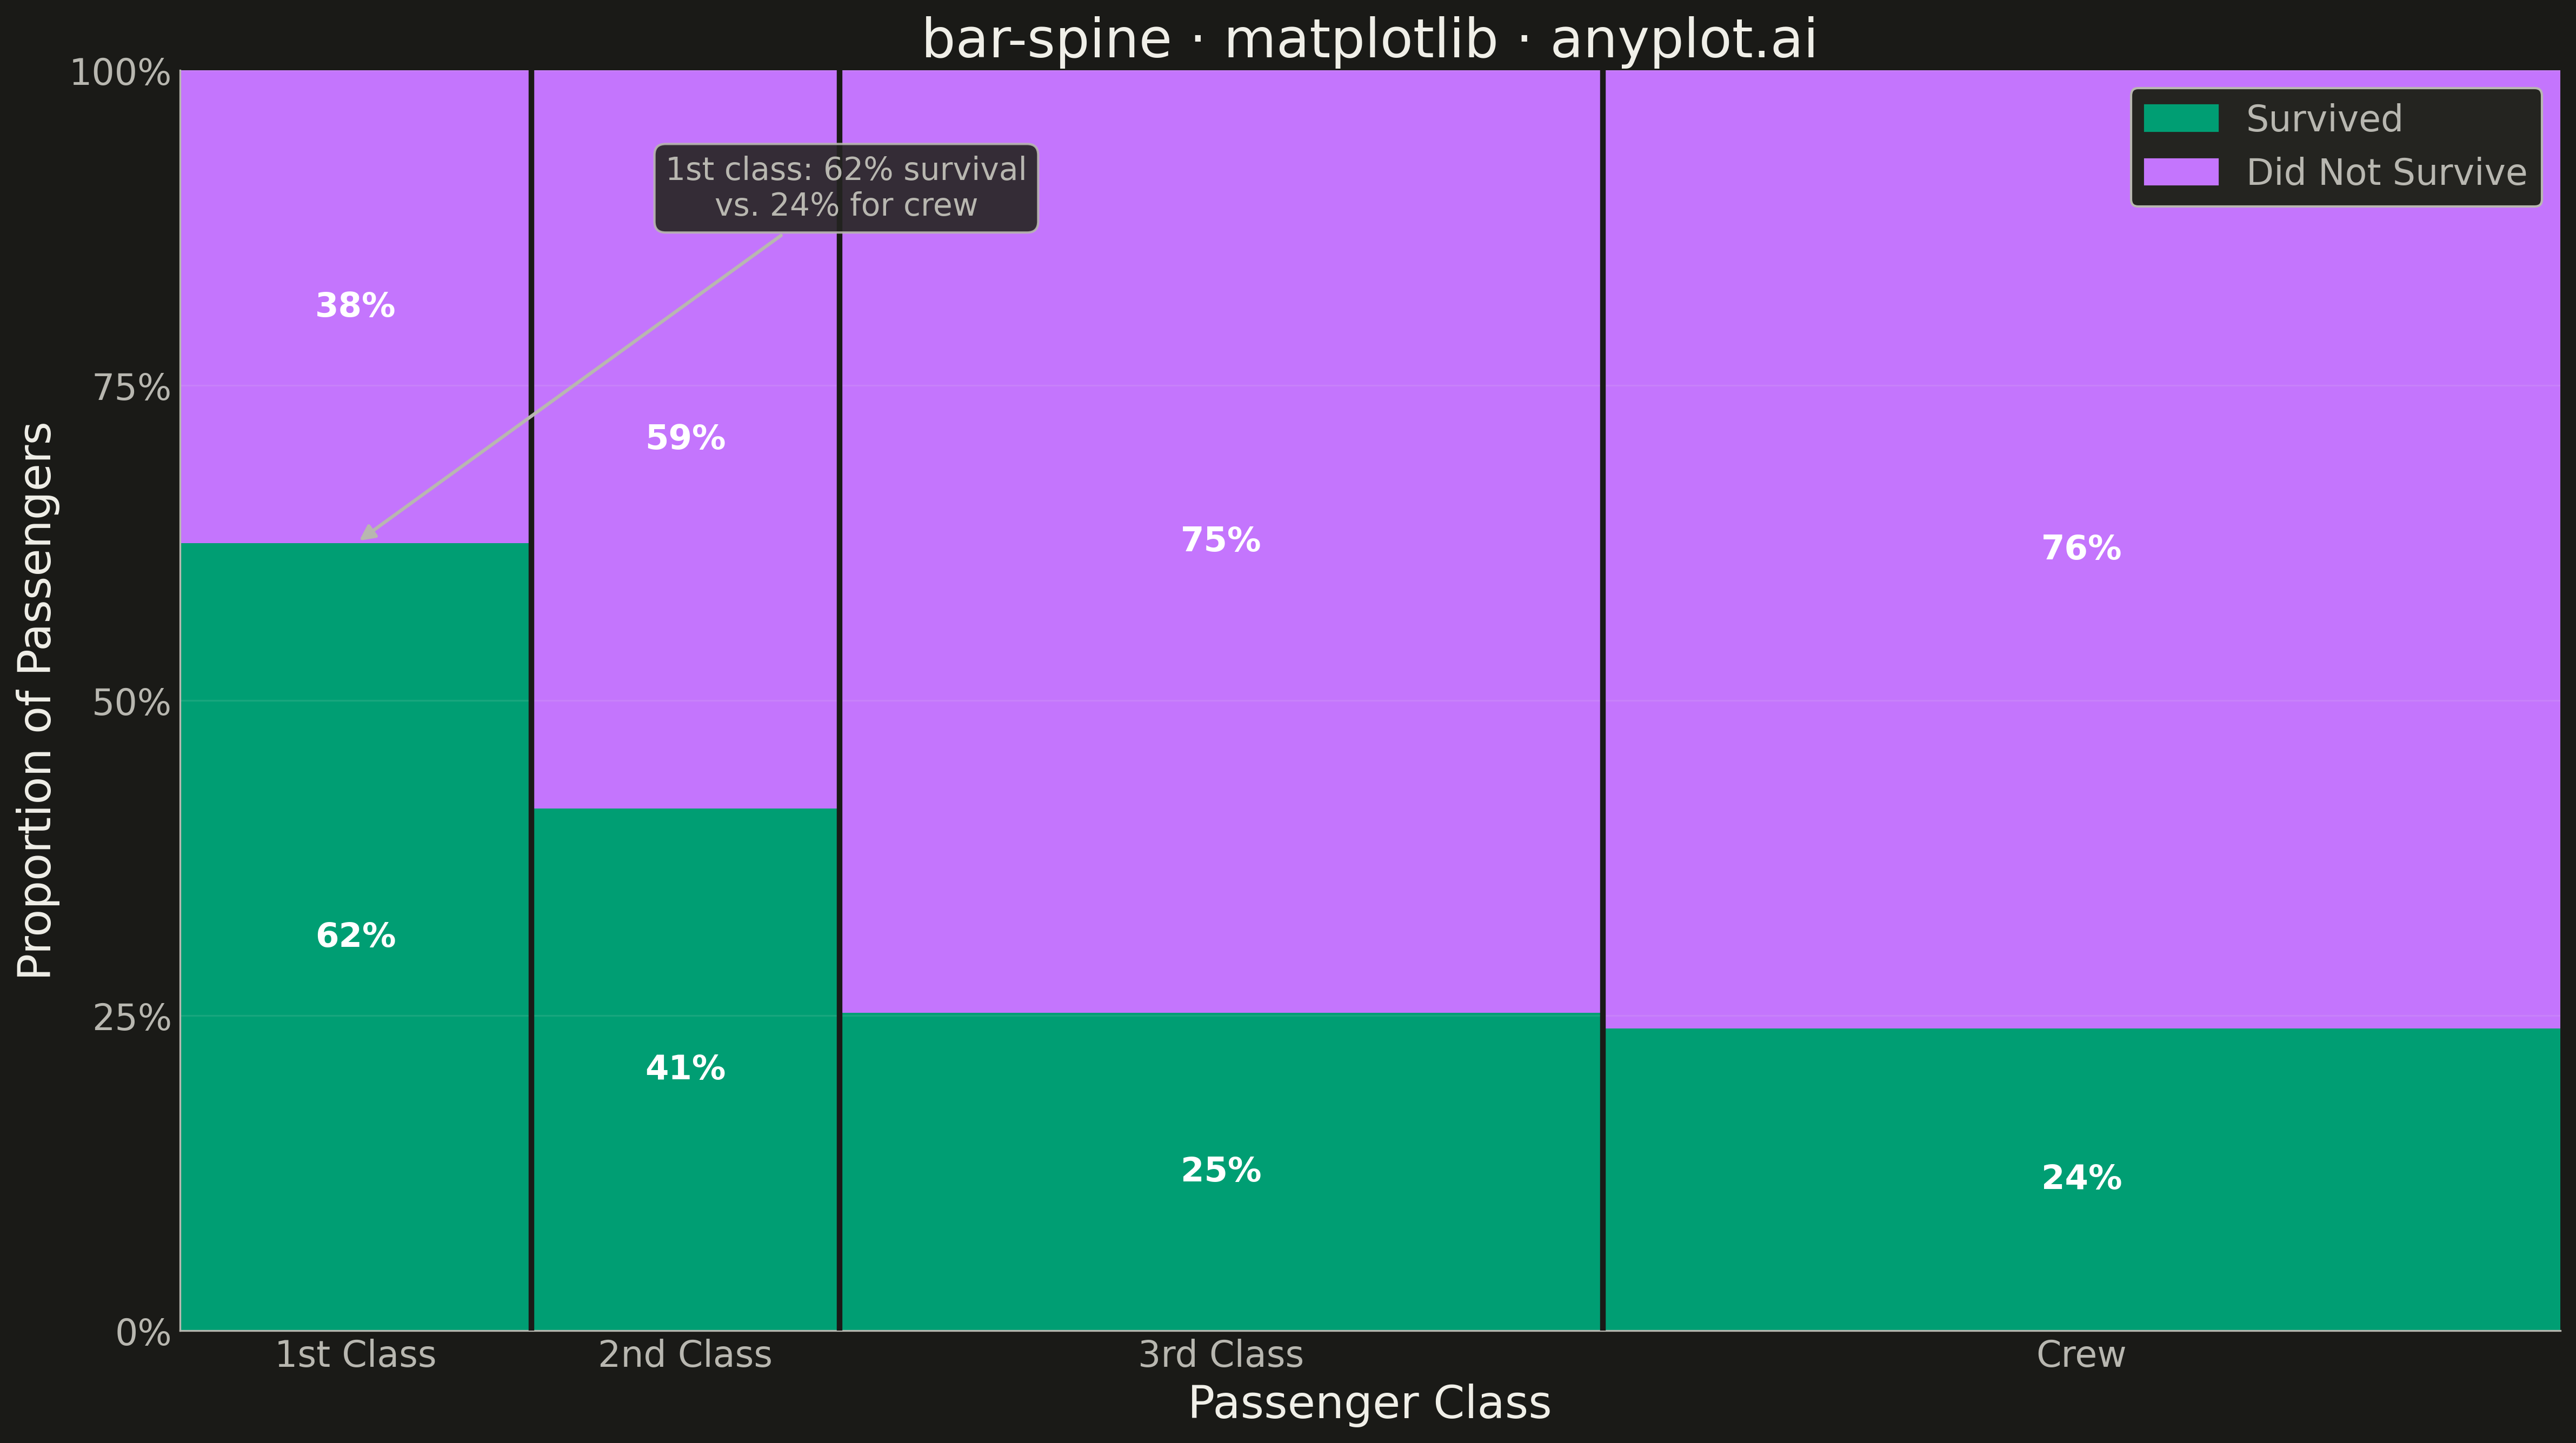
The same plot in 14 other libraries — Python: Altair, Bokeh, lets-plot, Plotly, plotnine, Pygal, Seaborn; R: ggplot2; Julia: Makie.jl; JavaScript: Chart.js, D3.js, Apache ECharts, Highcharts, MUI X Charts. Compare all 15 side by side: Spine Plot for Two-Variable Proportions in Python, R, Julia and JavaScript.
A spine plot (spineplot) is a stacked bar chart where bar widths are proportional to the marginal frequency of one categorical variable and the subdivisions within each bar show the conditional distribution of a second categorical variable. All bars are normalized to the same height (100%), so visual comparison focuses on how the conditional proportions shift across categories. It is a one-dimensional specialization of mosaic plots and excels at revealing associations between two categorical variables in contingency table data.
""" anyplot.ai
bar-spine: Spine Plot for Two-Variable Proportions
Library: matplotlib 3.11.2 | Python 3.13.15
Quality: 91/100 | Updated: 2026-09-27
"""

import importlib
import os
import sys


# This file is named matplotlib.py, which shadows the actual matplotlib package.
# Strip this directory from sys.path before importing matplotlib so Python finds
# the installed package instead of this script.
_here = os.path.dirname(os.path.abspath(__file__))
sys.path = [p for p in sys.path if os.path.abspath(p) != _here and p != ""]

mpatches = importlib.import_module("matplotlib.patches")
plt = importlib.import_module("matplotlib.pyplot")
np = importlib.import_module("numpy")


# Theme tokens
THEME = os.getenv("ANYPLOT_THEME", "light")
_OUT = os.path.dirname(os.path.abspath(__file__))
PAGE_BG = "#FAF8F1" if THEME == "light" else "#1A1A17"
ELEVATED_BG = "#FFFDF6" if THEME == "light" else "#242420"
INK = "#1A1A17" if THEME == "light" else "#F0EFE8"
INK_SOFT = "#4A4A44" if THEME == "light" else "#B8B7B0"
INK_MUTED = "#6B6A63" if THEME == "light" else "#A8A79F"

# Titanic survival data by passenger class (classic contingency table)
classes = ["1st Class", "2nd Class", "3rd Class", "Crew"]
survived_counts = np.array([203, 118, 178, 212])
died_counts = np.array([122, 167, 528, 673])
class_totals = survived_counts + died_counts

# Marginal proportions → bar widths (width encodes class size)
grand_total = class_totals.sum()
bar_widths = class_totals / grand_total

# Conditional proportions within each bar (height encodes survival rate)
prop_survived = survived_counts / class_totals
prop_died = died_counts / class_totals

# Left-edge positions for adjacent bars
x_left = np.concatenate([[0], np.cumsum(bar_widths)[:-1]])

# Colors: Imprint palette positions 1 and 2
COLOR_SURVIVED = "#009E73"
COLOR_DIED = "#C475FD"

# Plot
fig, ax = plt.subplots(figsize=(8, 4.5), dpi=400, facecolor=PAGE_BG)
ax.set_facecolor(PAGE_BG)

survived_bars = ax.bar(
    x_left, prop_survived, width=bar_widths, bottom=0, align="edge", color=COLOR_SURVIVED, linewidth=0
)
died_bars = ax.bar(
    x_left, prop_died, width=bar_widths, bottom=prop_survived, align="edge", color=COLOR_DIED, linewidth=0
)

# Thin page-color separators between adjacent bars
for x in x_left[1:]:
    ax.axvline(x, color=PAGE_BG, linewidth=2.5, zorder=5)

# Percentage labels centered within each segment (blank when too small to hold text)
survived_labels = [f"{p:.0%}" if p > 0.08 else "" for p in prop_survived]
died_labels = [f"{p:.0%}" if p > 0.08 else "" for p in prop_died]
ax.bar_label(
    survived_bars, labels=survived_labels, label_type="center", fontsize=8, fontweight="bold", color="white", zorder=6
)
ax.bar_label(died_bars, labels=died_labels, label_type="center", fontsize=8, fontweight="bold", color="white", zorder=6)

# X-axis: centered tick labels under variable-width bars
center_positions = x_left + bar_widths / 2
ax.set_xticks(center_positions)
ax.set_xticklabels(classes, fontsize=8, color=INK_SOFT)
ax.tick_params(axis="x", length=0, labelcolor=INK_SOFT)

# Y-axis: percentage scale
ax.set_yticks([0, 0.25, 0.5, 0.75, 1.0])
ax.set_yticklabels(["0%", "25%", "50%", "75%", "100%"], fontsize=8, color=INK_SOFT)
ax.tick_params(axis="y", length=0, labelcolor=INK_SOFT)

ax.set_xlim(0, 1)
ax.set_ylim(0, 1)

# Annotation: highlight 1st-class survival advantage over crew
cx_1st = x_left[0] + bar_widths[0] / 2
ax.annotate(
    f"1st class: {prop_survived[0]:.0%} survival\nvs. {prop_survived[-1]:.0%} for crew",
    xy=(cx_1st, prop_survived[0]),
    xytext=(0.28, 0.88),
    fontsize=7,
    color=INK_SOFT,
    ha="center",
    va="bottom",
    arrowprops={"arrowstyle": "-|>", "color": INK_SOFT, "lw": 1.2},
    bbox={"facecolor": ELEVATED_BG, "edgecolor": INK_SOFT, "alpha": 0.9, "boxstyle": "round,pad=0.35"},
    zorder=7,
)

# Style
ax.set_xlabel("Passenger Class", fontsize=10, color=INK)
ax.set_ylabel("Proportion of Passengers", fontsize=10, color=INK)
ax.set_title("bar-spine · python · matplotlib · anyplot.ai", fontsize=12, fontweight="medium", color=INK)

ax.spines["top"].set_visible(False)
ax.spines["right"].set_visible(False)
for s in ("left", "bottom"):
    ax.spines[s].set_color(INK_SOFT)

ax.yaxis.grid(True, alpha=0.18, linewidth=0.8, color=INK)

# Legend
survived_patch = mpatches.Patch(color=COLOR_SURVIVED, label="Survived")
died_patch = mpatches.Patch(color=COLOR_DIED, label="Did Not Survive")
leg = ax.legend(handles=[survived_patch, died_patch], fontsize=8, loc="upper right", framealpha=1.0)
leg.get_frame().set_facecolor(ELEVATED_BG)
leg.get_frame().set_edgecolor(INK_SOFT)
plt.setp(leg.get_texts(), color=INK_SOFT)

plt.tight_layout()
plt.savefig(os.path.join(_OUT, f"plot-{THEME}.png"), dpi=400, facecolor=PAGE_BG)
Runnable source as JSON, for any HTTP client: https://api.anyplot.ai/specs/bar-spine/matplotlib/code. Any spec id and library id listed in llms-full.txt fit the same URL shape; every URL below is complete and callable.
{
  "spec_id": "bar-spine",
  "language": "python",
  "library": "matplotlib",
  "page": "https://anyplot.ai/bar-spine/python/matplotlib",
  "hub": "https://anyplot.ai/bar-spine",
  "code_json": "https://api.anyplot.ai/specs/bar-spine/matplotlib/code",
  "spec_json": "https://api.anyplot.ai/specs/bar-spine",
  "render_light_png": "https://storage.googleapis.com/anyplot-images/plots/bar-spine/python/matplotlib/plot-light.png",
  "render_dark_png": "https://storage.googleapis.com/anyplot-images/plots/bar-spine/python/matplotlib/plot-dark.png",
  "quality_score": 91.0,
  "license": "MIT",
  "guide": "https://anyplot.ai/llms.txt"
}
Part of Spine Plot for Two-Variable Proportions on anyplot.ai.