The same plot in 14 other libraries — JavaScript: D3.js, Apache ECharts, Highcharts, MUI X Charts; Python: Altair, Bokeh, lets-plot, Matplotlib, Plotly, plotnine, Pygal, Seaborn; R: ggplot2; Julia: Makie.jl. Compare all 15 side by side: Tornado Diagram for Sensitivity Analysis in Python, R, Julia and JavaScript.
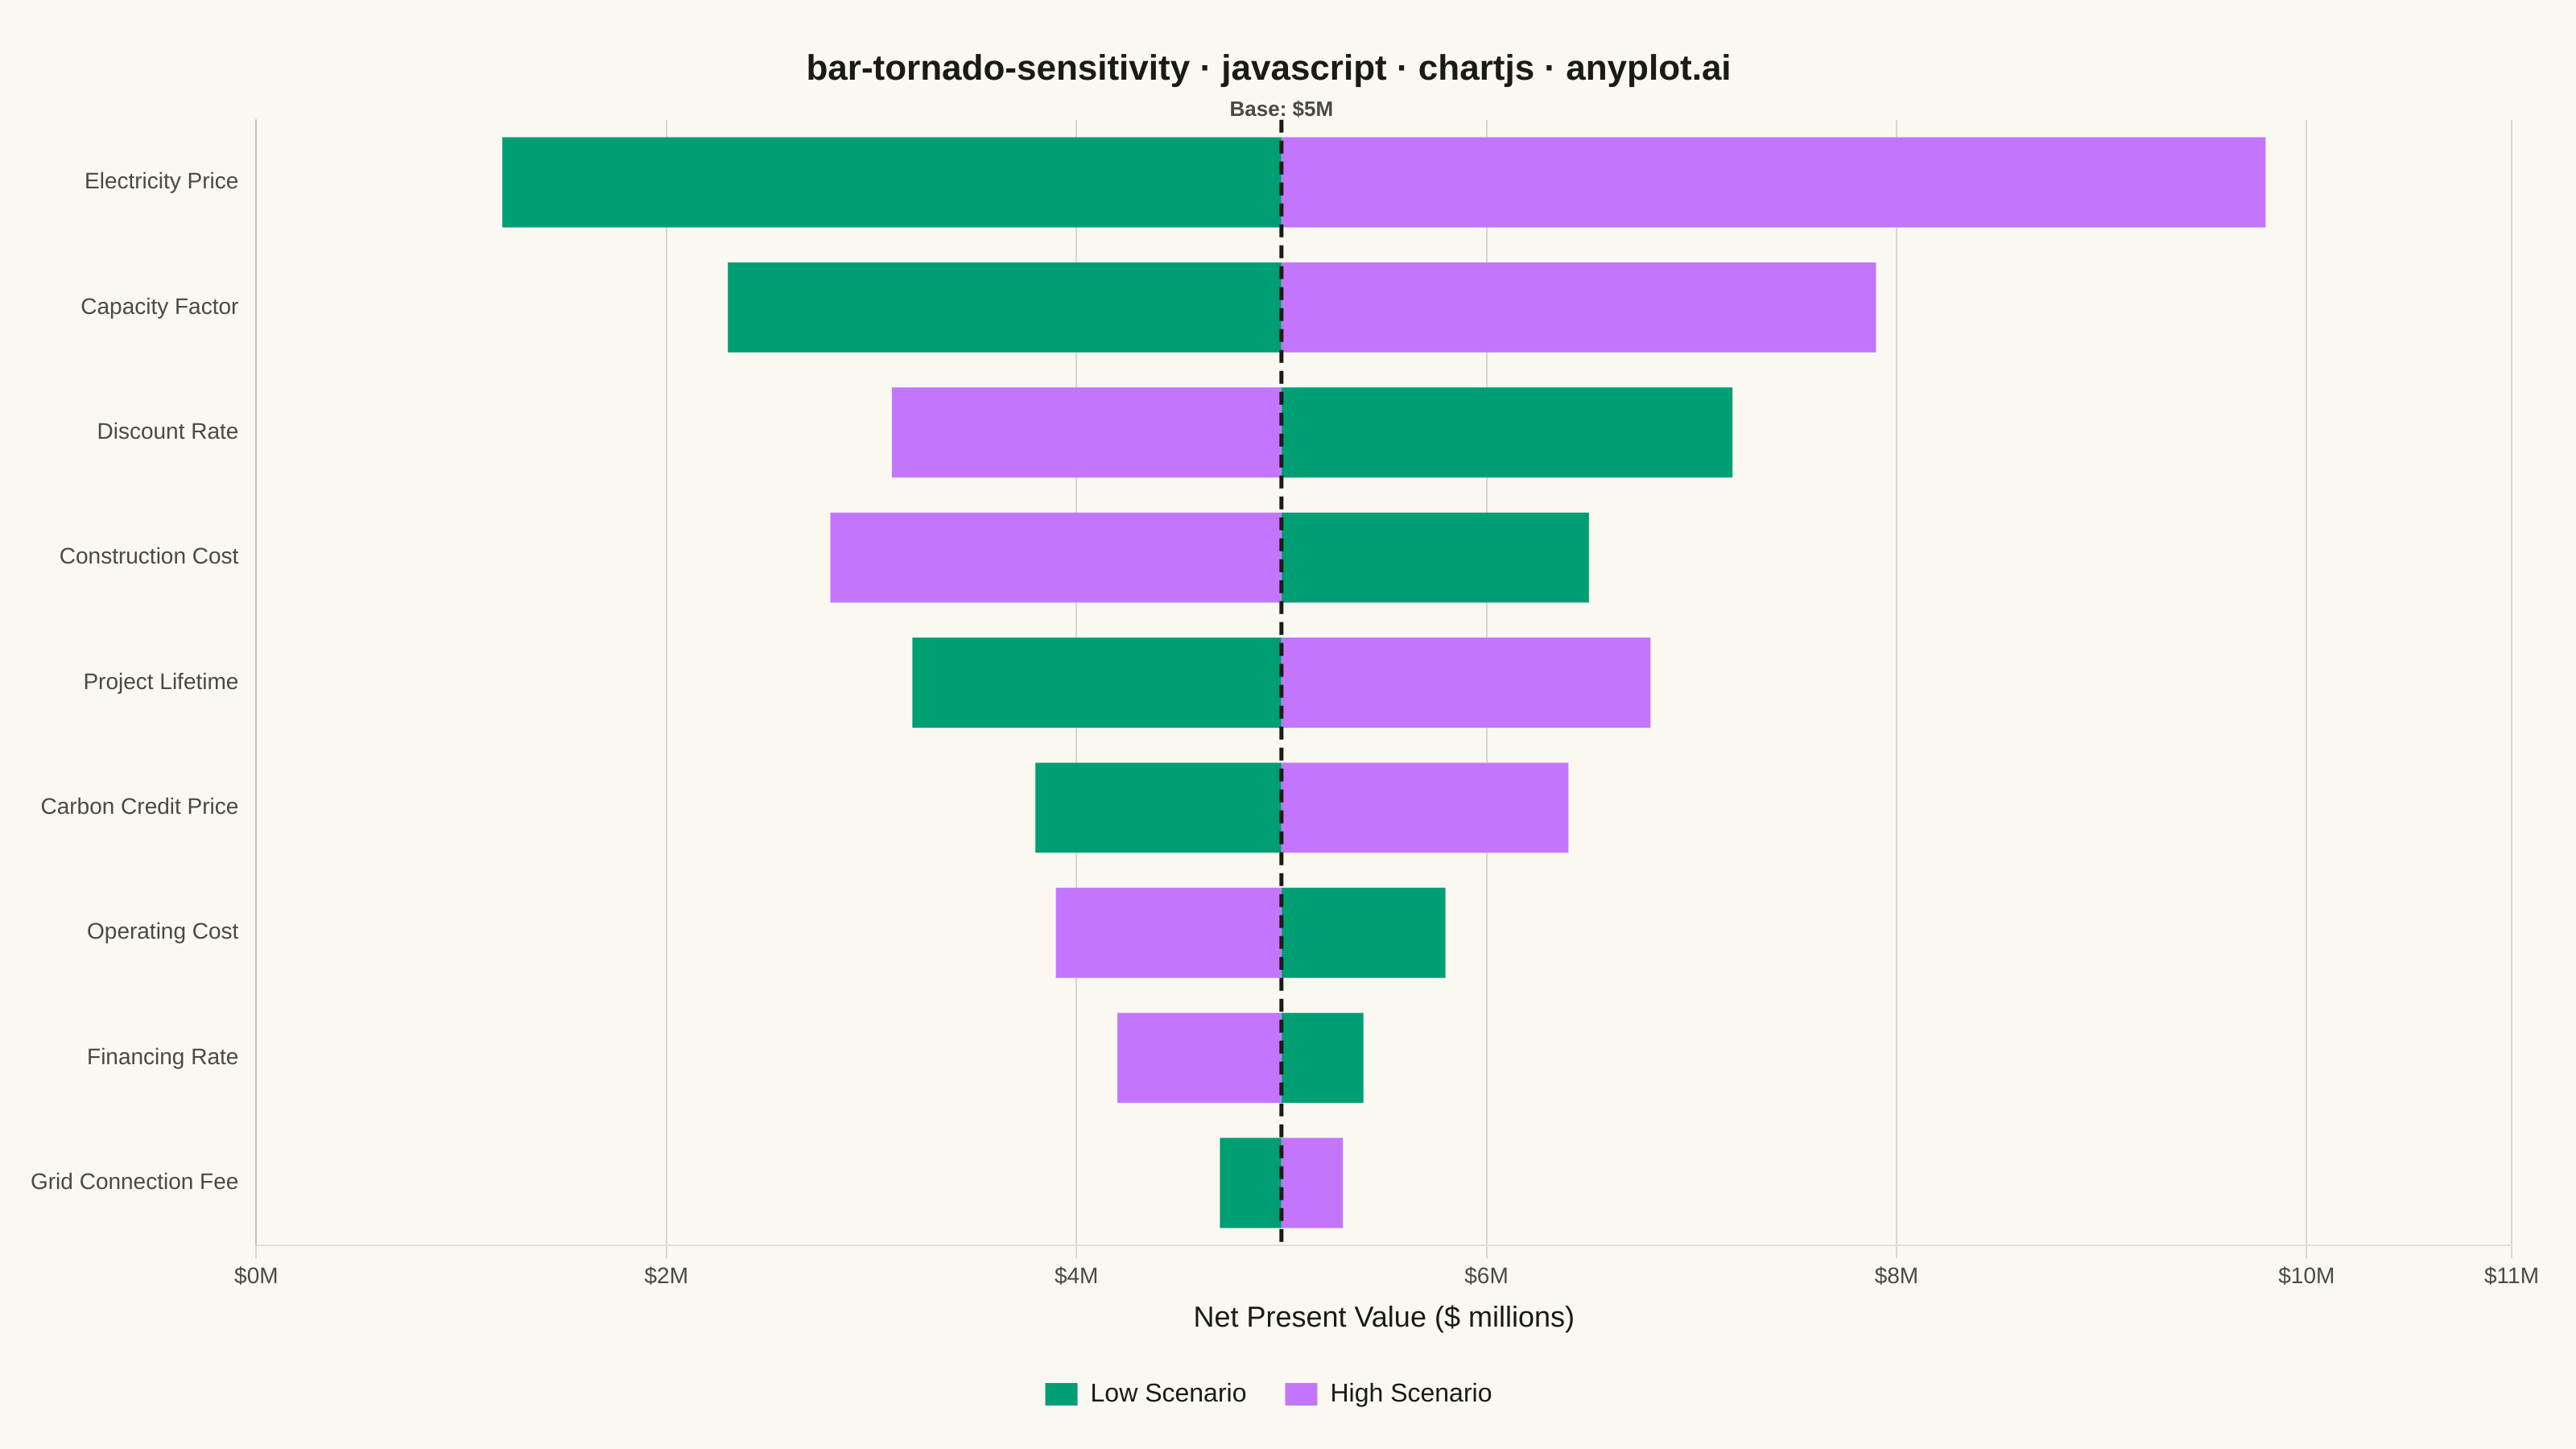
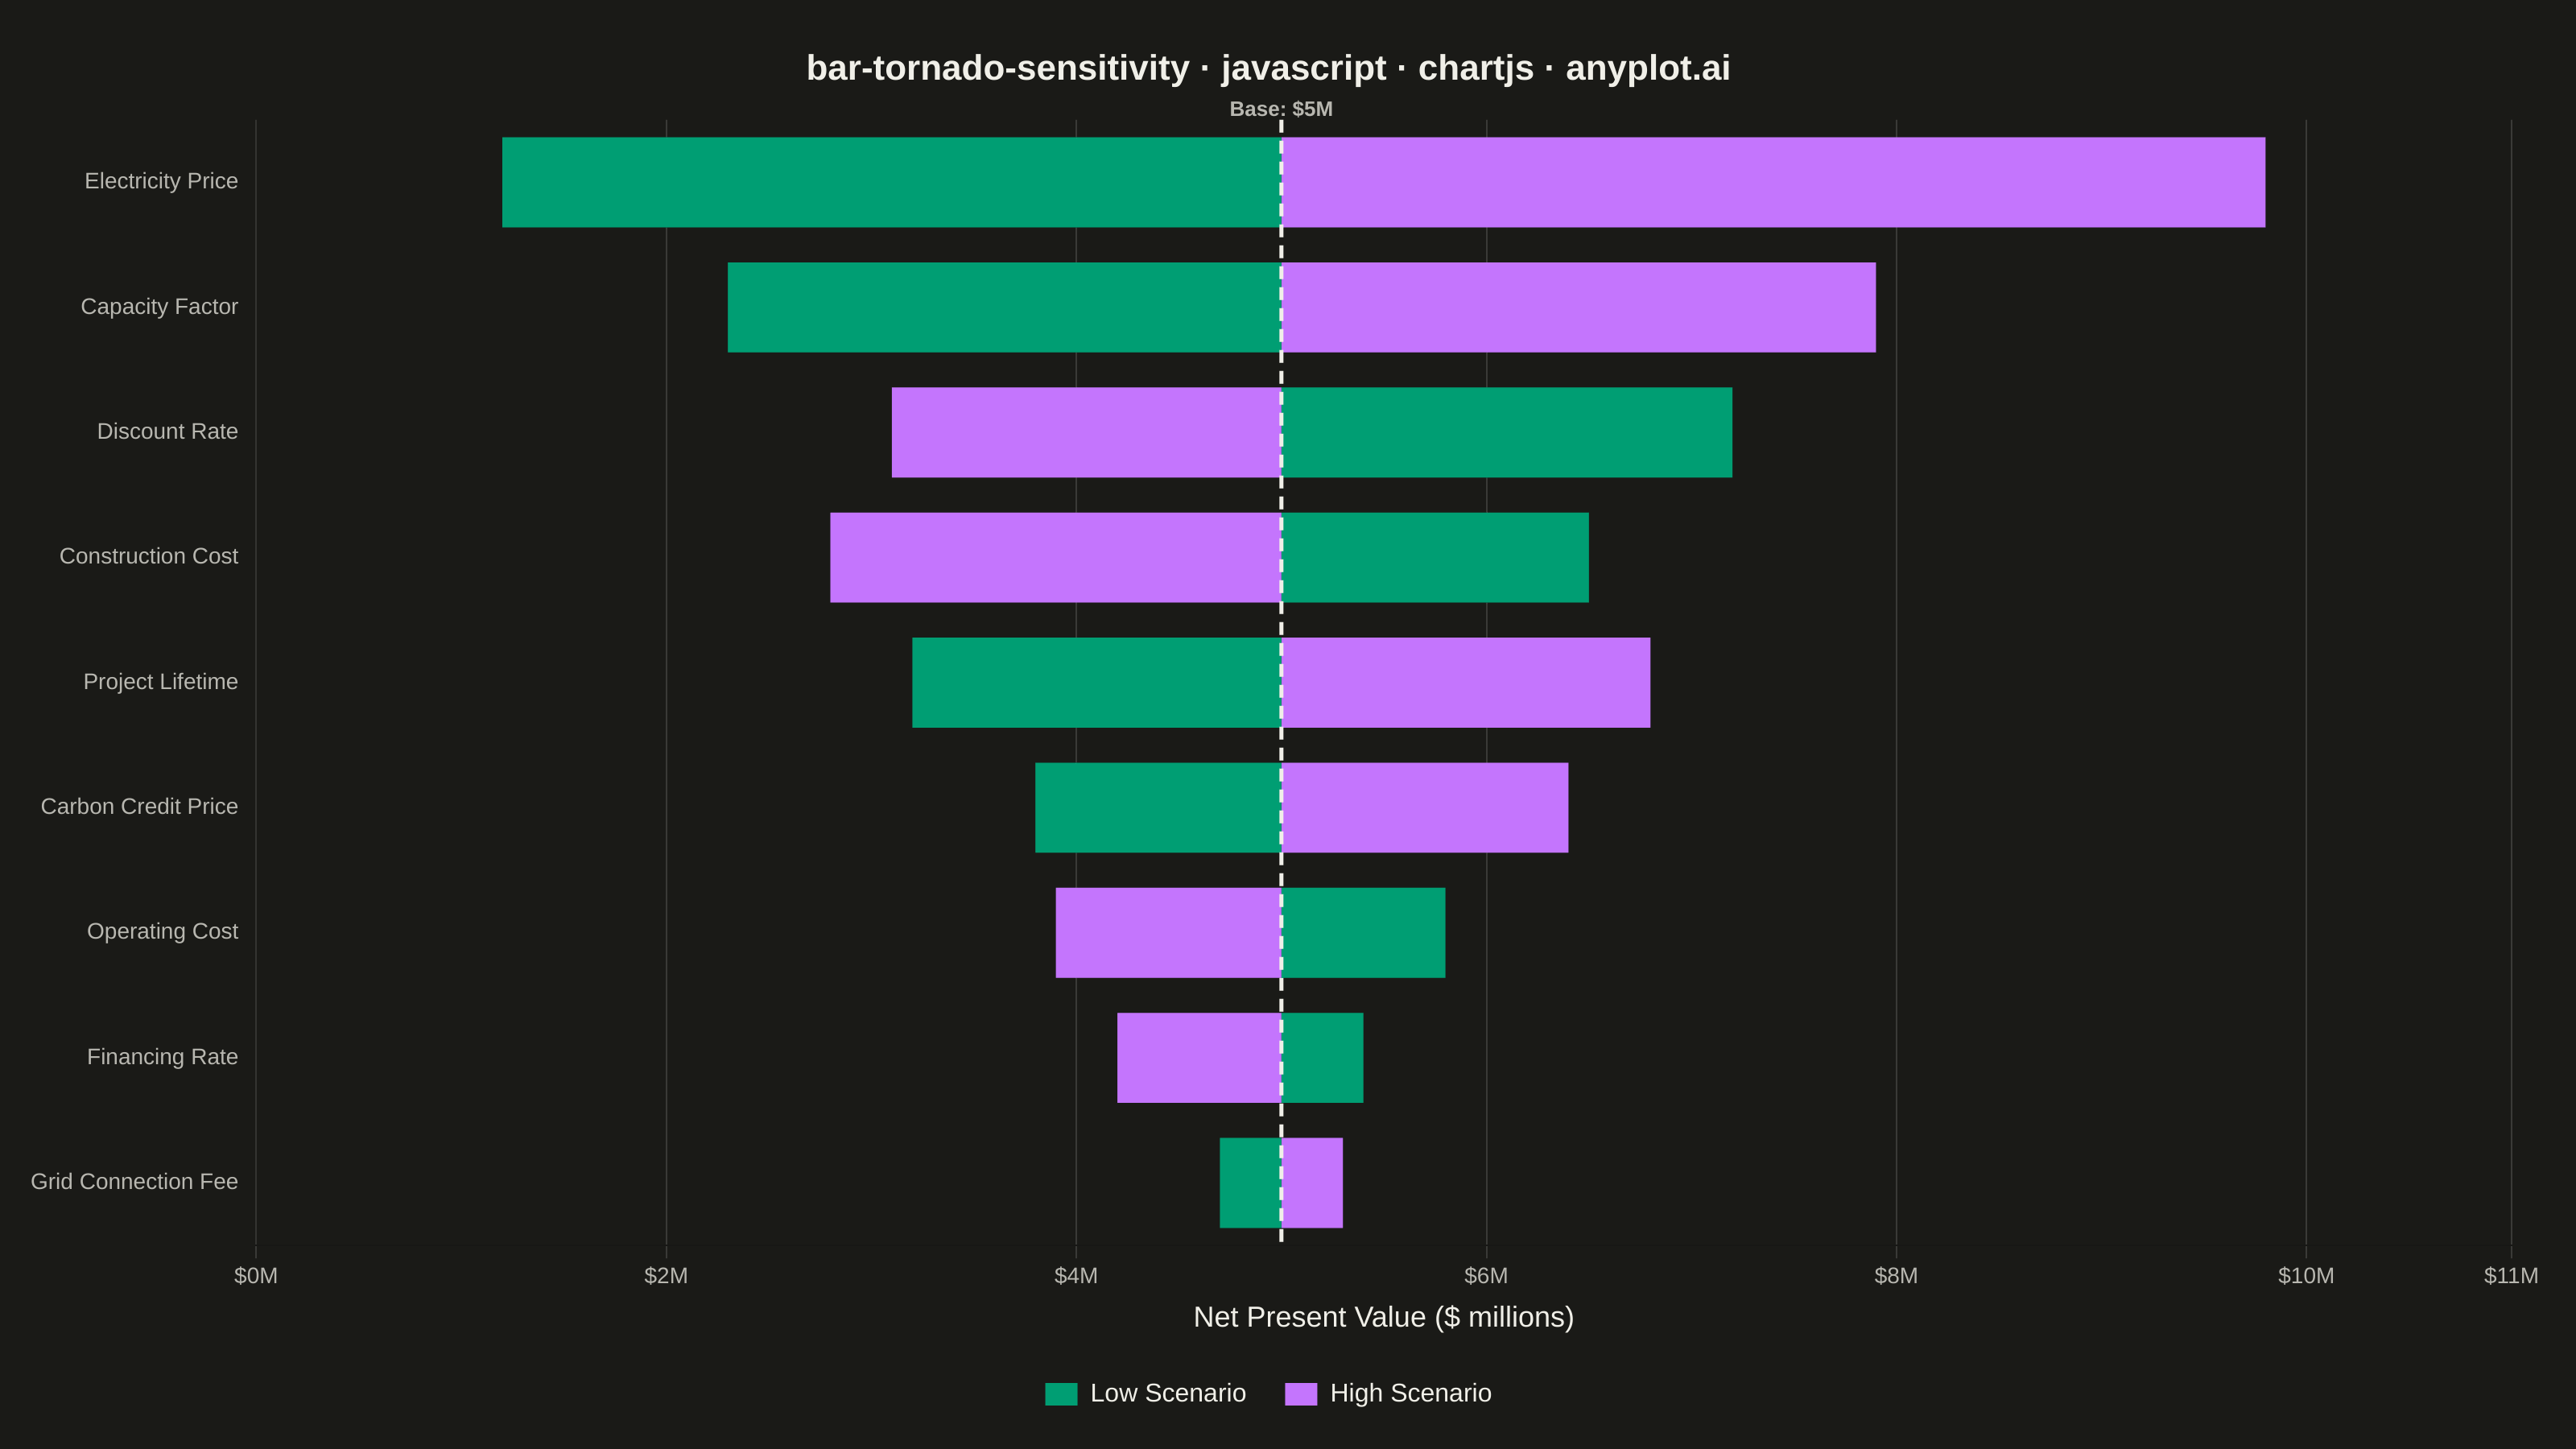
A horizontal bar chart where bars are sorted by influence magnitude, extending left and right from a base case vertical reference line. Each bar represents one input parameter and shows how varying that parameter between its low and high values affects the output, creating a characteristic tornado shape (widest bars at top, narrowest at bottom). Dual colors distinguish low-input from high-input effects, making it immediately clear which parameters drive the most uncertainty.
// anyplot.ai
// bar-tornado-sensitivity: Tornado Diagram for Sensitivity Analysis
// Library: chartjs 4.4.7 | JavaScript 22.22.3
// Quality: 90/100 | Created: 2026-06-02

const t = window.ANYPLOT_TOKENS;
const BASE_VALUE = 5.0;

// One-way NPV sensitivity for a renewable energy project ($ millions, base = $5M)
// Sorted by total range (|high - low|) descending — widest bar at top
const parameters = [
  { label: "Electricity Price",   low: 1.2, high: 9.8 },
  { label: "Capacity Factor",     low: 2.3, high: 7.9 },
  { label: "Discount Rate",       low: 7.2, high: 3.1 },
  { label: "Construction Cost",   low: 6.5, high: 2.8 },
  { label: "Project Lifetime",    low: 3.2, high: 6.8 },
  { label: "Carbon Credit Price", low: 3.8, high: 6.4 },
  { label: "Operating Cost",      low: 5.8, high: 3.9 },
  { label: "Financing Rate",      low: 5.4, high: 4.2 },
  { label: "Grid Connection Fee", low: 4.7, high: 5.3 },
];

// Three-dataset stacked approach: transparent filler + left segment + right segment.
// Regular (non-floating) stacked bars guarantee correct x-axis positioning.
// Left segment = green (low scenario effect), right segment = purple (high scenario effect).
// For inverted parameters (low NPV > base), segments swap sides — handled via per-bar colors.
const lowColor  = t.palette[0];  // Imprint green — first series, low scenario
const highColor = t.palette[1];  // Imprint purple — high scenario

const fillerData = parameters.map(p => Math.min(p.low, p.high));
const leftData   = parameters.map(p => BASE_VALUE - Math.min(p.low, p.high));
const rightData  = parameters.map(p => Math.max(p.low, p.high) - BASE_VALUE);

// Left segment: green if p.low is on the left of base (normal), purple if inverted
const leftColors  = parameters.map(p => p.low <= BASE_VALUE ? lowColor : highColor);
// Right segment: purple if p.high is on the right of base (normal), green if inverted
const rightColors = parameters.map(p => p.high >= BASE_VALUE ? highColor : lowColor);

const canvas = document.createElement("canvas");
document.getElementById("container").appendChild(canvas);

const bgPlugin = {
  id: "bg",
  beforeDraw({ ctx, width, height }) {
    ctx.save();
    ctx.fillStyle = t.pageBg;
    ctx.fillRect(0, 0, width, height);
    ctx.restore();
  },
};

const baseLinePlugin = {
  id: "baseLine",
  afterDraw({ ctx, scales: { x, y } }) {
    const bx = x.getPixelForValue(BASE_VALUE);
    ctx.save();
    ctx.beginPath();
    ctx.moveTo(bx, y.top);
    ctx.lineTo(bx, y.bottom);
    ctx.strokeStyle = t.ink;
    ctx.lineWidth = 2.5;
    ctx.setLineDash([8, 5]);
    ctx.stroke();
    ctx.setLineDash([]);
    ctx.font = "bold 13px sans-serif";
    ctx.fillStyle = t.inkSoft;
    ctx.textAlign = "center";
    ctx.fillText("Base: $5M", bx, y.top - 6);
    ctx.restore();
  },
};

new Chart(canvas, {
  type: "bar",
  data: {
    labels: parameters.map(p => p.label),
    datasets: [
      {
        label: "_filler",
        data: fillerData,
        backgroundColor: "transparent",
        borderWidth: 0,
      },
      {
        label: "Low Scenario",
        data: leftData,
        backgroundColor: leftColors,
        borderWidth: 0,
      },
      {
        label: "High Scenario",
        data: rightData,
        backgroundColor: rightColors,
        borderWidth: 0,
      },
    ],
  },
  options: {
    indexAxis: "y",
    responsive: true,
    maintainAspectRatio: false,
    animation: false,
    plugins: {
      title: {
        display: true,
        text: "bar-tornado-sensitivity · javascript · chartjs · anyplot.ai",
        color: t.ink,
        font: { size: 22, weight: "bold" },
        padding: { top: 10, bottom: 18 },
      },
      legend: {
        position: "bottom",
        labels: {
          color: t.ink,
          font: { size: 16 },
          padding: 24,
          boxWidth: 20,
          boxHeight: 14,
          filter: (item) => !item.text.startsWith("_"),
        },
      },
    },
    scales: {
      x: {
        stacked: true,
        min: 0,
        max: 11,
        title: {
          display: true,
          text: "Net Present Value ($ millions)",
          color: t.ink,
          font: { size: 18 },
        },
        ticks: {
          color: t.inkSoft,
          font: { size: 14 },
          callback: (v) => `$${v}M`,
        },
        grid: { color: t.grid },
      },
      y: {
        stacked: true,
        ticks: {
          color: t.inkSoft,
          font: { size: 14 },
        },
        grid: { display: false },
      },
    },
    layout: {
      padding: { left: 16, right: 40, top: 20, bottom: 16 },
    },
  },
  plugins: [bgPlugin, baseLinePlugin],
});
Runnable source as JSON, for any HTTP client: https://api.anyplot.ai/specs/bar-tornado-sensitivity/chartjs/code. Any spec id and library id listed in llms-full.txt fit the same URL shape; every URL below is complete and callable.
{
  "spec_id": "bar-tornado-sensitivity",
  "language": "javascript",
  "library": "chartjs",
  "page": "https://anyplot.ai/bar-tornado-sensitivity/javascript/chartjs",
  "hub": "https://anyplot.ai/bar-tornado-sensitivity",
  "code_json": "https://api.anyplot.ai/specs/bar-tornado-sensitivity/chartjs/code",
  "spec_json": "https://api.anyplot.ai/specs/bar-tornado-sensitivity",
  "render_light_png": "https://storage.googleapis.com/anyplot-images/plots/bar-tornado-sensitivity/javascript/chartjs/plot-light.png",
  "render_dark_png": "https://storage.googleapis.com/anyplot-images/plots/bar-tornado-sensitivity/javascript/chartjs/plot-dark.png",
  "interactive_light_html": "https://storage.googleapis.com/anyplot-images/plots/bar-tornado-sensitivity/javascript/chartjs/plot-light.html",
  "interactive_dark_html": "https://storage.googleapis.com/anyplot-images/plots/bar-tornado-sensitivity/javascript/chartjs/plot-dark.html",
  "quality_score": 90.0,
  "license": "MIT",
  "guide": "https://anyplot.ai/llms.txt"
}
Part of Tornado Diagram for Sensitivity Analysis on anyplot.ai.