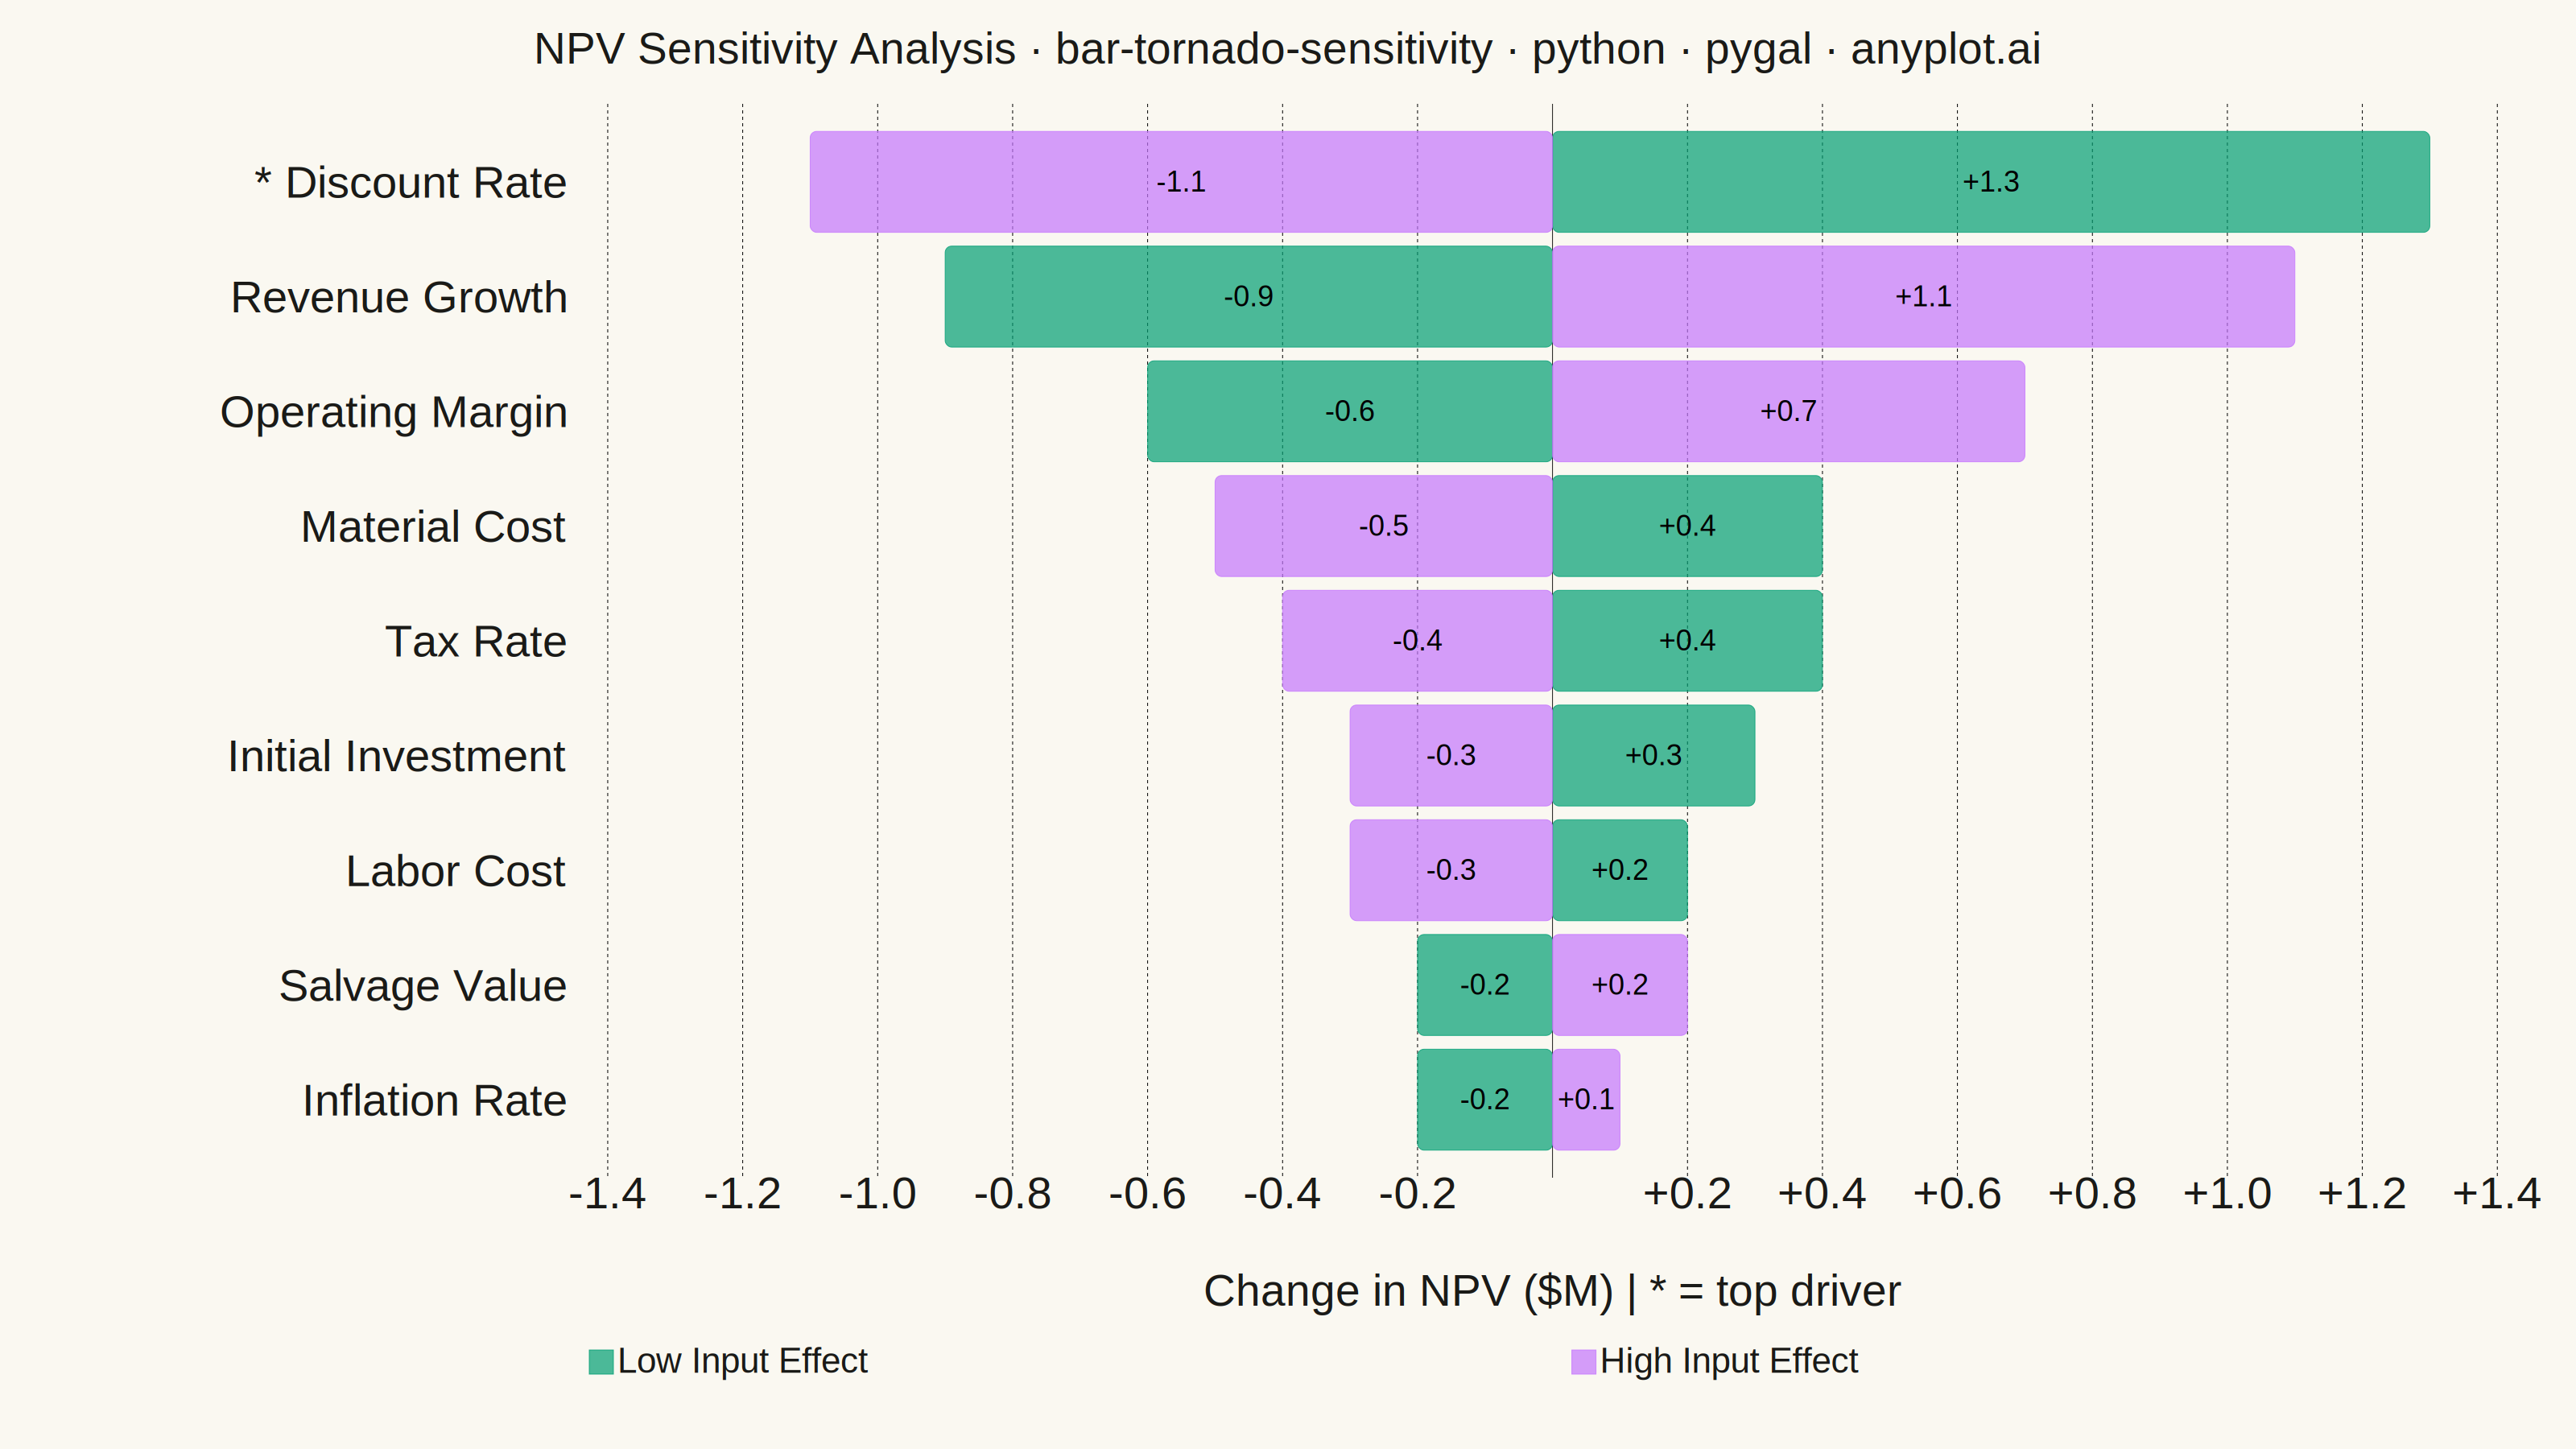
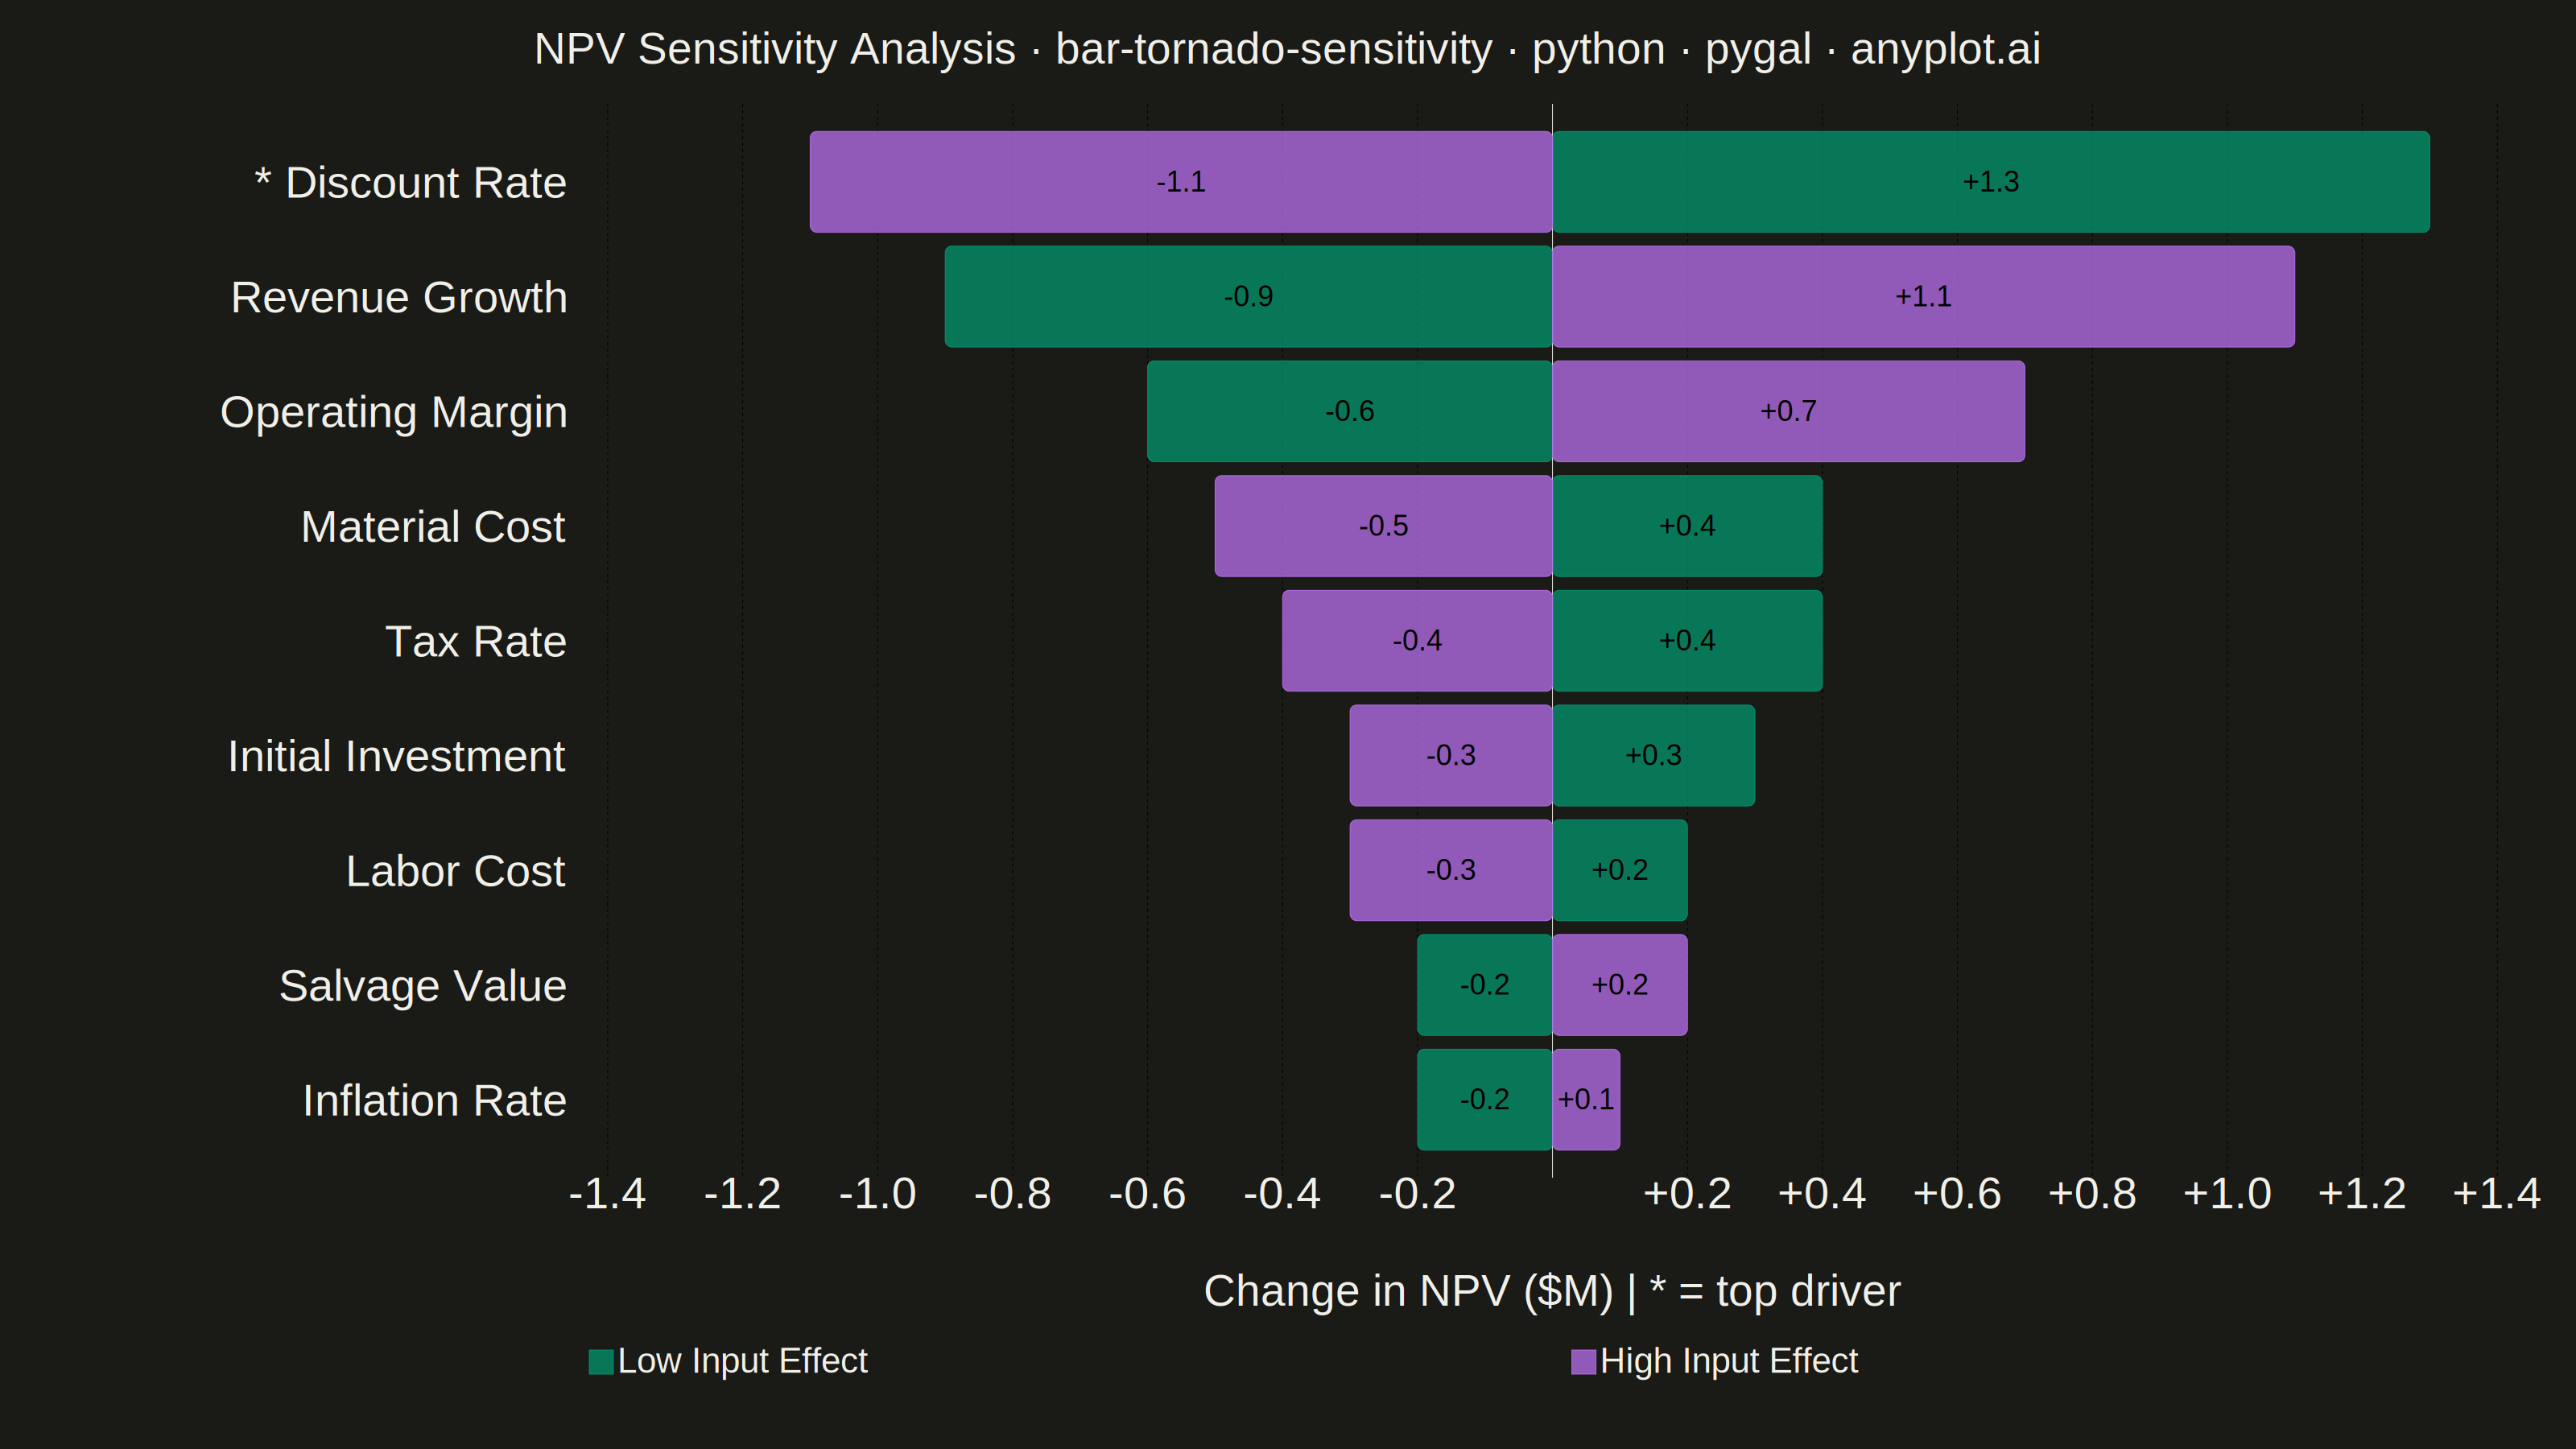
A horizontal bar chart where bars are sorted by influence magnitude, extending left and right from a base case vertical reference line. Each bar represents one input parameter and shows how varying that parameter between its low and high values affects the output, creating a characteristic tornado shape (widest bars at top, narrowest at bottom). Dual colors distinguish low-input from high-input effects, making it immediately clear which parameters drive the most uncertainty.
""" anyplot.ai
bar-tornado-sensitivity: Tornado Diagram for Sensitivity Analysis
Library: pygal 3.1.0 | Python 3.13.13
Quality: 88/100 | Updated: 2026-06-02
"""

import importlib.util
import os
import sys


# Prevent this file (pygal.py) from shadowing the installed pygal package
pygal_spec = importlib.util.find_spec("pygal")
if pygal_spec and pygal_spec.origin != __file__:
    import pygal
    from pygal.style import Style
else:
    _here = os.path.dirname(os.path.abspath(__file__))
    sys.path = [p for p in sys.path if os.path.abspath(p) != _here]
    try:
        import pygal
        from pygal.style import Style
    finally:
        sys.path.insert(0, _here)

# Theme tokens
THEME = os.getenv("ANYPLOT_THEME", "light")
PAGE_BG = "#FAF8F1" if THEME == "light" else "#1A1A17"
INK = "#1A1A17" if THEME == "light" else "#F0EFE8"
INK_SOFT = "#4A4A44" if THEME == "light" else "#B8B7B0"
INK_MUTED = "#6B6A63" if THEME == "light" else "#A8A79F"

# Imprint categorical palette — canonical order; first series always #009E73
IMPRINT_PALETTE = ("#009E73", "#C475FD", "#4467A3", "#BD8233", "#AE3030", "#2ABCCD", "#954477", "#99B314")

# Data — NPV sensitivity analysis for a capital investment project
# Base case NPV = $2.5M; each parameter varied between its low and high scenarios
parameters = [
    "Discount Rate",
    "Revenue Growth",
    "Material Cost",
    "Labor Cost",
    "Tax Rate",
    "Salvage Value",
    "Initial Investment",
    "Operating Margin",
    "Inflation Rate",
]
base_value = 2.5  # $2.5M base case NPV

low_values = [3.8, 1.6, 2.9, 2.7, 2.9, 2.3, 2.8, 1.9, 2.3]
high_values = [1.4, 3.6, 2.0, 2.2, 2.1, 2.7, 2.2, 3.2, 2.6]

# Compute deviations from base and sort by total range (widest bar at top)
deviations = []
for i, param in enumerate(parameters):
    low_dev = low_values[i] - base_value
    high_dev = high_values[i] - base_value
    total_range = abs(high_values[i] - low_values[i])
    deviations.append((param, low_dev, high_dev, total_range))

# Ascending sort: pygal draws the last-added x_label at the top
deviations.sort(key=lambda x: x[3], reverse=False)

sorted_params = [d[0] for d in deviations]
sorted_low_devs = [d[1] for d in deviations]
sorted_high_devs = [d[2] for d in deviations]

# Mark the top driver (last in ascending sort = widest bar = top of chart)
sorted_params[-1] = f"* {sorted_params[-1]}"

# Title with length-based fontsize scaling (67-char baseline at size 66)
title_text = "NPV Sensitivity Analysis · bar-tornado-sensitivity · python · pygal · anyplot.ai"
n = len(title_text)
title_fs = max(round(66 * 67 / n), 44) if n > 67 else 66  # floor 44

# Style — Imprint palette, theme-adaptive chrome
custom_style = Style(
    background=PAGE_BG,
    plot_background=PAGE_BG,
    foreground=INK,
    foreground_strong=INK,
    foreground_subtle=INK_MUTED,
    colors=IMPRINT_PALETTE,
    title_font_size=title_fs,
    label_font_size=56,
    major_label_font_size=44,
    legend_font_size=44,
    value_font_size=36,
    value_label_font_size=36,
    tooltip_font_size=36,
    title_font_family="Helvetica, Arial, sans-serif",
    label_font_family="Helvetica, Arial, sans-serif",
    value_font_family="Helvetica, Arial, sans-serif",
    legend_font_family="Helvetica, Arial, sans-serif",
    major_label_font_family="Helvetica, Arial, sans-serif",
)

# Plot — HorizontalStackedBar with zero reference line (tornado shape)
chart = pygal.HorizontalStackedBar(
    width=3200,
    height=1800,
    style=custom_style,
    title=title_text,
    x_title="Change in NPV ($M)  |  * = top driver",
    show_legend=True,
    legend_at_bottom=True,
    legend_at_bottom_columns=2,
    legend_box_size=30,
    show_x_guides=False,
    show_y_guides=False,
    y_labels_major=[0],
    range=(-1.4, 1.4),
    print_values=True,
    print_values_position="center",
    value_formatter=lambda x: f"{x:+.1f}" if x else "",
    margin=50,
    margin_left=80,
    margin_right=50,
    margin_bottom=110,
    spacing=24,
    truncate_label=-1,
    rounded_bars=8,
    zero=0,
)

chart.x_labels = sorted_params

# Dict-based values provide rich interactive tooltips — distinctive pygal feature
low_series = [
    {"value": v, "label": f"{p}: NPV ${base_value + v:.1f}M (base ${base_value}M)"}
    for v, p in zip(sorted_low_devs, sorted_params, strict=True)
]
high_series = [
    {"value": v, "label": f"{p}: NPV ${base_value + v:.1f}M (base ${base_value}M)"}
    for v, p in zip(sorted_high_devs, sorted_params, strict=True)
]

chart.add("Low Input Effect", low_series)
chart.add("High Input Effect", high_series)

# Save — interactive HTML + static PNG (pygal is an interactive library)
with open(f"plot-{THEME}.html", "wb") as f:
    f.write(chart.render())
chart.render_to_png(f"plot-{THEME}.png")
Runnable source as JSON, for any HTTP client: https://api.anyplot.ai/specs/bar-tornado-sensitivity/pygal/code. Any spec id and library id listed in llms-full.txt fit the same URL shape; every URL below is complete and callable.
{
  "spec_id": "bar-tornado-sensitivity",
  "language": "python",
  "library": "pygal",
  "page": "https://anyplot.ai/bar-tornado-sensitivity/python/pygal",
  "hub": "https://anyplot.ai/bar-tornado-sensitivity",
  "code_json": "https://api.anyplot.ai/specs/bar-tornado-sensitivity/pygal/code",
  "spec_json": "https://api.anyplot.ai/specs/bar-tornado-sensitivity",
  "render_light_png": "https://storage.googleapis.com/anyplot-images/plots/bar-tornado-sensitivity/python/pygal/plot-light.png",
  "render_dark_png": "https://storage.googleapis.com/anyplot-images/plots/bar-tornado-sensitivity/python/pygal/plot-dark.png",
  "interactive_light_html": "https://storage.googleapis.com/anyplot-images/plots/bar-tornado-sensitivity/python/pygal/plot-light.html",
  "interactive_dark_html": "https://storage.googleapis.com/anyplot-images/plots/bar-tornado-sensitivity/python/pygal/plot-dark.html",
  "quality_score": 88.0,
  "license": "MIT",
  "guide": "https://anyplot.ai/llms.txt"
}
Part of Tornado Diagram for Sensitivity Analysis on anyplot.ai.