The same plot in 14 other libraries — JavaScript: Chart.js, D3.js, Apache ECharts, MUI X Charts; Python: Altair, Bokeh, lets-plot, Matplotlib, Plotly, plotnine, Pygal, Seaborn; R: ggplot2; Julia: Makie.jl. Compare all 15 side by side: Tornado Diagram for Sensitivity Analysis in Python, R, Julia and JavaScript.
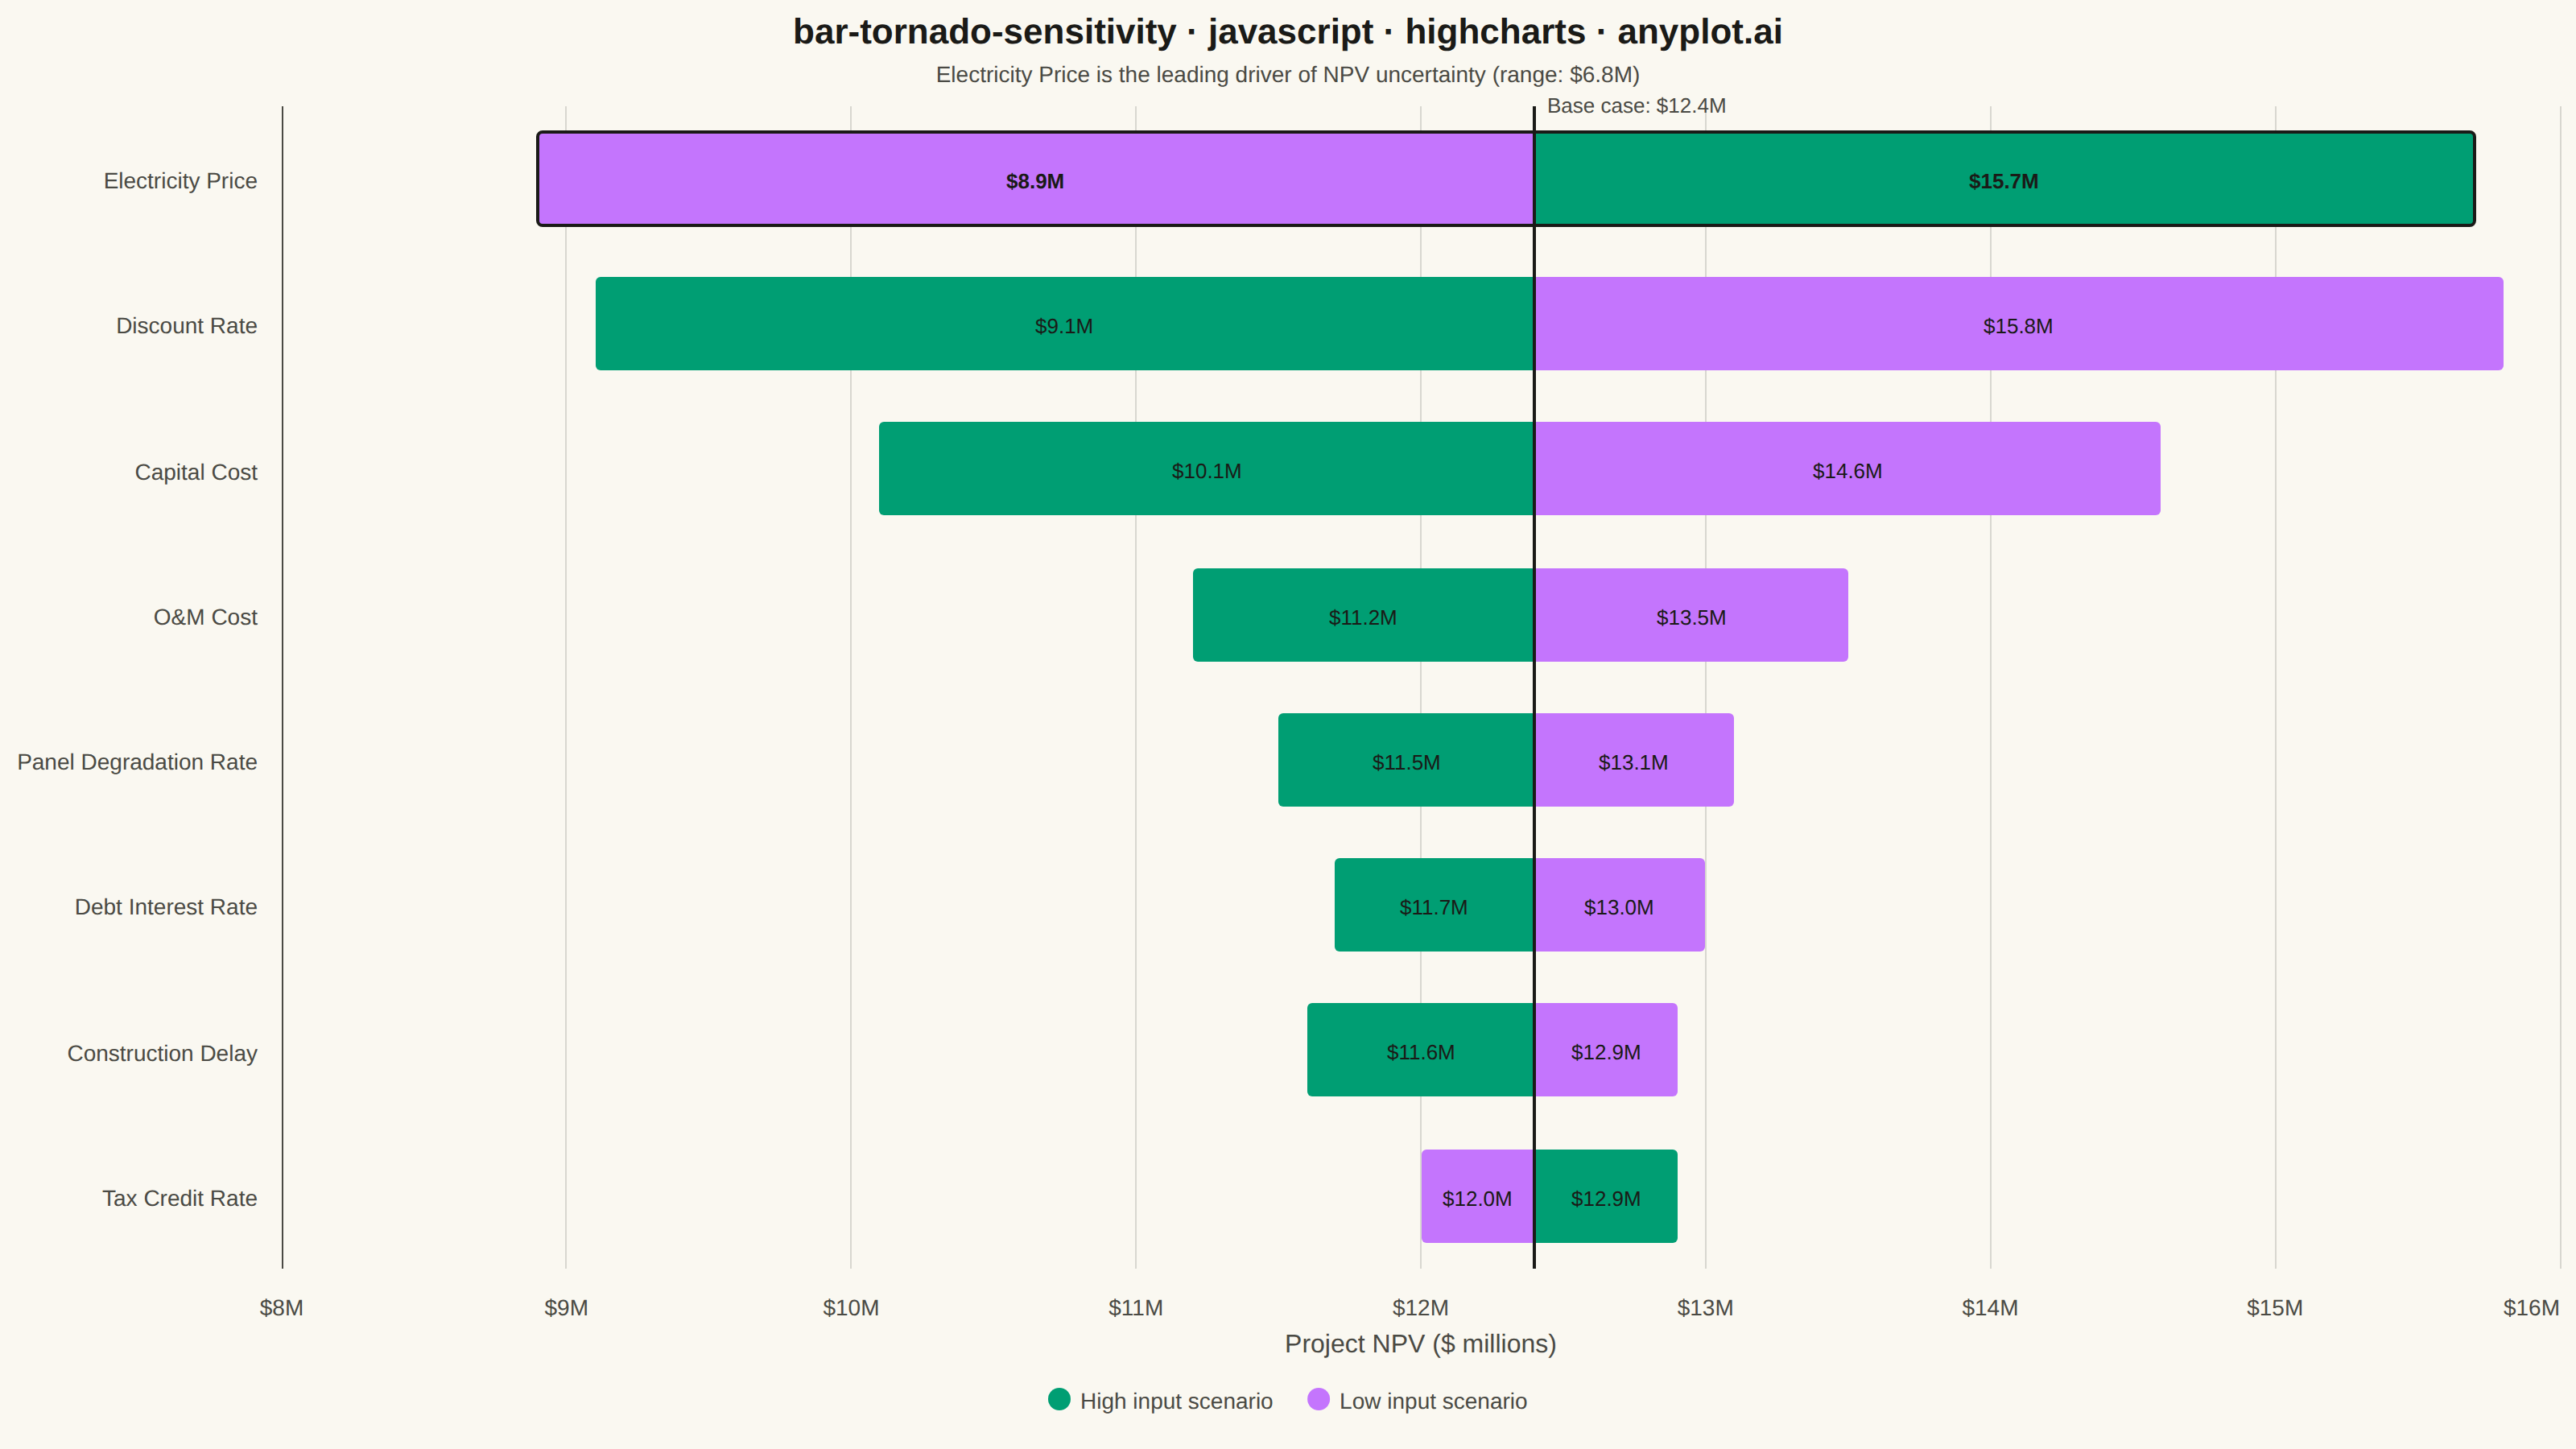
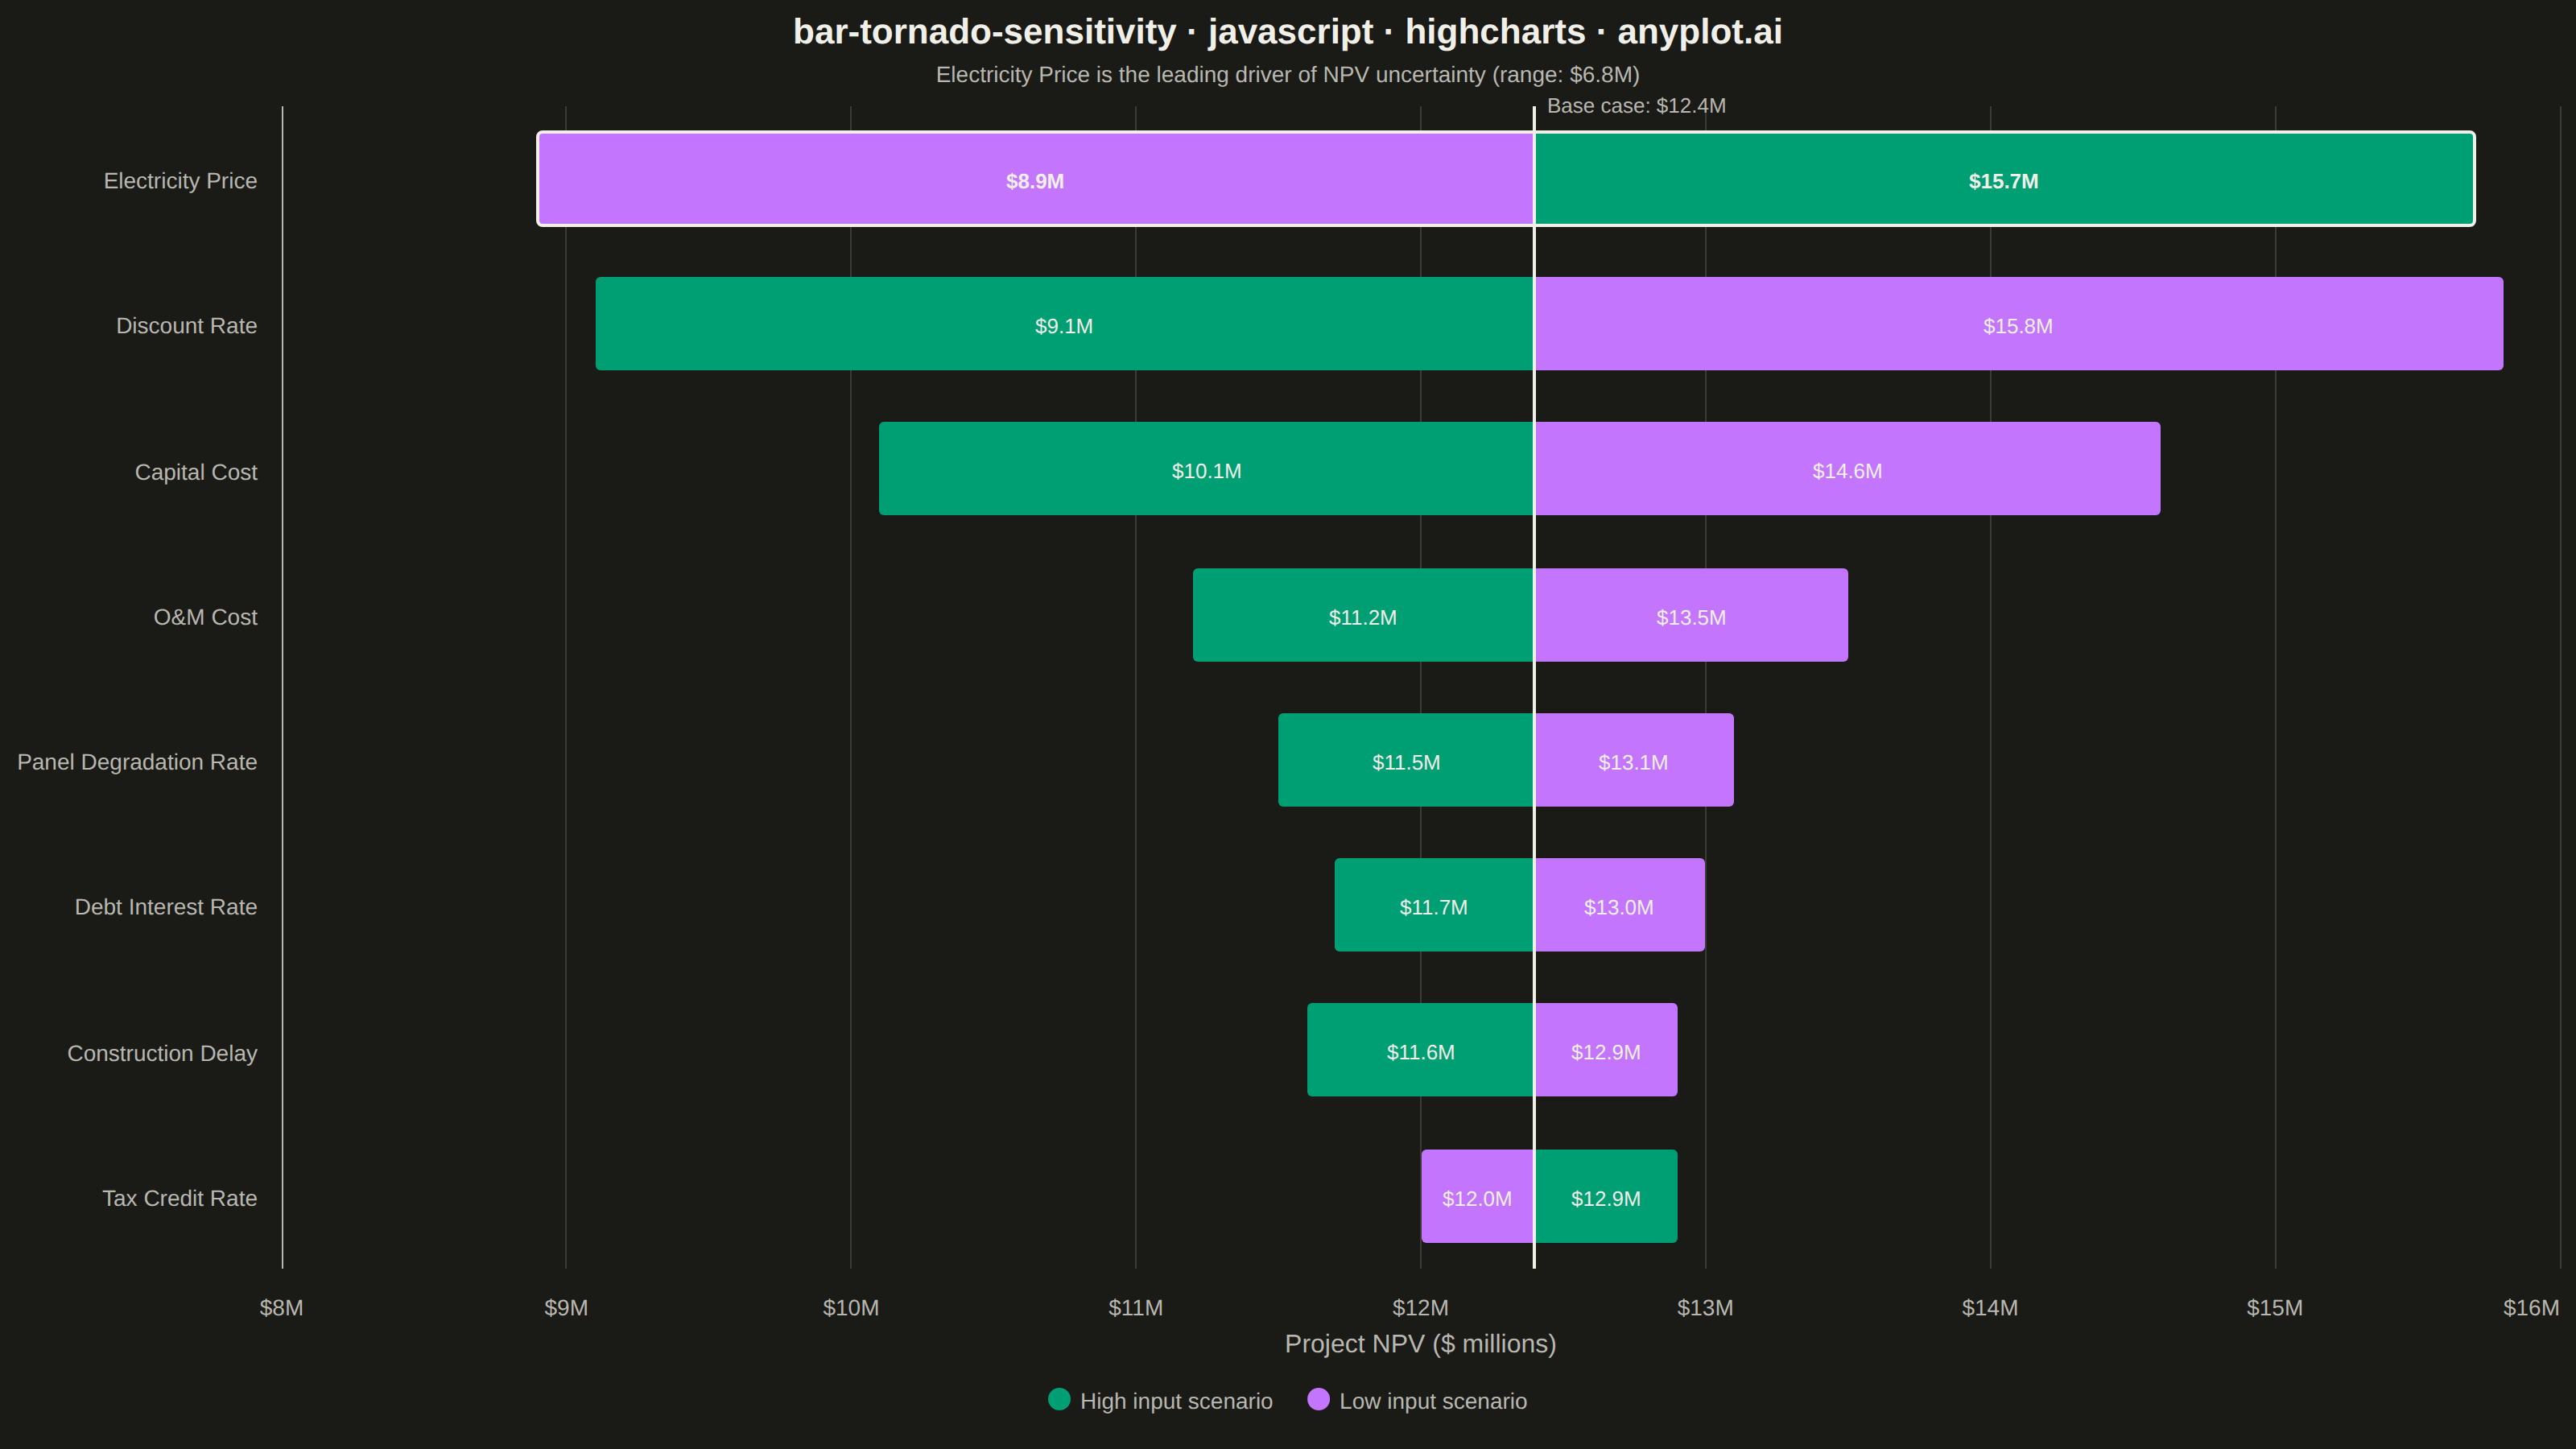
A horizontal bar chart where bars are sorted by influence magnitude, extending left and right from a base case vertical reference line. Each bar represents one input parameter and shows how varying that parameter between its low and high values affects the output, creating a characteristic tornado shape (widest bars at top, narrowest at bottom). Dual colors distinguish low-input from high-input effects, making it immediately clear which parameters drive the most uncertainty.
// anyplot.ai
// bar-tornado-sensitivity: Tornado Diagram for Sensitivity Analysis
// Library: highcharts 12.6.0 | JavaScript 22.23.2
// Quality: 93/100 | Created: 2026-08-20

const t = window.ANYPLOT_TOKENS;

// --- Data (in-memory, deterministic) ----------------------------------------
// One-way sensitivity analysis: NPV of a solar farm project ($ millions) under
// low/high scenarios for each input assumption, varied one at a time.
const BASE_VALUE = 12.4;
const parameters = [
  { name: "Electricity Price", low: 8.9, high: 15.7 },
  { name: "Discount Rate", low: 15.8, high: 9.1 },
  { name: "Capital Cost", low: 14.6, high: 10.1 },
  { name: "O&M Cost", low: 13.5, high: 11.2 },
  { name: "Panel Degradation Rate", low: 13.1, high: 11.5 },
  { name: "Debt Interest Rate", low: 13.0, high: 11.7 },
  { name: "Construction Delay", low: 12.9, high: 11.6 },
  { name: "Tax Credit Rate", low: 12.0, high: 12.9 },
].sort((a, b) => Math.abs(b.high - b.low) - Math.abs(a.high - a.low));

// Sorted descending by impact range so the widest bar lands at the top —
// Highcharts' "bar" (horizontal) type renders category index 0 at the top.
const categories = parameters.map((p) => p.name);
const topParam = parameters[0];
const topRange = Math.abs(topParam.high - topParam.low).toFixed(1);

// --- Round, evenly-spaced value-axis ticks -----------------------------------
// The stacked series live in "delta from base" space, but riders should read
// whole-dollar NPV values on the axis. Compute the round absolute tick values
// first, then convert each back into delta space for Highcharts' tickPositions.
const allDeltas = parameters.flatMap((p) => [p.high - BASE_VALUE, p.low - BASE_VALUE]);
const minAbs = Math.floor(BASE_VALUE + Math.min(...allDeltas));
const maxAbs = Math.ceil(BASE_VALUE + Math.max(...allDeltas));
const tickPositions = [];
for (let v = minAbs; v <= maxAbs; v++) tickPositions.push(+(v - BASE_VALUE).toFixed(4));

function pointEffect(value) {
  return value >= BASE_VALUE ? "raises" : "lowers";
}

// --- Chart -------------------------------------------------------------------
Highcharts.chart("container", {
  chart: {
    type: "bar",
    backgroundColor: "transparent",
    animation: false,
    style: { fontFamily: "inherit" },
  },
  credits: { enabled: false },
  colors: t.palette,
  title: {
    text: "bar-tornado-sensitivity · javascript · highcharts · anyplot.ai",
    style: { color: t.ink, fontSize: "22px", fontWeight: "600" },
  },
  subtitle: {
    text: `${topParam.name} is the leading driver of NPV uncertainty (range: $${topRange}M)`,
    style: { color: t.inkSoft, fontSize: "14px" },
  },
  xAxis: {
    categories,
    lineColor: t.inkSoft,
    tickColor: t.inkSoft,
    gridLineWidth: 0,
    labels: { style: { color: t.inkSoft, fontSize: "14px" } },
  },
  yAxis: {
    title: {
      text: "Project NPV ($ millions)",
      style: { color: t.inkSoft, fontSize: "16px" },
    },
    gridLineColor: t.grid,
    tickPositions,
    labels: {
      style: { color: t.inkSoft, fontSize: "14px" },
      formatter: function () {
        const v = Math.round((BASE_VALUE + this.value) * 10) / 10;
        return "$" + (Number.isInteger(v) ? v.toFixed(0) : v.toFixed(1)) + "M";
      },
    },
    plotLines: [
      {
        value: 0,
        color: t.ink,
        width: 2,
        zIndex: 5,
        label: {
          text: "Base case: $" + BASE_VALUE.toFixed(1) + "M",
          rotation: 0,
          align: "left",
          verticalAlign: "top",
          x: 8,
          y: 4,
          style: { color: t.inkSoft, fontSize: "13px" },
        },
      },
    ],
  },
  legend: {
    itemStyle: { color: t.inkSoft, fontSize: "14px" },
    itemHoverStyle: { color: t.ink },
  },
  tooltip: {
    formatter: function () {
      const outcome = BASE_VALUE + this.y;
      const scenario = this.point.custom.scenario;
      const effect = pointEffect(outcome);
      return (
        "<b>" +
        this.point.category +
        "</b><br/>" +
        scenario +
        " input " +
        effect +
        " NPV to <b>$" +
        outcome.toFixed(1) +
        "M</b>"
      );
    },
  },
  plotOptions: {
    series: { animation: false, stacking: "normal", pointPadding: 0.08, groupPadding: 0.12 },
    bar: { borderWidth: 0 },
  },
  series: [
    {
      name: "High input scenario",
      data: parameters.map((p, i) => ({
        y: +(p.high - BASE_VALUE).toFixed(1),
        custom: { scenario: "High" },
        // A subtle frame on the single highest-impact parameter draws the eye
        // to the tornado's key takeaway without adding a separate annotation.
        borderWidth: i === 0 ? 2 : 0,
        borderColor: i === 0 ? t.ink : undefined,
        dataLabels: i === 0 ? { style: { fontWeight: "800" } } : undefined,
      })),
      color: t.palette[0],
      dataLabels: {
        enabled: true,
        color: t.ink,
        style: { fontSize: "13px", fontWeight: "500", textOutline: "none" },
        formatter: function () {
          return "$" + (BASE_VALUE + this.y).toFixed(1) + "M";
        },
      },
    },
    {
      name: "Low input scenario",
      data: parameters.map((p, i) => ({
        y: +(p.low - BASE_VALUE).toFixed(1),
        custom: { scenario: "Low" },
        borderWidth: i === 0 ? 2 : 0,
        borderColor: i === 0 ? t.ink : undefined,
        dataLabels: i === 0 ? { style: { fontWeight: "800" } } : undefined,
      })),
      color: t.palette[1],
      dataLabels: {
        enabled: true,
        color: t.ink,
        style: { fontSize: "13px", fontWeight: "500", textOutline: "none" },
        formatter: function () {
          return "$" + (BASE_VALUE + this.y).toFixed(1) + "M";
        },
      },
    },
  ],
});
Runnable source as JSON, for any HTTP client: https://api.anyplot.ai/specs/bar-tornado-sensitivity/highcharts/code. Any spec id and library id listed in llms-full.txt fit the same URL shape; every URL below is complete and callable.
{
  "spec_id": "bar-tornado-sensitivity",
  "language": "javascript",
  "library": "highcharts",
  "page": "https://anyplot.ai/bar-tornado-sensitivity/javascript/highcharts",
  "hub": "https://anyplot.ai/bar-tornado-sensitivity",
  "code_json": "https://api.anyplot.ai/specs/bar-tornado-sensitivity/highcharts/code",
  "spec_json": "https://api.anyplot.ai/specs/bar-tornado-sensitivity",
  "render_light_png": "https://storage.googleapis.com/anyplot-images/plots/bar-tornado-sensitivity/javascript/highcharts/plot-light.png",
  "render_dark_png": "https://storage.googleapis.com/anyplot-images/plots/bar-tornado-sensitivity/javascript/highcharts/plot-dark.png",
  "interactive_light_html": "https://storage.googleapis.com/anyplot-images/plots/bar-tornado-sensitivity/javascript/highcharts/plot-light.html",
  "interactive_dark_html": "https://storage.googleapis.com/anyplot-images/plots/bar-tornado-sensitivity/javascript/highcharts/plot-dark.html",
  "quality_score": 93.0,
  "license": "MIT",
  "guide": "https://anyplot.ai/llms.txt"
}
Part of Tornado Diagram for Sensitivity Analysis on anyplot.ai.