The same plot in 14 other libraries — JavaScript: Chart.js, Apache ECharts, Highcharts, MUI X Charts; Python: Altair, Bokeh, lets-plot, Matplotlib, Plotly, plotnine, Pygal, Seaborn; R: ggplot2; Julia: Makie.jl. Compare all 15 side by side: Tornado Diagram for Sensitivity Analysis in Python, R, Julia and JavaScript.
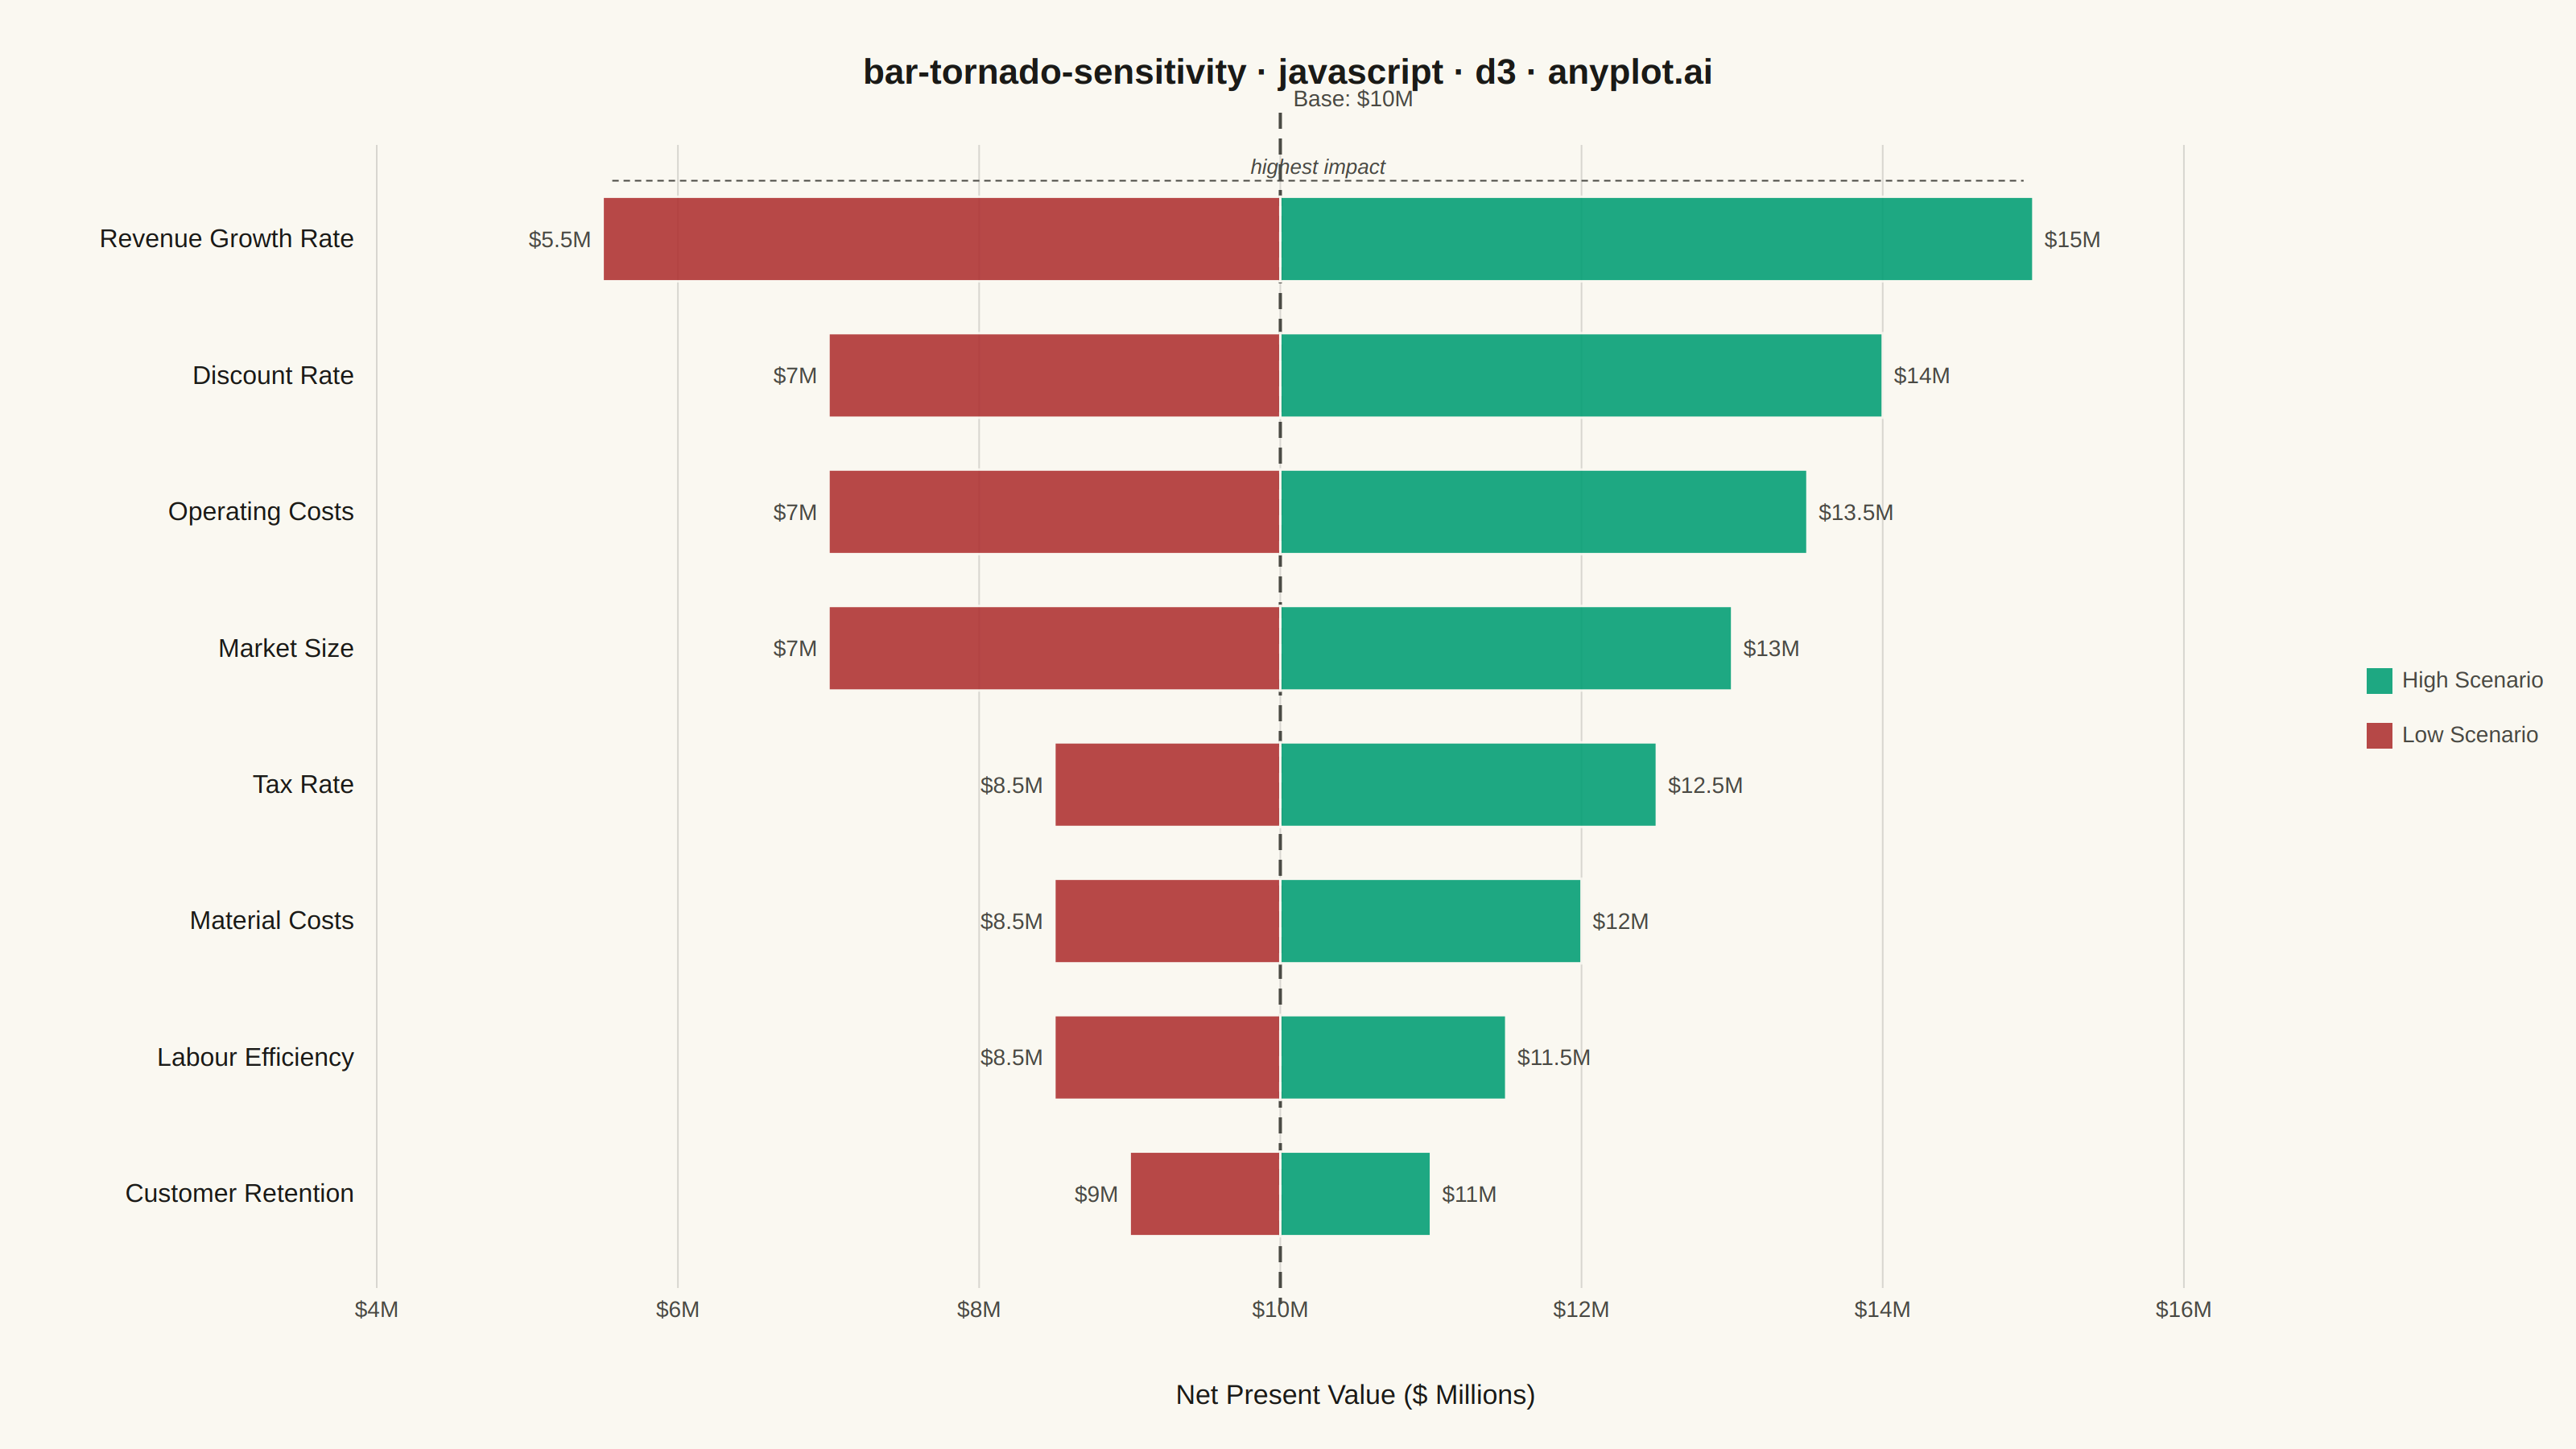
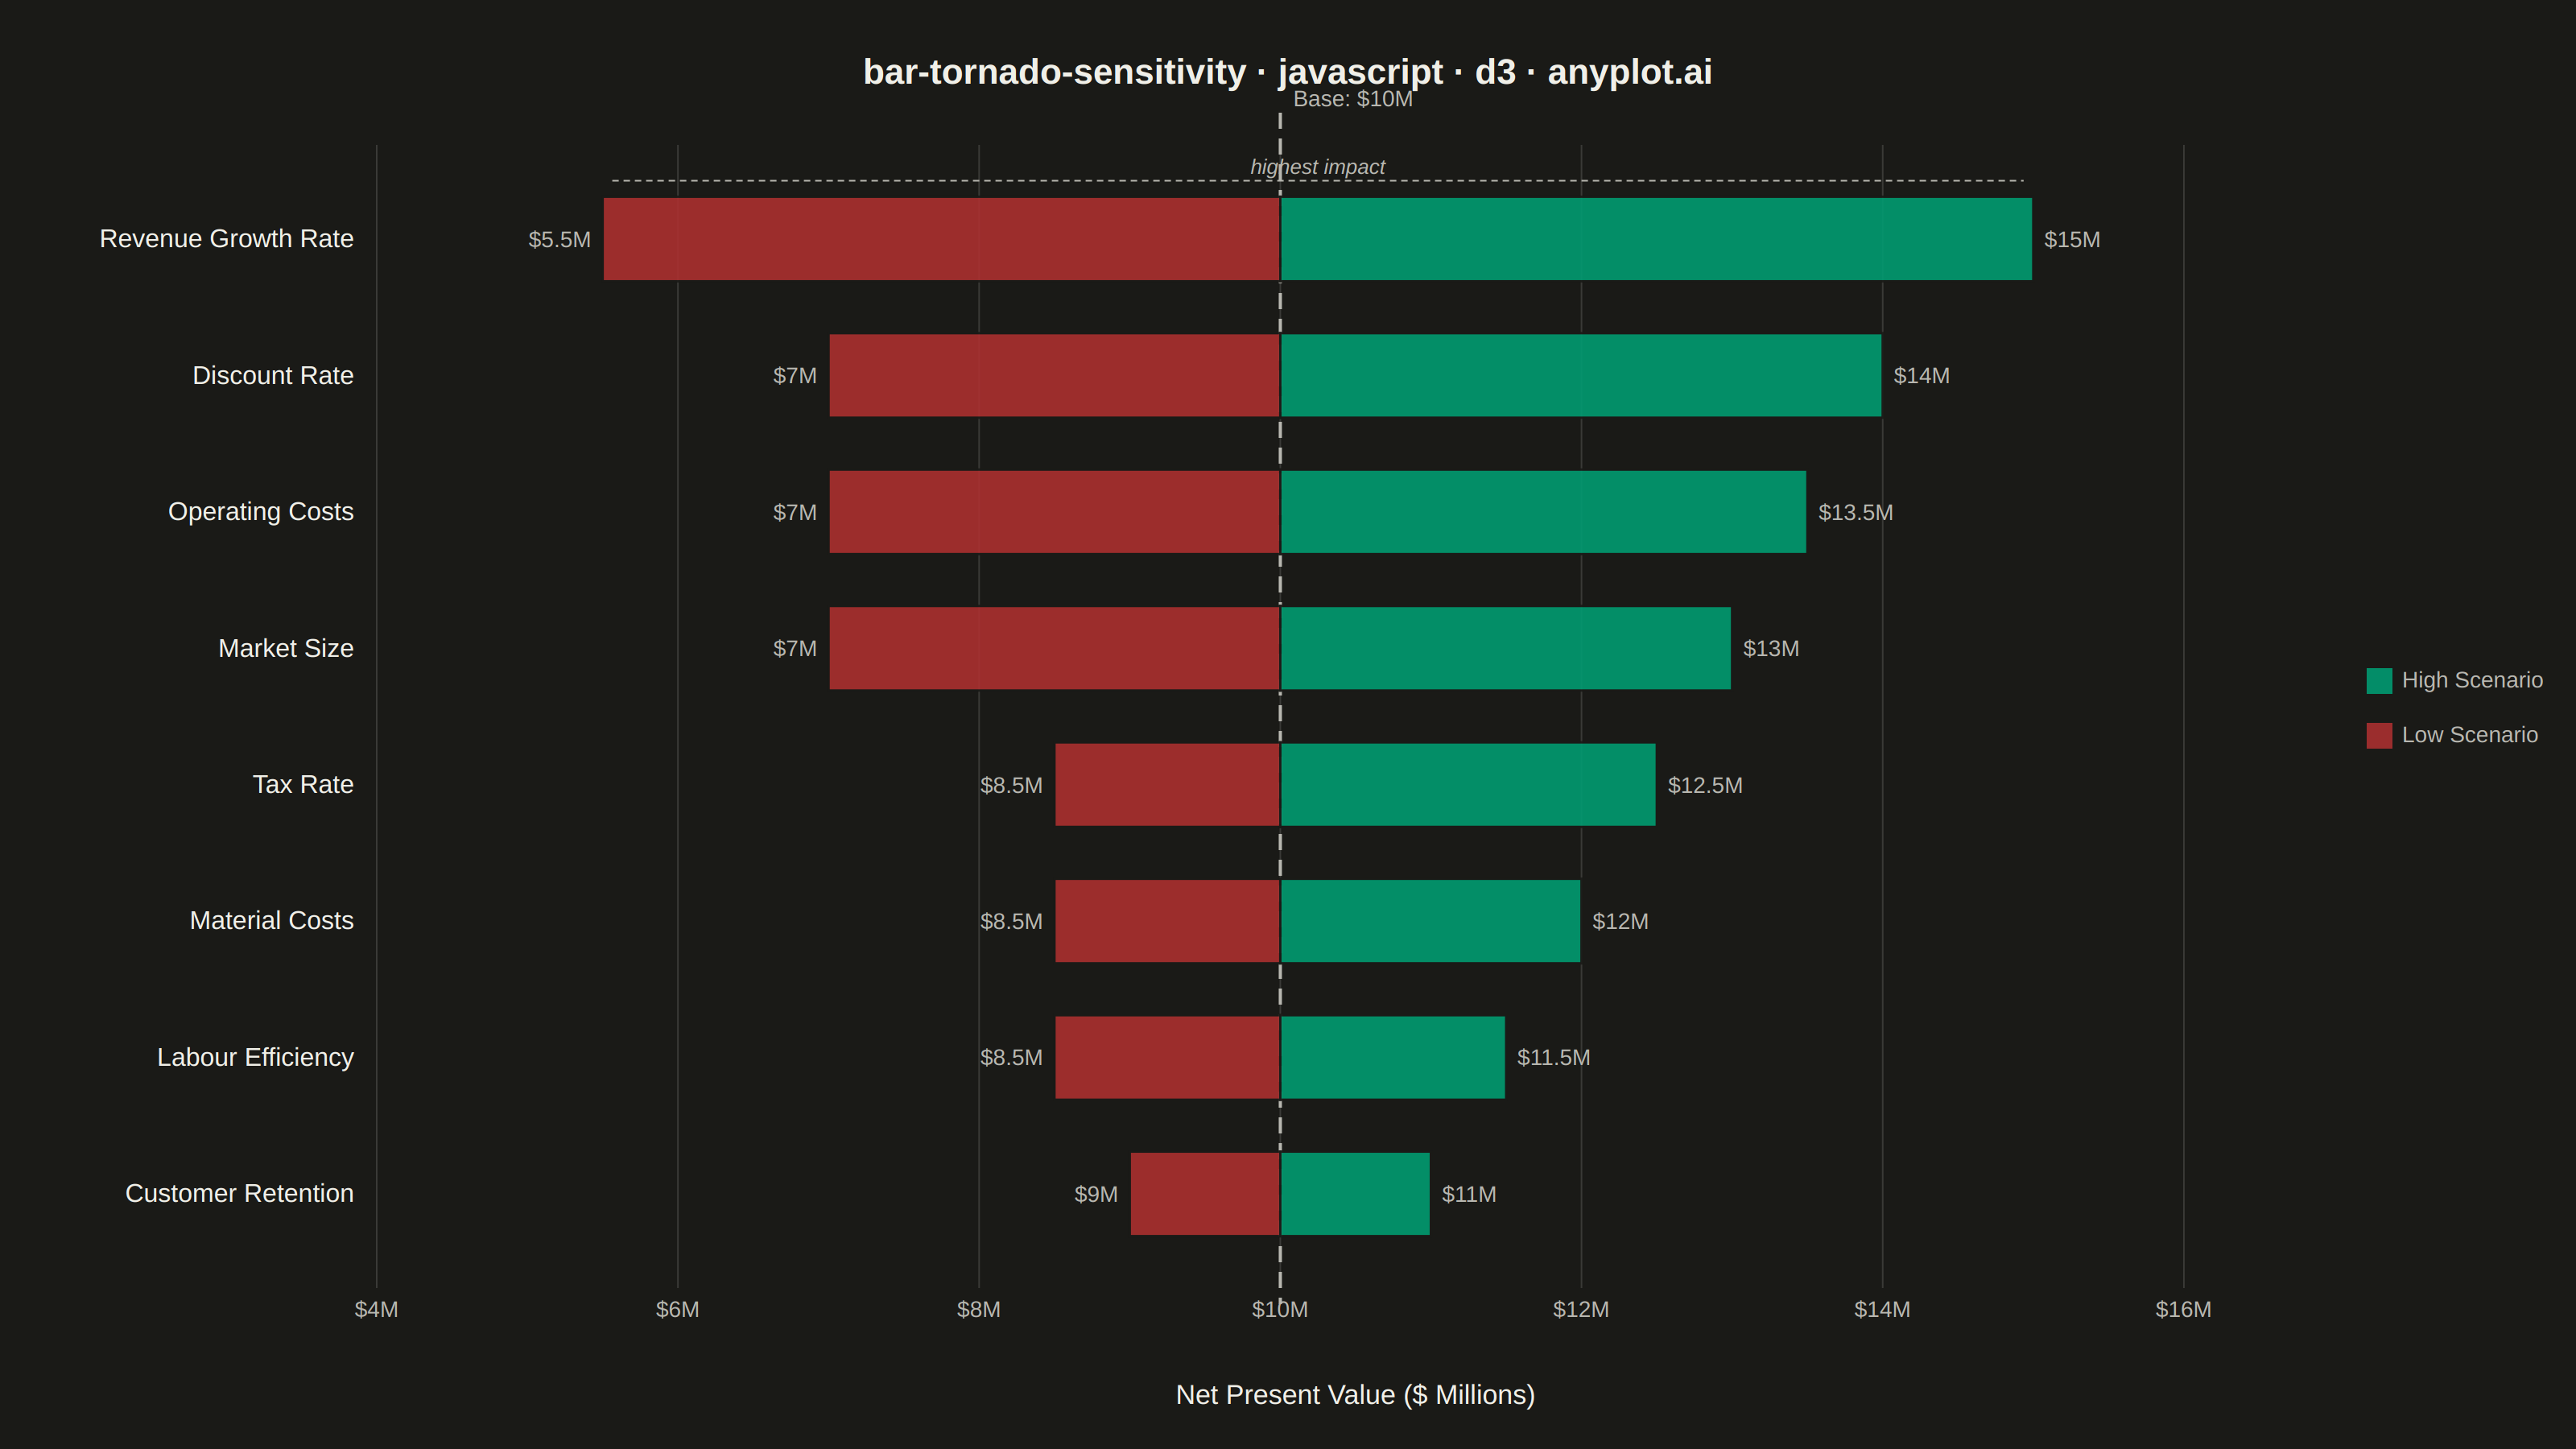
A horizontal bar chart where bars are sorted by influence magnitude, extending left and right from a base case vertical reference line. Each bar represents one input parameter and shows how varying that parameter between its low and high values affects the output, creating a characteristic tornado shape (widest bars at top, narrowest at bottom). Dual colors distinguish low-input from high-input effects, making it immediately clear which parameters drive the most uncertainty.
// anyplot.ai
// bar-tornado-sensitivity: Tornado Diagram for Sensitivity Analysis
// Library: d3 7.9.0 | JavaScript 22.22.3
// Quality: 88/100 | Created: 2026-06-02

const t = window.ANYPLOT_TOKENS;
const { width, height } = window.ANYPLOT_SIZE;

const BASE_NPV = 10.0;

// NPV sensitivity data for a capital project — values in $M
const rawData = [
  { parameter: "Revenue Growth Rate", lowNpv:  5.5, highNpv: 15.0 },
  { parameter: "Discount Rate",       lowNpv:  7.0, highNpv: 14.0 },
  { parameter: "Operating Costs",     lowNpv:  7.0, highNpv: 13.5 },
  { parameter: "Market Size",         lowNpv:  7.0, highNpv: 13.0 },
  { parameter: "Tax Rate",            lowNpv:  8.5, highNpv: 12.5 },
  { parameter: "Material Costs",      lowNpv:  8.5, highNpv: 12.0 },
  { parameter: "Labour Efficiency",   lowNpv:  8.5, highNpv: 11.5 },
  { parameter: "Customer Retention",  lowNpv:  9.0, highNpv: 11.0 },
];

// Sort by range descending — widest bar at top (tornado shape)
const data = rawData.slice().sort(
  (a, b) => (b.highNpv - b.lowNpv) - (a.highNpv - a.lowNpv)
);

const margin = { top: 90, right: 150, bottom: 100, left: 234 };
const iw = width - margin.left - margin.right;
const ih = height - margin.top - margin.bottom;

// SVG mount
const svg = d3.select("#container")
  .append("svg").attr("width", width).attr("height", height);
const g = svg.append("g")
  .attr("transform", `translate(${margin.left},${margin.top})`);

// Scales
const x = d3.scaleLinear().domain([4, 17]).nice().range([0, iw]);
const y = d3.scaleBand()
  .domain(data.map(d => d.parameter))
  .range([0, ih]).padding(0.38);
const bh = y.bandwidth();

// Imprint palette — high scenario = brand green (#009E73), low = semantic red (#AE3030)
const COLOR_HIGH = t.palette[0];
const COLOR_LOW  = t.palette[4];

// Gridlines (vertical, subtle)
x.ticks(7).forEach(v => {
  g.append("line")
    .attr("x1", x(v)).attr("x2", x(v))
    .attr("y1", 0).attr("y2", ih)
    .attr("stroke", t.grid).attr("stroke-width", 1);
});

// Base case reference line (dashed)
const baseX = x(BASE_NPV);
g.append("line")
  .attr("x1", baseX).attr("x2", baseX)
  .attr("y1", -20).attr("y2", ih + 10)
  .attr("stroke", t.inkSoft).attr("stroke-width", 2)
  .attr("stroke-dasharray", "10 6");

// Base case label
g.append("text")
  .attr("x", baseX + 8).attr("y", -24)
  .attr("fill", t.inkSoft).style("font-size", "14px")
  .text(`Base: $${BASE_NPV}M`);

// Bars (one row group per parameter)
const rows = g.selectAll(".row").data(data).join("g")
  .attr("class", "row")
  .attr("transform", d => `translate(0,${y(d.parameter)})`);

// Low-scenario bars — extend left from base
rows.append("rect")
  .attr("x", d => x(d.lowNpv))
  .attr("y", 0)
  .attr("width", d => x(BASE_NPV) - x(d.lowNpv))
  .attr("height", bh)
  .attr("fill", COLOR_LOW)
  .attr("stroke", t.pageBg)
  .attr("stroke-width", 1.5)
  .attr("opacity", 0.88);

// High-scenario bars — extend right from base
rows.append("rect")
  .attr("x", x(BASE_NPV))
  .attr("y", 0)
  .attr("width", d => x(d.highNpv) - x(BASE_NPV))
  .attr("height", bh)
  .attr("fill", COLOR_HIGH)
  .attr("stroke", t.pageBg)
  .attr("stroke-width", 1.5)
  .attr("opacity", 0.88);

// Value labels at bar ends
rows.append("text")
  .attr("x", d => x(d.lowNpv) - 7)
  .attr("y", bh / 2).attr("dy", "0.35em")
  .attr("text-anchor", "end")
  .attr("fill", t.inkSoft).style("font-size", "14px")
  .text(d => `$${d.lowNpv}M`);

rows.append("text")
  .attr("x", d => x(d.highNpv) + 7)
  .attr("y", bh / 2).attr("dy", "0.35em")
  .attr("text-anchor", "start")
  .attr("fill", t.inkSoft).style("font-size", "14px")
  .text(d => `$${d.highNpv}M`);

// Callout: annotate the highest-impact parameter (widest bar at top)
const topParam = data[0];
const topBarTopY = y(topParam.parameter);
const topBarMidX = (x(topParam.lowNpv) + x(topParam.highNpv)) / 2;
g.append("line")
  .attr("x1", x(topParam.lowNpv) + 6).attr("x2", x(topParam.highNpv) - 6)
  .attr("y1", topBarTopY - 10).attr("y2", topBarTopY - 10)
  .attr("stroke", t.inkSoft).attr("stroke-width", 1).attr("stroke-dasharray", "4 3");
g.append("text")
  .attr("x", topBarMidX).attr("y", topBarTopY - 14)
  .attr("text-anchor", "middle")
  .attr("fill", t.inkSoft).style("font-size", "13px").style("font-style", "italic")
  .text("highest impact");

// Y-axis (parameter names)
const yAxis = g.append("g").call(d3.axisLeft(y).tickSize(0).tickPadding(14));
yAxis.selectAll("text").attr("fill", t.ink).style("font-size", "16px");
yAxis.select(".domain").attr("stroke", "none");

// X-axis
const xAxis = g.append("g")
  .attr("transform", `translate(0,${ih})`)
  .call(d3.axisBottom(x).ticks(7).tickSize(0).tickPadding(8).tickFormat(d => `$${d}M`));
xAxis.selectAll("text").attr("fill", t.inkSoft).style("font-size", "14px");
xAxis.select(".domain").attr("stroke", "none");

// X-axis label
g.append("text")
  .attr("x", iw / 2).attr("y", ih + 72)
  .attr("text-anchor", "middle")
  .attr("fill", t.ink).style("font-size", "17px")
  .text("Net Present Value ($ Millions)");

// Legend — in right margin, vertically centered near top of chart
const lgX = iw + 20;
const lgY = Math.round(ih / 2) - 30;
[{ label: "High Scenario", color: COLOR_HIGH },
 { label: "Low Scenario",  color: COLOR_LOW  }].forEach((item, i) => {
  g.append("rect")
    .attr("x", lgX).attr("y", lgY + i * 34)
    .attr("width", 16).attr("height", 16)
    .attr("fill", item.color).attr("opacity", 0.88);
  g.append("text")
    .attr("x", lgX + 22).attr("y", lgY + i * 34 + 12)
    .attr("fill", t.inkSoft).style("font-size", "14px")
    .text(item.label);
});

// Chart title
svg.append("text")
  .attr("x", width / 2).attr("y", 52)
  .attr("text-anchor", "middle")
  .attr("fill", t.ink).style("font-size", "22px").style("font-weight", "600")
  .text("bar-tornado-sensitivity · javascript · d3 · anyplot.ai");
Runnable source as JSON, for any HTTP client: https://api.anyplot.ai/specs/bar-tornado-sensitivity/d3/code. Any spec id and library id listed in llms-full.txt fit the same URL shape; every URL below is complete and callable.
{
  "spec_id": "bar-tornado-sensitivity",
  "language": "javascript",
  "library": "d3",
  "page": "https://anyplot.ai/bar-tornado-sensitivity/javascript/d3",
  "hub": "https://anyplot.ai/bar-tornado-sensitivity",
  "code_json": "https://api.anyplot.ai/specs/bar-tornado-sensitivity/d3/code",
  "spec_json": "https://api.anyplot.ai/specs/bar-tornado-sensitivity",
  "render_light_png": "https://storage.googleapis.com/anyplot-images/plots/bar-tornado-sensitivity/javascript/d3/plot-light.png",
  "render_dark_png": "https://storage.googleapis.com/anyplot-images/plots/bar-tornado-sensitivity/javascript/d3/plot-dark.png",
  "interactive_light_html": "https://storage.googleapis.com/anyplot-images/plots/bar-tornado-sensitivity/javascript/d3/plot-light.html",
  "interactive_dark_html": "https://storage.googleapis.com/anyplot-images/plots/bar-tornado-sensitivity/javascript/d3/plot-dark.html",
  "quality_score": 88.0,
  "license": "MIT",
  "guide": "https://anyplot.ai/llms.txt"
}
Part of Tornado Diagram for Sensitivity Analysis on anyplot.ai.