The same plot in 14 other libraries — JavaScript: Chart.js, D3.js, Highcharts, MUI X Charts; Python: Altair, Bokeh, lets-plot, Matplotlib, Plotly, plotnine, Pygal, Seaborn; R: ggplot2; Julia: Makie.jl. Compare all 15 side by side: Tornado Diagram for Sensitivity Analysis in Python, R, Julia and JavaScript.
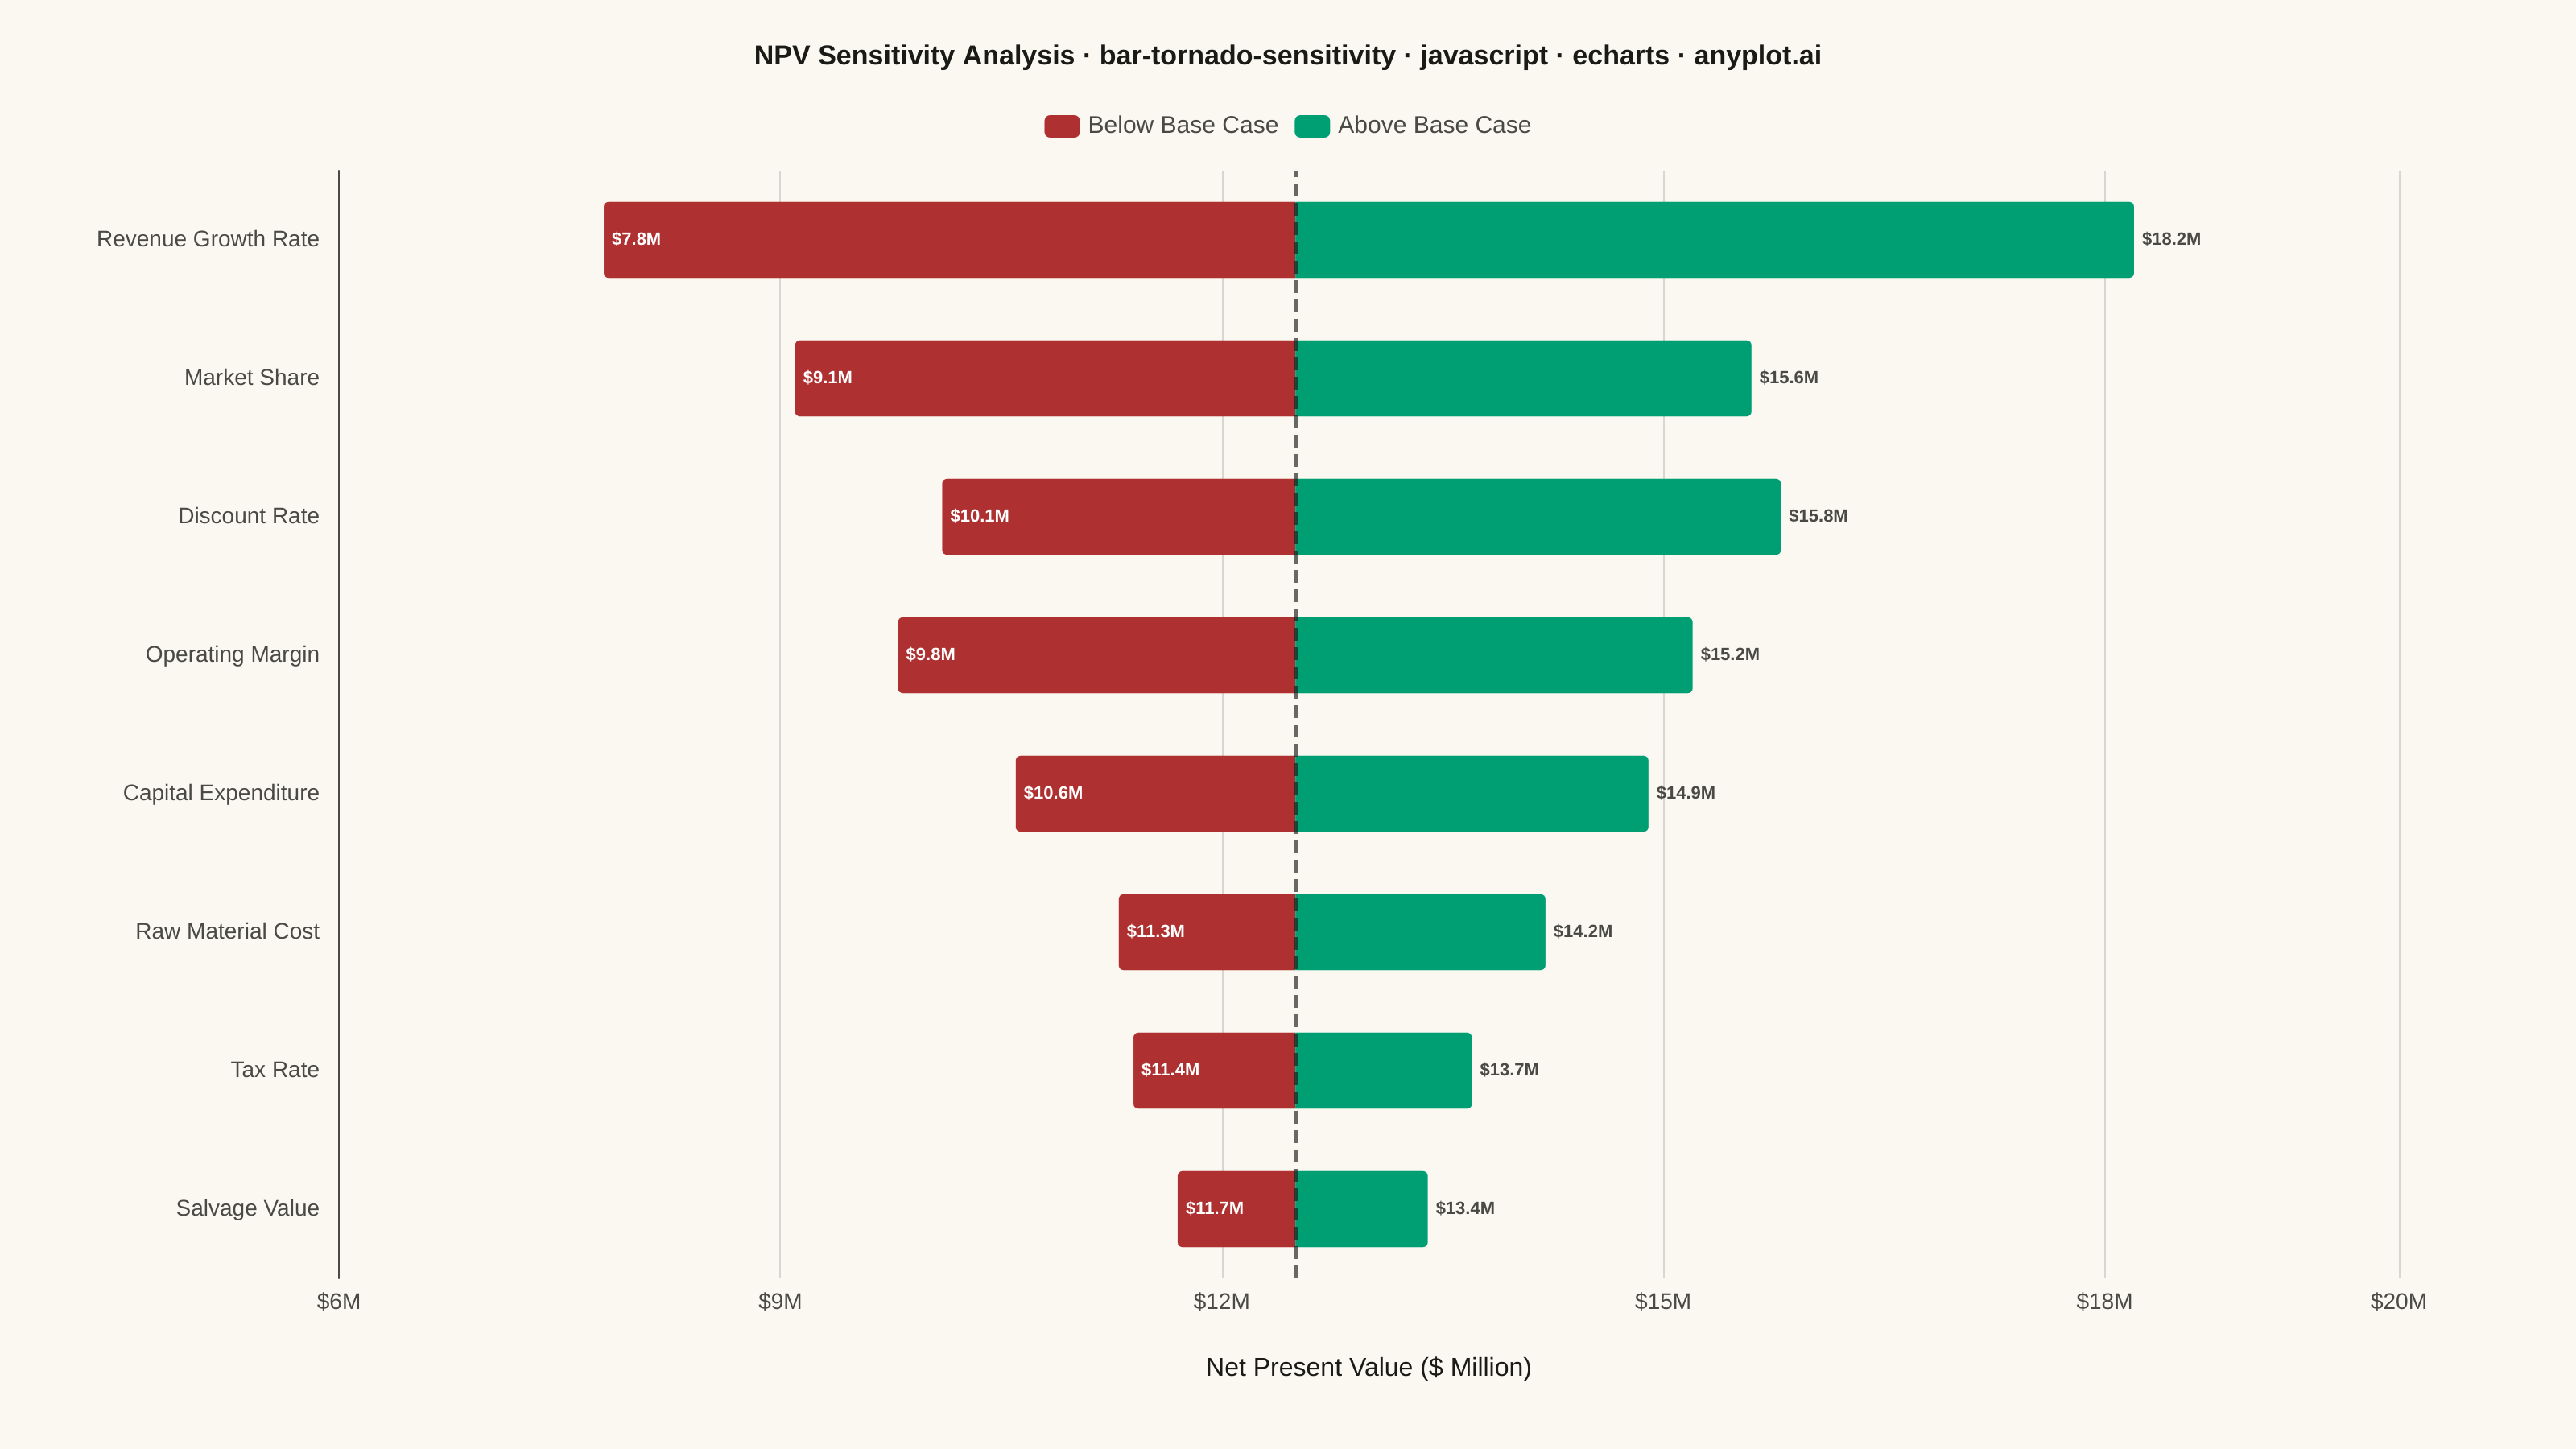
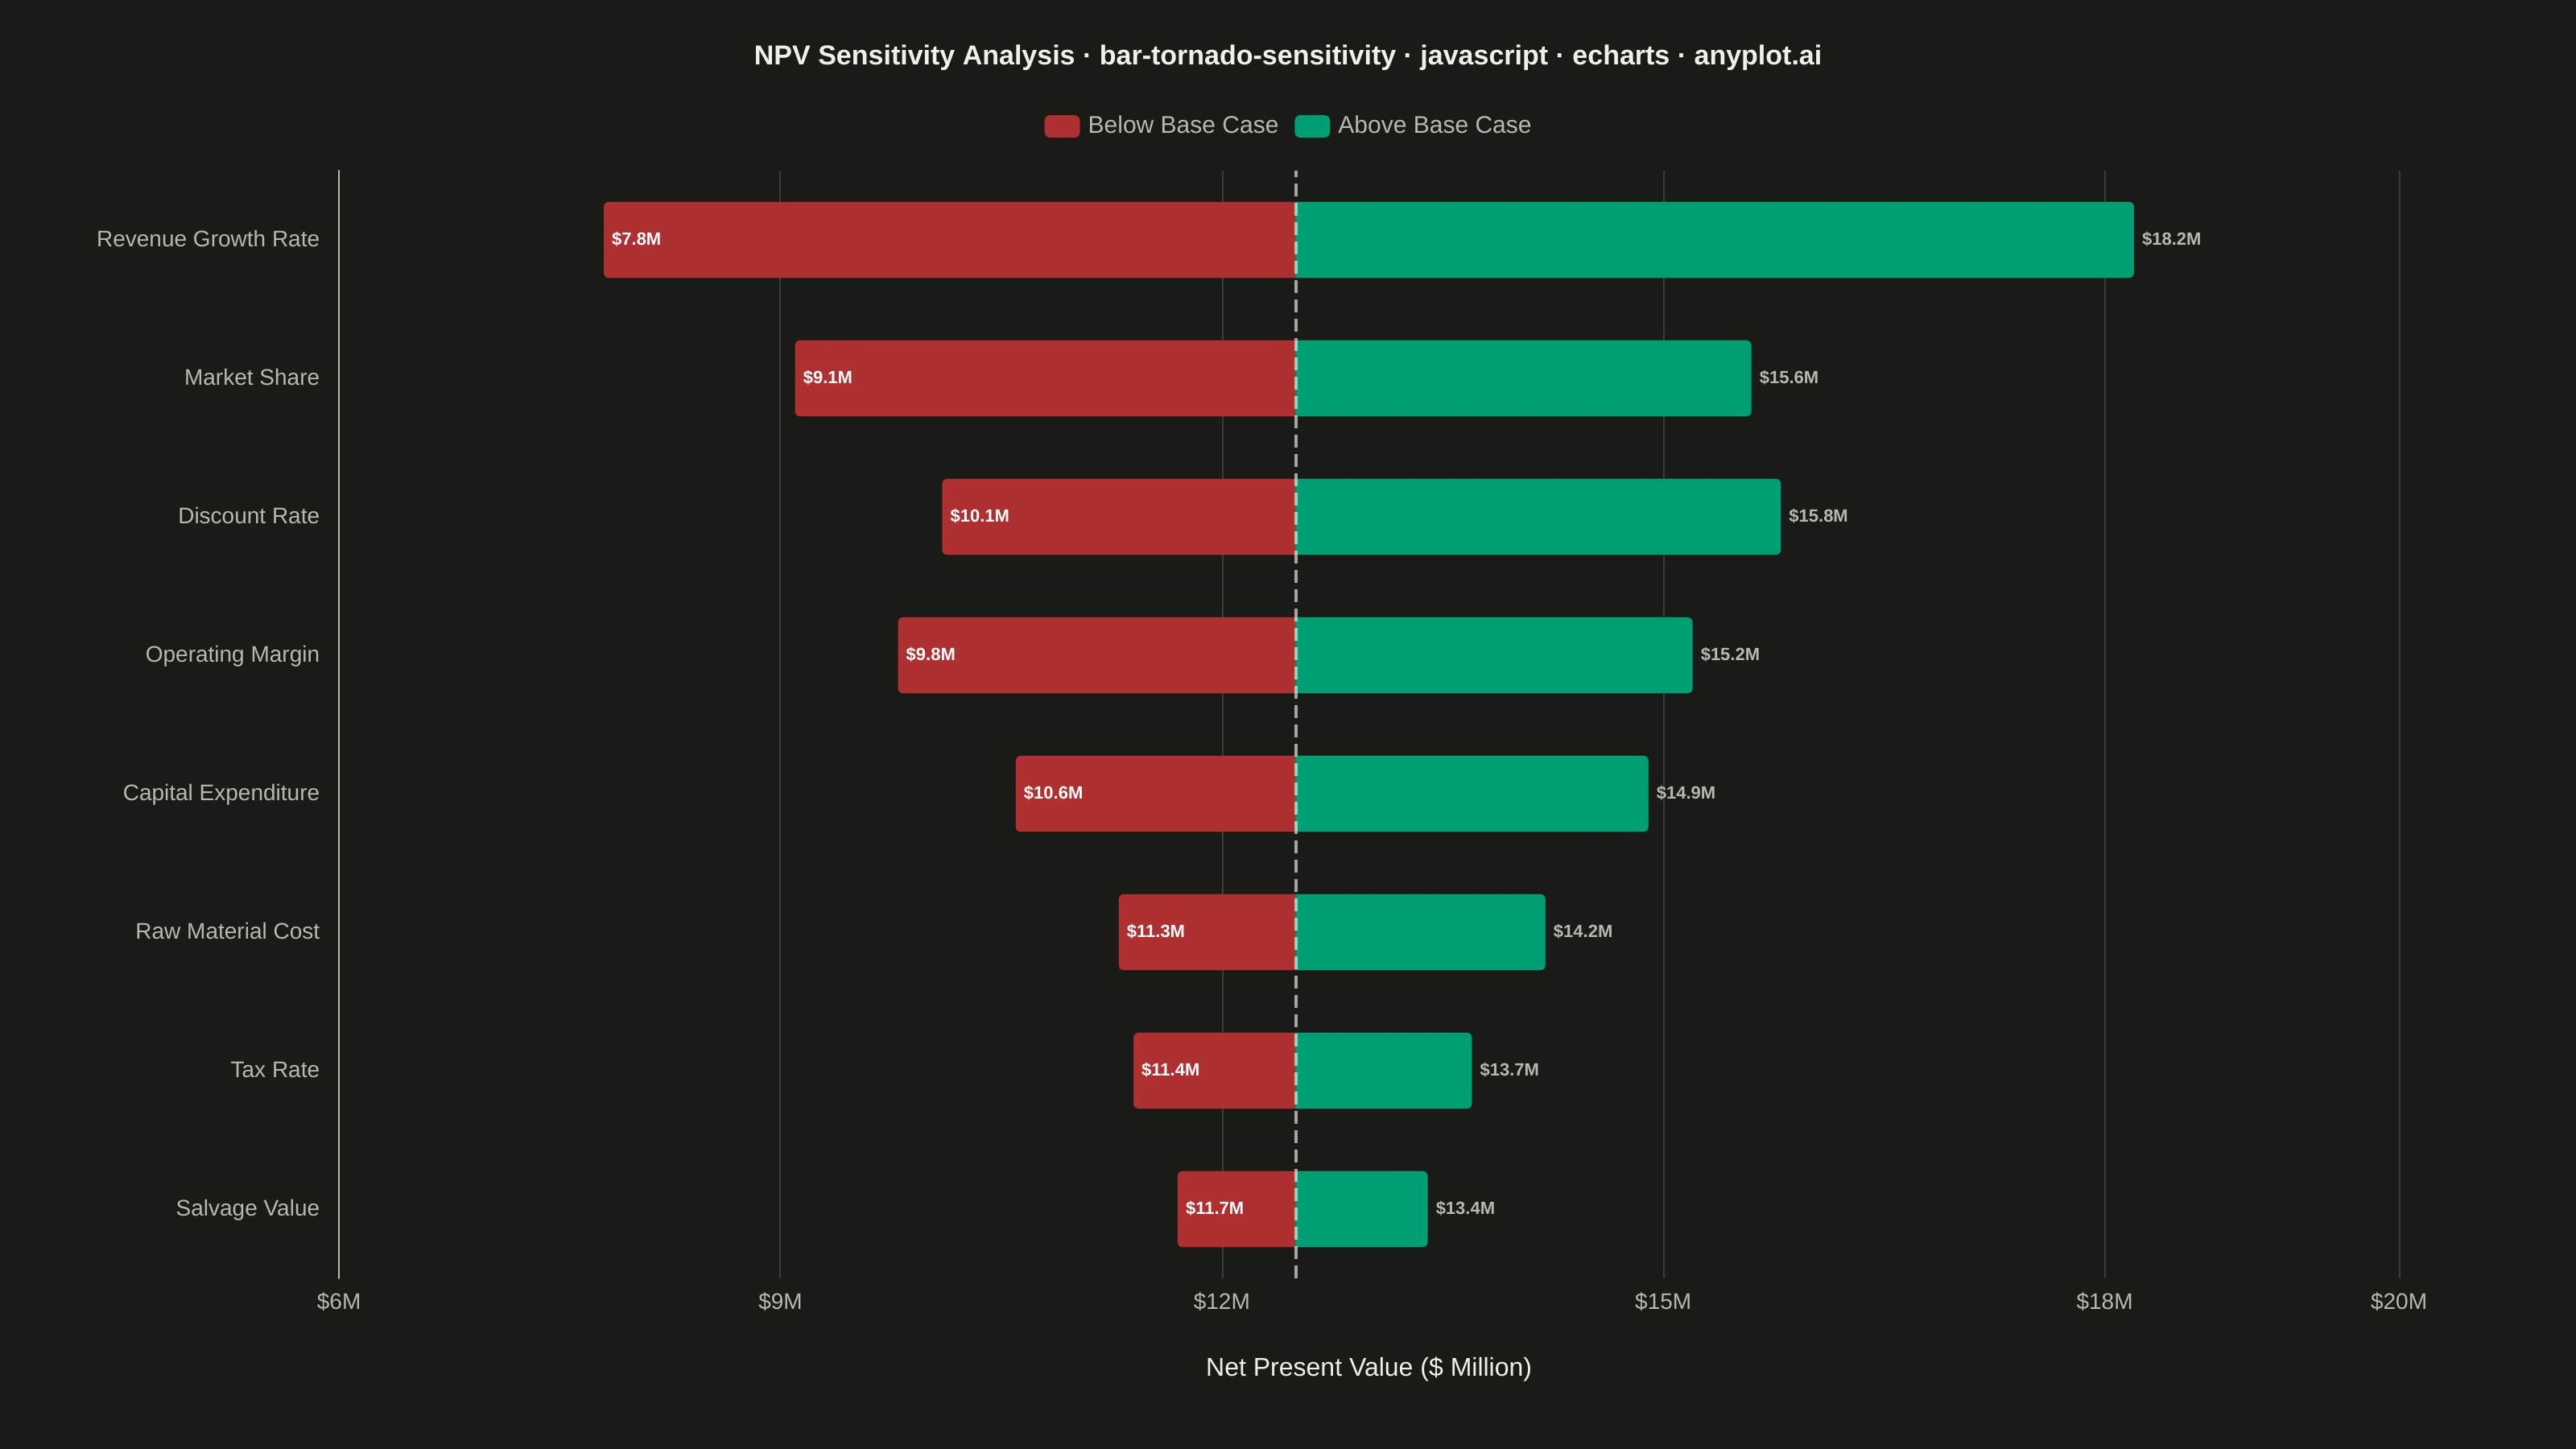
A horizontal bar chart where bars are sorted by influence magnitude, extending left and right from a base case vertical reference line. Each bar represents one input parameter and shows how varying that parameter between its low and high values affects the output, creating a characteristic tornado shape (widest bars at top, narrowest at bottom). Dual colors distinguish low-input from high-input effects, making it immediately clear which parameters drive the most uncertainty.
// anyplot.ai
// bar-tornado-sensitivity: Tornado Diagram for Sensitivity Analysis
// Library: echarts 5.5.1 | JavaScript 22.22.3
// Quality: 90/100 | Created: 2026-06-02

//# anyplot-orientation: landscape

const t = window.ANYPLOT_TOKENS;

// NPV sensitivity analysis for a manufacturing plant investment ($M)
// Base case NPV = $12.5M; 8 parameters varied one at a time (one-way sensitivity)
// Sorted ascending by output range so ECharts default category order puts widest bar at top
const baseNPV = 12.5;
const xMin    = 6.0;

const params = [
  { name: "Salvage Value",        minOut: 11.7, maxOut: 13.4 },
  { name: "Tax Rate",             minOut: 11.4, maxOut: 13.7 },
  { name: "Raw Material Cost",    minOut: 11.3, maxOut: 14.2 },
  { name: "Capital Expenditure",  minOut: 10.6, maxOut: 14.9 },
  { name: "Operating Margin",     minOut:  9.8, maxOut: 15.2 },
  { name: "Discount Rate",        minOut: 10.1, maxOut: 15.8 },
  { name: "Market Share",         minOut:  9.1, maxOut: 15.6 },
  { name: "Revenue Growth Rate",  minOut:  7.8, maxOut: 18.2 },
];

const names = params.map(function (p) { return p.name; });

// Stacked bar technique: transparent offset positions bars at minOut;
// left wing spans minOut → base (downside); right wing spans base → maxOut (upside)
const offsetData = params.map(function (p) { return +p.minOut.toFixed(3); });
const leftData   = params.map(function (p) { return +(baseNPV - p.minOut).toFixed(3); });
const rightData  = params.map(function (p) { return +(p.maxOut - baseNPV).toFixed(3); });

const minByName = {};
const maxByName = {};
params.forEach(function (p) { minByName[p.name] = p.minOut; maxByName[p.name] = p.maxOut; });

const chart = echarts.init(document.getElementById("container"));

// Title font size scaled to title length (baseline 67 chars at 22px)
const titleText     = "NPV Sensitivity Analysis · bar-tornado-sensitivity · javascript · echarts · anyplot.ai";
const titleFontSize = Math.max(16, Math.round(22 * 67 / titleText.length));

chart.setOption({
  animation: false,
  color: t.palette,
  backgroundColor: "transparent",

  title: {
    text: titleText,
    left: "center",
    top: 22,
    textStyle: { color: t.ink, fontSize: titleFontSize, fontWeight: "bold" },
  },

  legend: {
    data: ["Below Base Case", "Above Base Case"],
    top: 66,
    textStyle: { color: t.inkSoft, fontSize: 15 },
    itemWidth: 22,
    itemHeight: 14,
  },

  tooltip: {
    trigger: "axis",
    axisPointer: { type: "shadow" },
    backgroundColor: t.elevatedBg,
    borderColor: t.grid,
    textStyle: { color: t.ink, fontSize: 13 },
    formatter: function (seriesParams) {
      var name = seriesParams[0].name;
      var lo   = minByName[name];
      var hi   = maxByName[name];
      return [
        "<b>" + name + "</b>",
        "Downside: <b>$" + lo.toFixed(1) + "M</b>",
        "Base case: <b>$" + baseNPV.toFixed(1) + "M</b>",
        "Upside: <b>$" + hi.toFixed(1) + "M</b>",
        "Range: <b>$" + (hi - lo).toFixed(1) + "M</b>",
      ].join("<br/>");
    },
  },

  grid: { containLabel: true, left: 60, right: 110, top: 106, bottom: 84 },

  xAxis: {
    type: "value",
    min: xMin,
    max: 20,
    name: "Net Present Value ($ Million)",
    nameLocation: "middle",
    nameGap: 48,
    nameTextStyle: { color: t.ink, fontSize: 16 },
    axisLabel: {
      color: t.inkSoft,
      fontSize: 14,
      formatter: function (v) { return "$" + v + "M"; },
    },
    axisLine: { lineStyle: { color: t.inkSoft } },
    splitLine: { lineStyle: { color: t.grid } },
    axisTick: { show: false },
  },

  yAxis: {
    type: "category",
    data: names,
    axisLabel: { color: t.inkSoft, fontSize: 14, margin: 12 },
    axisLine: { lineStyle: { color: t.inkSoft } },
    splitLine: { show: false },
    axisTick: { show: false },
  },

  series: [
    // Transparent offset — shifts each bar rightward to its true start (minOut)
    {
      name: "_offset",
      type: "bar",
      stack: "tornado",
      barWidth: "55%",
      data: offsetData,
      itemStyle: { color: "transparent" },
      emphasis: { disabled: true },
      silent: true,
    },

    // Left wing: output is below base case (downside scenarios)
    // Uses Imprint matte red — semantic anchor for loss/adverse
    {
      name: "Below Base Case",
      type: "bar",
      stack: "tornado",
      data: leftData,
      itemStyle: { color: t.palette[4], borderRadius: [3, 0, 0, 3] },
      label: {
        show: true,
        position: "insideLeft",
        color: "#ffffff",
        fontSize: 11,
        fontWeight: "bold",
        formatter: function (p) { return "$" + minByName[p.name].toFixed(1) + "M"; },
        overflow: "truncate",
      },
      markLine: {
        silent: true,
        symbol: "none",
        lineStyle: { color: t.ink, width: 2, type: "dashed", opacity: 0.65 },
        label: { show: false },
        data: [{ xAxis: baseNPV }],
      },
    },

    // Right wing: output is above base case (upside scenarios)
    // Uses Imprint brand green — first categorical series, always #009E73
    {
      name: "Above Base Case",
      type: "bar",
      stack: "tornado",
      data: rightData,
      itemStyle: { color: t.palette[0], borderRadius: [0, 3, 3, 0] },
      label: {
        show: true,
        position: "right",
        color: t.inkSoft,
        fontSize: 11,
        fontWeight: "bold",
        formatter: function (p) { return "$" + maxByName[p.name].toFixed(1) + "M"; },
      },
    },
  ],
});
Runnable source as JSON, for any HTTP client: https://api.anyplot.ai/specs/bar-tornado-sensitivity/echarts/code. Any spec id and library id listed in llms-full.txt fit the same URL shape; every URL below is complete and callable.
{
  "spec_id": "bar-tornado-sensitivity",
  "language": "javascript",
  "library": "echarts",
  "page": "https://anyplot.ai/bar-tornado-sensitivity/javascript/echarts",
  "hub": "https://anyplot.ai/bar-tornado-sensitivity",
  "code_json": "https://api.anyplot.ai/specs/bar-tornado-sensitivity/echarts/code",
  "spec_json": "https://api.anyplot.ai/specs/bar-tornado-sensitivity",
  "render_light_png": "https://storage.googleapis.com/anyplot-images/plots/bar-tornado-sensitivity/javascript/echarts/plot-light.png",
  "render_dark_png": "https://storage.googleapis.com/anyplot-images/plots/bar-tornado-sensitivity/javascript/echarts/plot-dark.png",
  "interactive_light_html": "https://storage.googleapis.com/anyplot-images/plots/bar-tornado-sensitivity/javascript/echarts/plot-light.html",
  "interactive_dark_html": "https://storage.googleapis.com/anyplot-images/plots/bar-tornado-sensitivity/javascript/echarts/plot-dark.html",
  "quality_score": 90.0,
  "license": "MIT",
  "guide": "https://anyplot.ai/llms.txt"
}
Part of Tornado Diagram for Sensitivity Analysis on anyplot.ai.