The same plot in 14 other libraries — Python: Altair, Bokeh, lets-plot, Matplotlib, Plotly, plotnine, Pygal, Seaborn; R: ggplot2; JavaScript: Chart.js, D3.js, Apache ECharts, Highcharts, MUI X Charts. Compare all 15 side by side: Tornado Diagram for Sensitivity Analysis in Python, R, Julia and JavaScript.
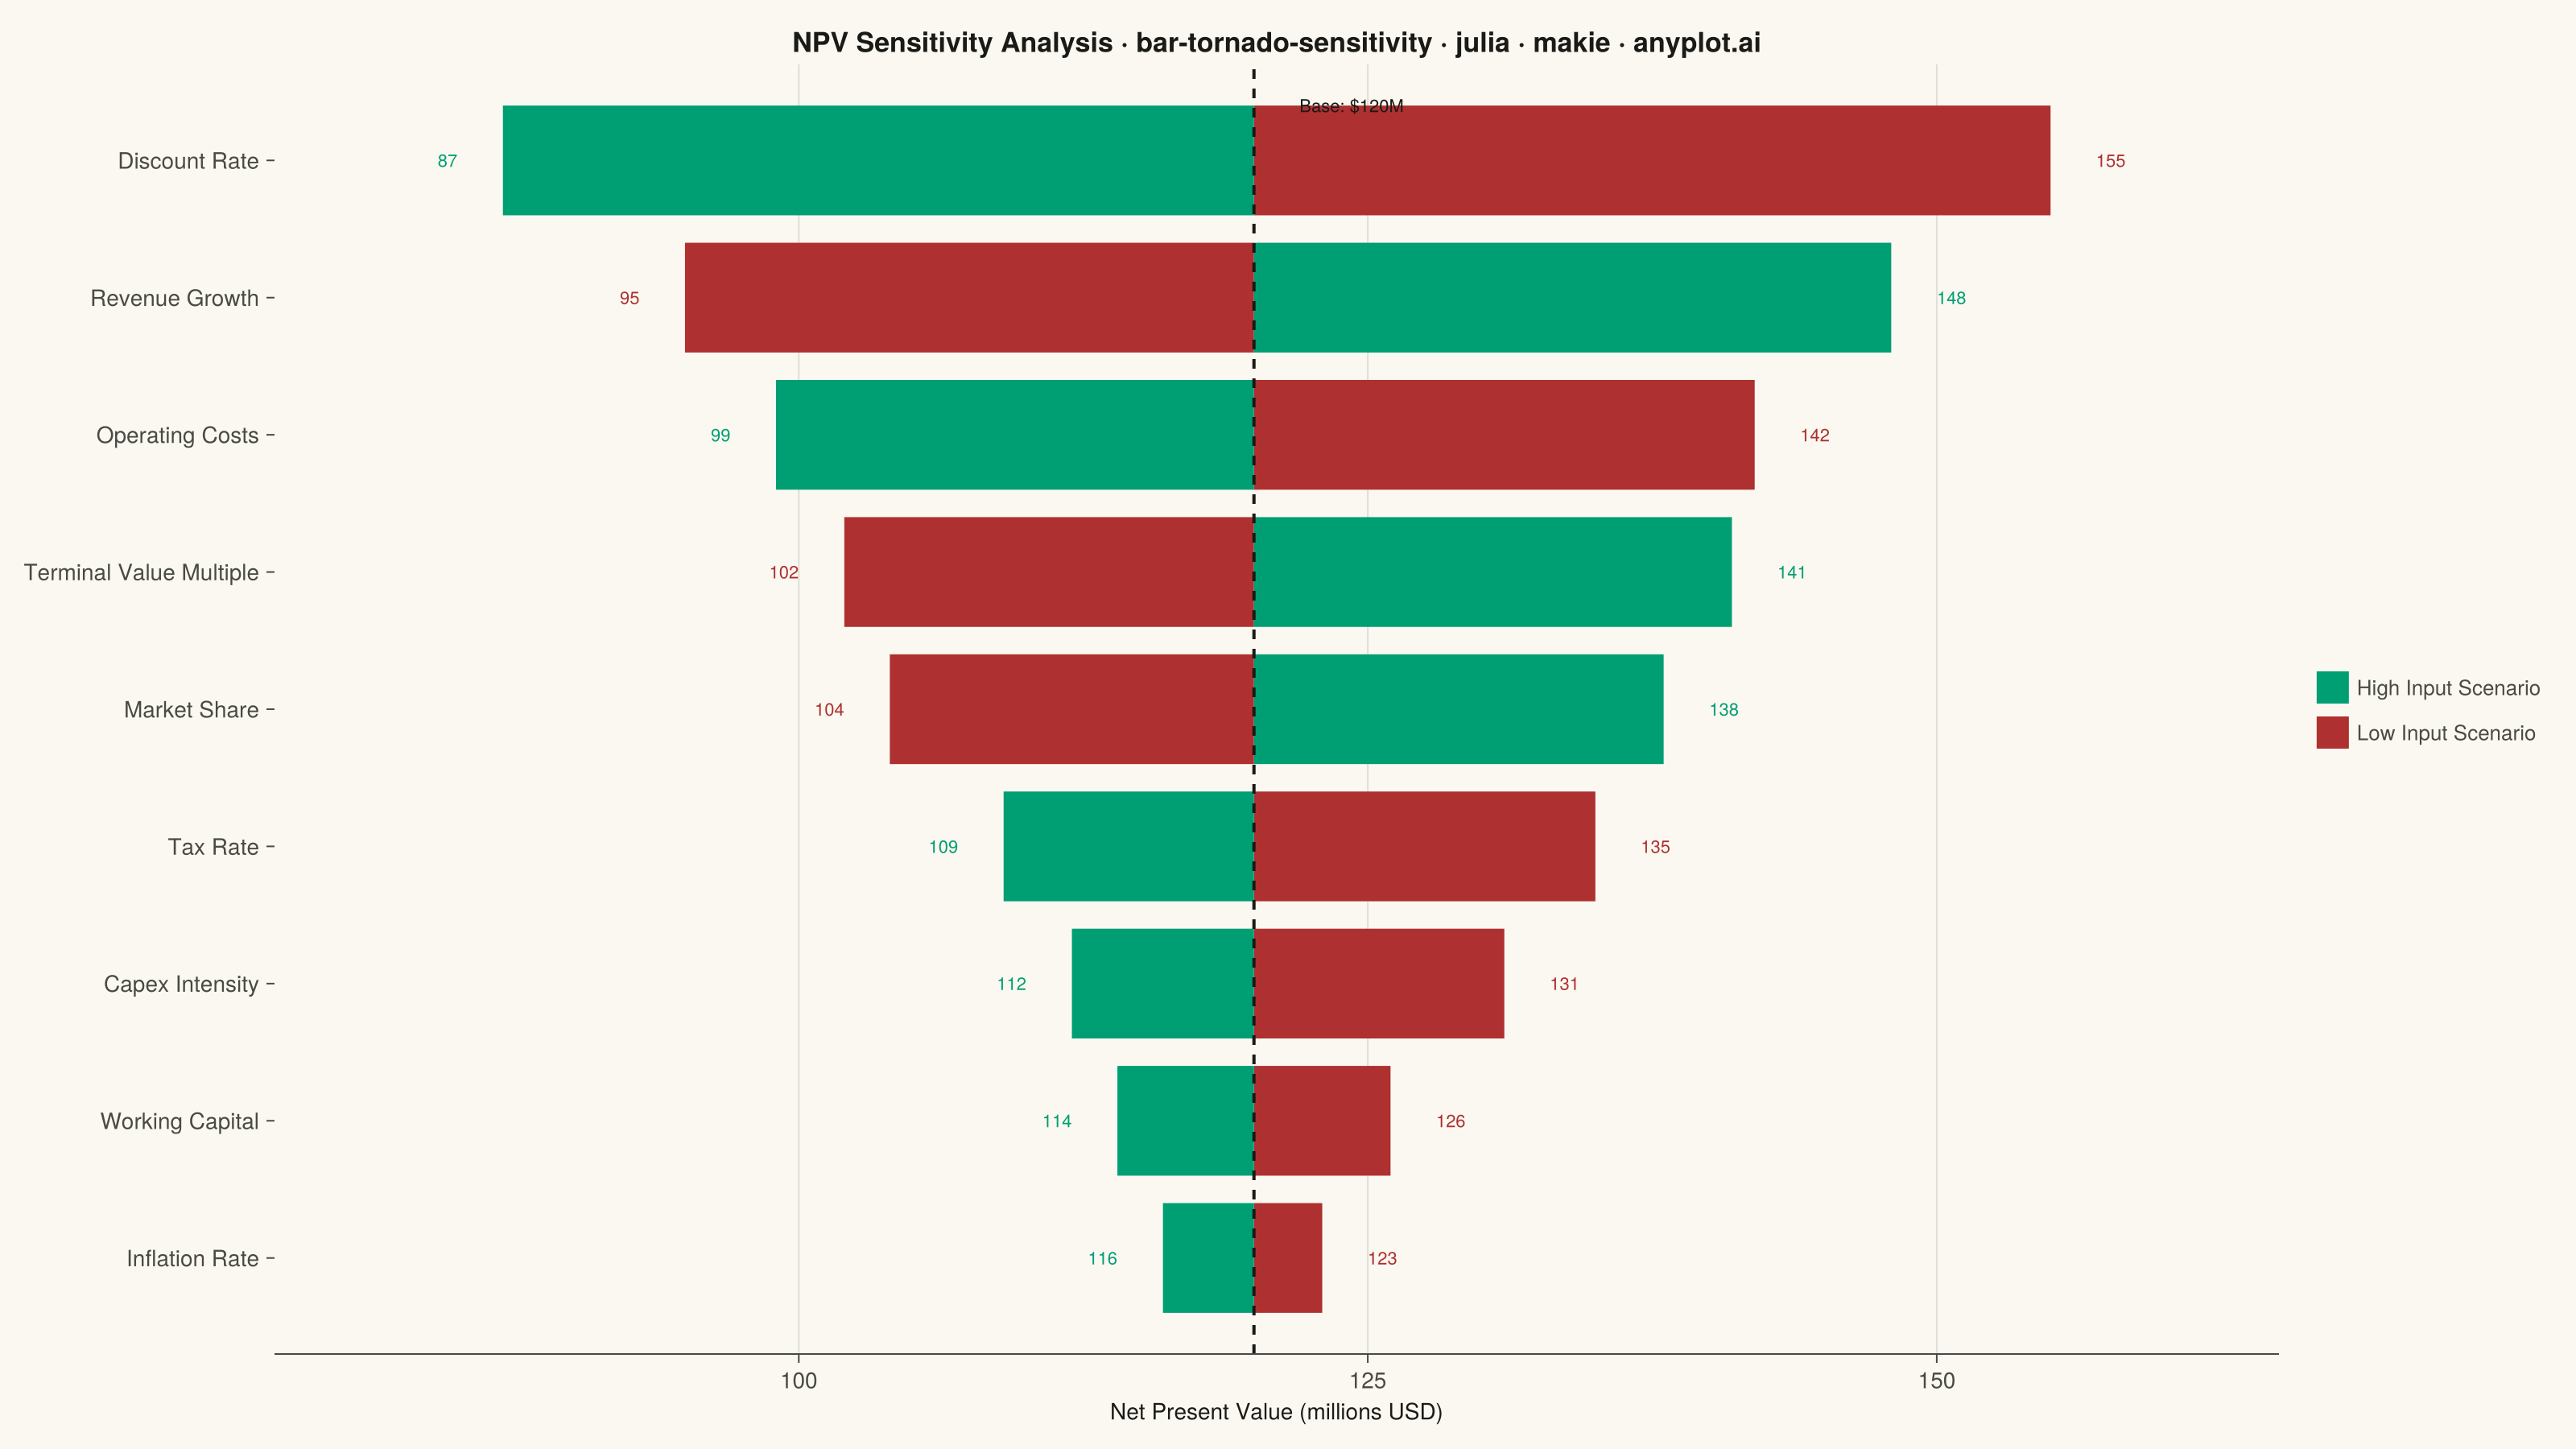
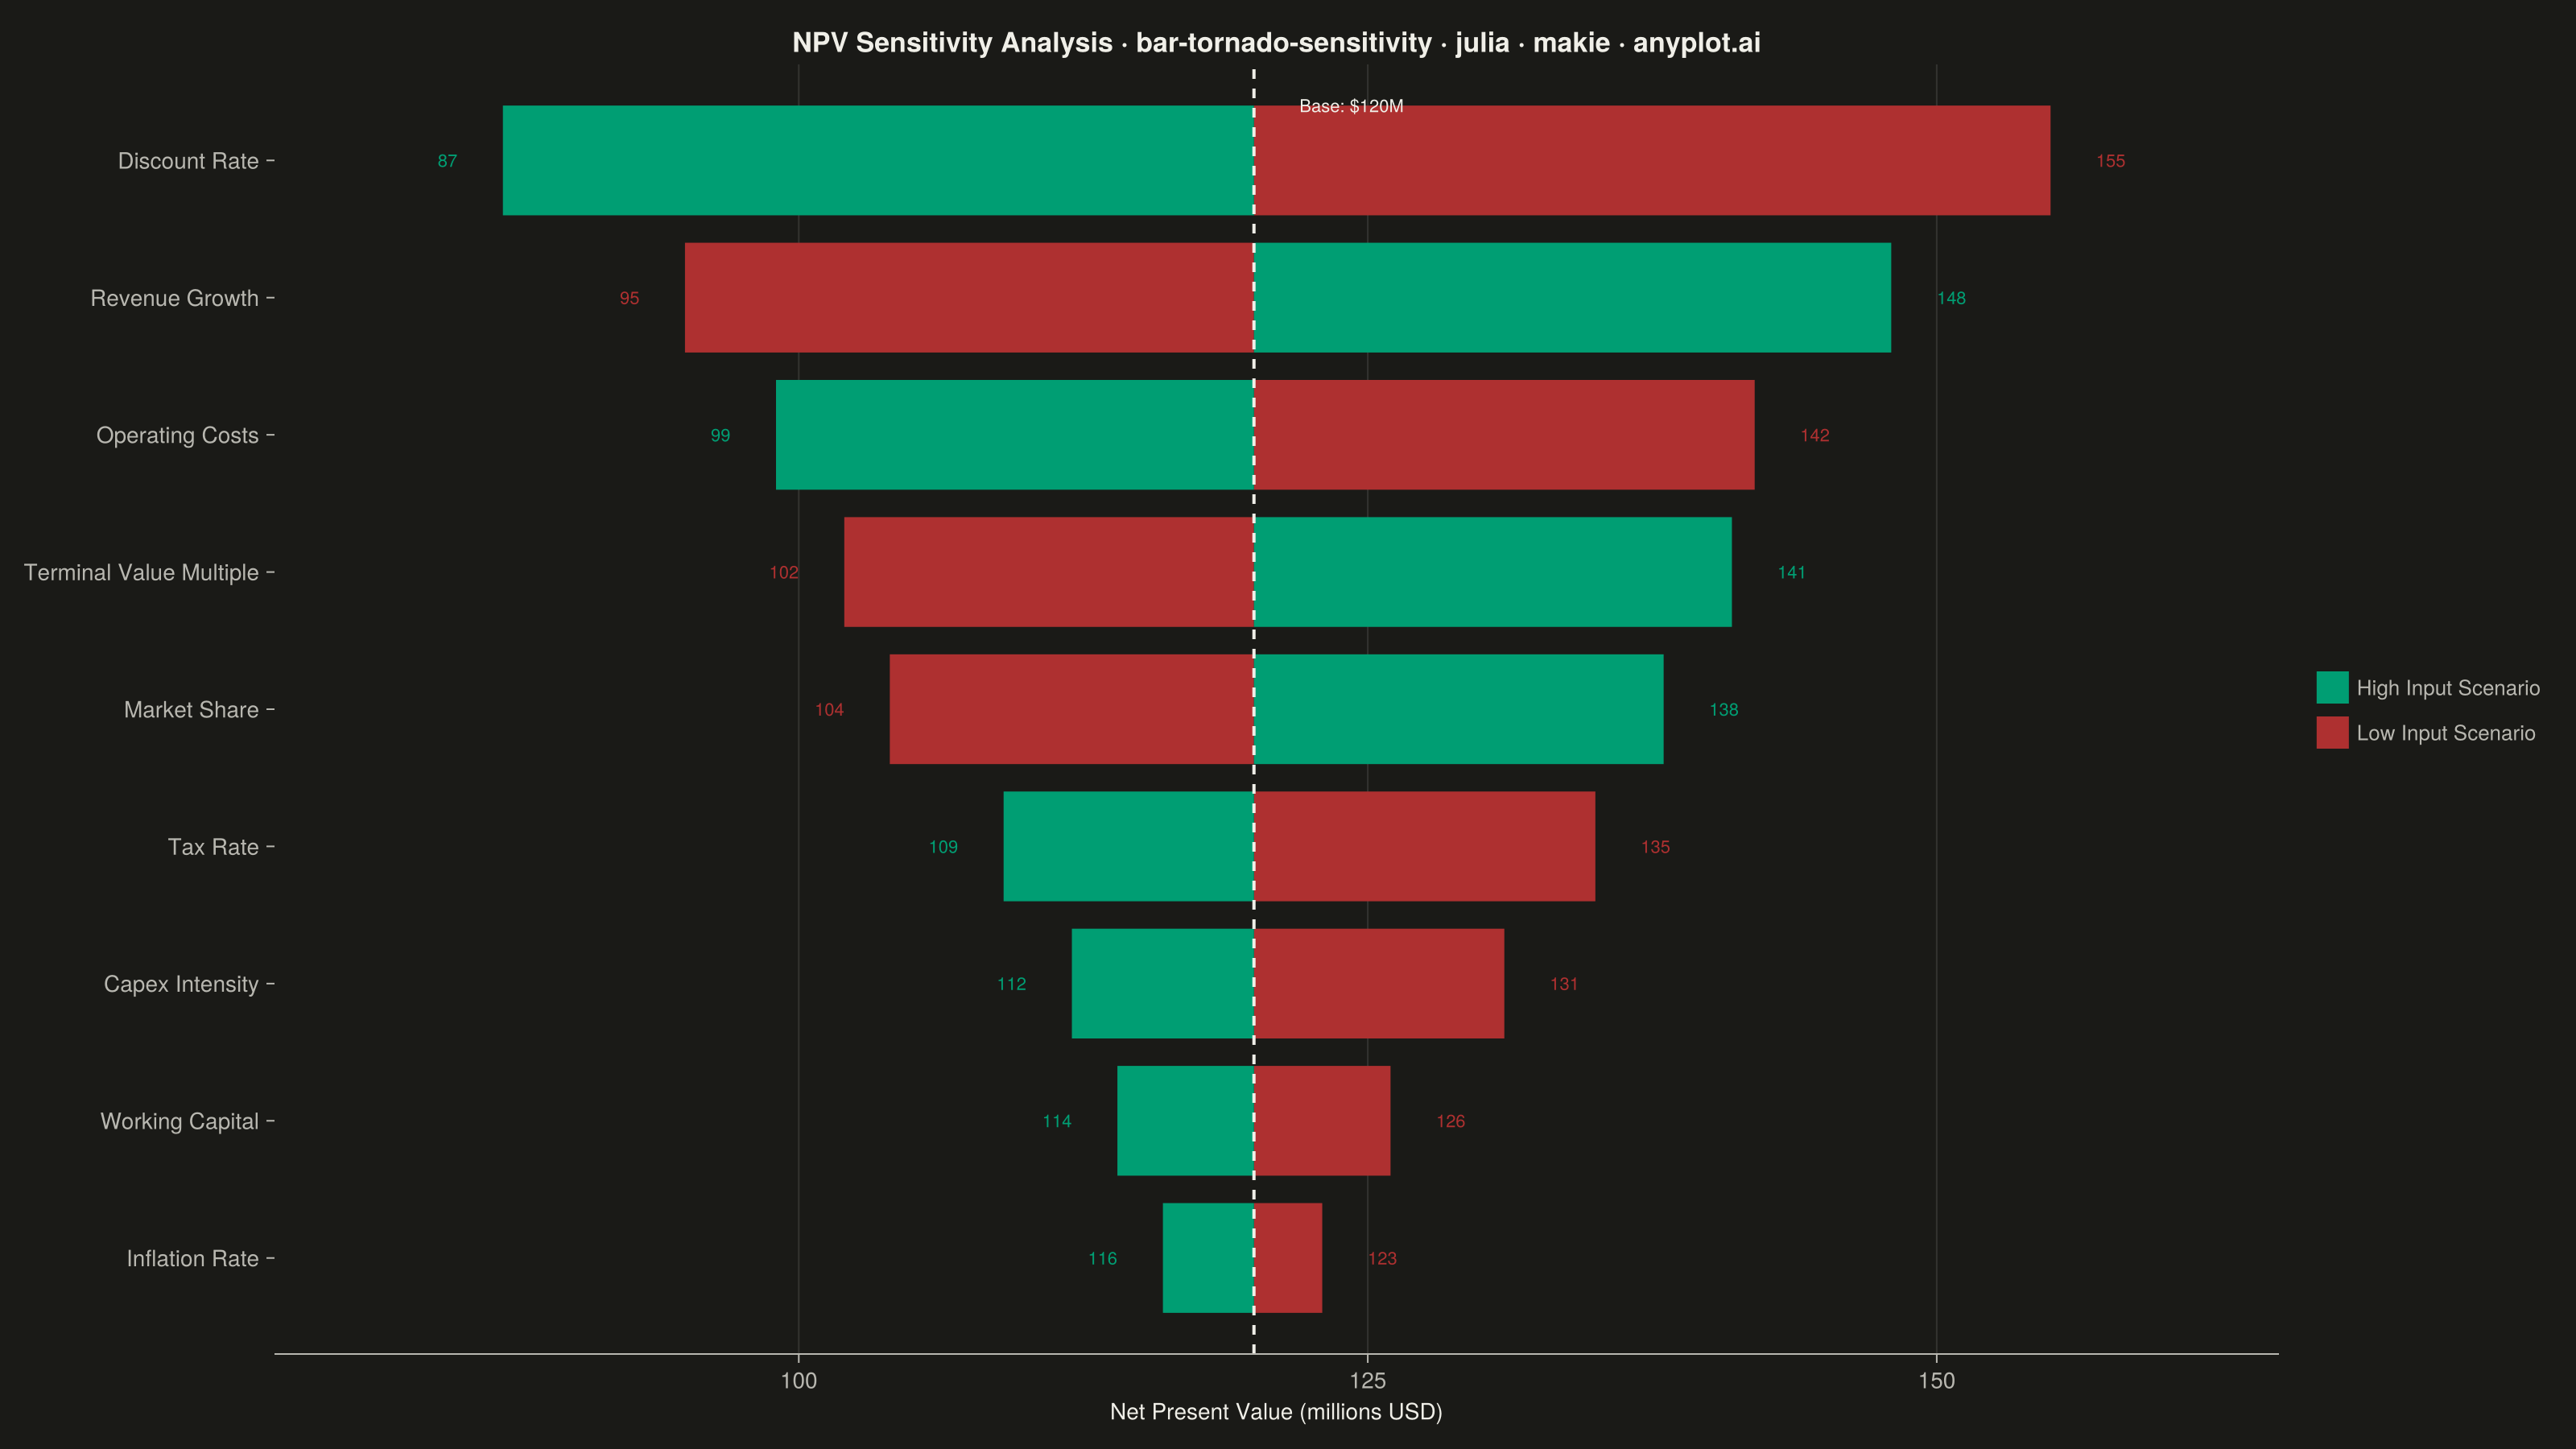
A horizontal bar chart where bars are sorted by influence magnitude, extending left and right from a base case vertical reference line. Each bar represents one input parameter and shows how varying that parameter between its low and high values affects the output, creating a characteristic tornado shape (widest bars at top, narrowest at bottom). Dual colors distinguish low-input from high-input effects, making it immediately clear which parameters drive the most uncertainty.
# anyplot.ai
# bar-tornado-sensitivity: Tornado Diagram for Sensitivity Analysis
# Library: makie 0.22.10 | Julia 1.11.9
# Quality: 90/100 | Created: 2026-06-02

using CairoMakie
using Colors
using Random

Random.seed!(42)

const THEME       = get(ENV, "ANYPLOT_THEME", "light")
const PAGE_BG     = THEME == "light" ? colorant"#FAF8F1" : colorant"#1A1A17"
const ELEVATED_BG = THEME == "light" ? colorant"#FFFDF6" : colorant"#242420"
const INK         = THEME == "light" ? colorant"#1A1A17" : colorant"#F0EFE8"
const INK_SOFT    = THEME == "light" ? colorant"#4A4A44" : colorant"#B8B7B0"
const INK_MUTED   = THEME == "light" ? colorant"#6B6A63" : colorant"#A8A79F"

# Imprint palette — semantic: green = high/upside, red = low/downside
const COLOR_HIGH = colorant"#009E73"  # Imprint position 1
const COLOR_LOW  = colorant"#AE3030"  # Imprint position 5 (semantic anchor: downside)

# NPV sensitivity analysis — capital investment project, values in millions USD
const BASE_NPV = 120.0

parameters = [
    "Discount Rate",
    "Revenue Growth",
    "Operating Costs",
    "Terminal Value Multiple",
    "Market Share",
    "Tax Rate",
    "Capex Intensity",
    "Working Capital",
    "Inflation Rate",
]
low_values  = [155.0,  95.0, 142.0, 102.0, 104.0, 135.0, 131.0, 126.0, 123.0]
high_values = [ 87.0, 148.0,  99.0, 141.0, 138.0, 109.0, 112.0, 114.0, 116.0]

# Sort ascending by sensitivity range — widest bar plots at top (highest y index)
ranges = abs.(high_values .- low_values)
order  = sortperm(ranges)
n      = length(parameters)
params = parameters[order]
lows   = low_values[order]
highs  = high_values[order]

low_deltas  = lows  .- BASE_NPV
high_deltas = highs .- BASE_NPV

# Figure
fig = Figure(
    size            = (1600, 900),
    fontsize        = 14,
    backgroundcolor = PAGE_BG,
)

title_str = "NPV Sensitivity Analysis · bar-tornado-sensitivity · julia · makie · anyplot.ai"
title_fs  = round(Int, 20 * 67 / length(title_str))

ax = Axis(
    fig[1, 1];
    title              = title_str,
    titlesize          = title_fs,
    titlefont          = :bold,
    titlecolor         = INK,
    xlabel             = "Net Present Value (millions USD)",
    xlabelcolor        = INK,
    xlabelsize         = 14,
    xticklabelsize     = 14,
    xticklabelcolor    = INK_SOFT,
    yticklabelsize     = 14,
    yticklabelcolor    = INK_SOFT,
    xtickcolor         = INK_SOFT,
    ytickcolor         = INK_SOFT,
    backgroundcolor    = PAGE_BG,
    topspinevisible    = false,
    rightspinevisible  = false,
    leftspinevisible   = false,
    bottomspinecolor   = INK_SOFT,
    xgridcolor         = RGBAf(INK.r, INK.g, INK.b, 0.12),
    ygridvisible       = false,
    xminorgridvisible  = false,
    yminorgridvisible  = false,
)

# Tornado bars — low and high input scenarios
barplot!(ax, 1:n, low_deltas;
    direction   = :x,
    offset      = BASE_NPV,
    color       = COLOR_LOW,
    strokewidth = 0,
)
barplot!(ax, 1:n, high_deltas;
    direction   = :x,
    offset      = BASE_NPV,
    color       = COLOR_HIGH,
    strokewidth = 0,
)

# Reference line at base case NPV
vlines!(ax, BASE_NPV; color = INK, linewidth = 2.0, linestyle = :dash)

# Y-axis parameter labels and limits
ax.yticks = (1:n, params)
ylims!(ax, 0.3, Float64(n) + 0.7)

# X-axis limits with padding for bar-end labels
x_pad = 10.0
xlims!(ax,
    minimum(min.(lows, highs)) - x_pad,
    maximum(max.(lows, highs)) + x_pad,
)

# Reference line annotation
text!(ax, [Point2f(BASE_NPV + 2.0, n + 0.4)];
    text     = ["Base: \$120M"],
    color    = INK,
    fontsize = 11,
    align    = (:left, :center),
)

# Bar-end value labels — one label per bar tip showing the resulting NPV
for i in 1:n
    xl = lows[i]
    xoff_l  = xl > BASE_NPV ? 2.0 : -2.0
    align_l = xl > BASE_NPV ? :left : :right
    text!(ax, [Point2f(xl + xoff_l, Float64(i))];
        text     = ["$(round(Int, xl))"],
        color    = COLOR_LOW,
        fontsize = 11,
        align    = (align_l, :center),
    )
    xh = highs[i]
    xoff_h  = xh > BASE_NPV ? 2.0 : -2.0
    align_h = xh > BASE_NPV ? :left : :right
    text!(ax, [Point2f(xh + xoff_h, Float64(i))];
        text     = ["$(round(Int, xh))"],
        color    = COLOR_HIGH,
        fontsize = 11,
        align    = (align_h, :center),
    )
end

# Legend — framevisible=false per style guide (no legend box borders)
elem_high = PolyElement(color = COLOR_HIGH, strokecolor = :transparent)
elem_low  = PolyElement(color = COLOR_LOW,  strokecolor = :transparent)
Legend(
    fig[1, 2],
    [elem_high, elem_low],
    ["High Input Scenario", "Low Input Scenario"];
    framevisible    = false,
    backgroundcolor = ELEVATED_BG,
    labelcolor      = INK_SOFT,
    labelsize       = 13,
    rowgap          = 8,
)

save("plot-$(THEME).png", fig; px_per_unit = 2)
Runnable source as JSON, for any HTTP client: https://api.anyplot.ai/specs/bar-tornado-sensitivity/makie/code. Any spec id and library id listed in llms-full.txt fit the same URL shape; every URL below is complete and callable.
{
  "spec_id": "bar-tornado-sensitivity",
  "language": "julia",
  "library": "makie",
  "page": "https://anyplot.ai/bar-tornado-sensitivity/julia/makie",
  "hub": "https://anyplot.ai/bar-tornado-sensitivity",
  "code_json": "https://api.anyplot.ai/specs/bar-tornado-sensitivity/makie/code",
  "spec_json": "https://api.anyplot.ai/specs/bar-tornado-sensitivity",
  "render_light_png": "https://storage.googleapis.com/anyplot-images/plots/bar-tornado-sensitivity/julia/makie/plot-light.png",
  "render_dark_png": "https://storage.googleapis.com/anyplot-images/plots/bar-tornado-sensitivity/julia/makie/plot-dark.png",
  "quality_score": 90.0,
  "license": "MIT",
  "guide": "https://anyplot.ai/llms.txt"
}
Part of Tornado Diagram for Sensitivity Analysis on anyplot.ai.