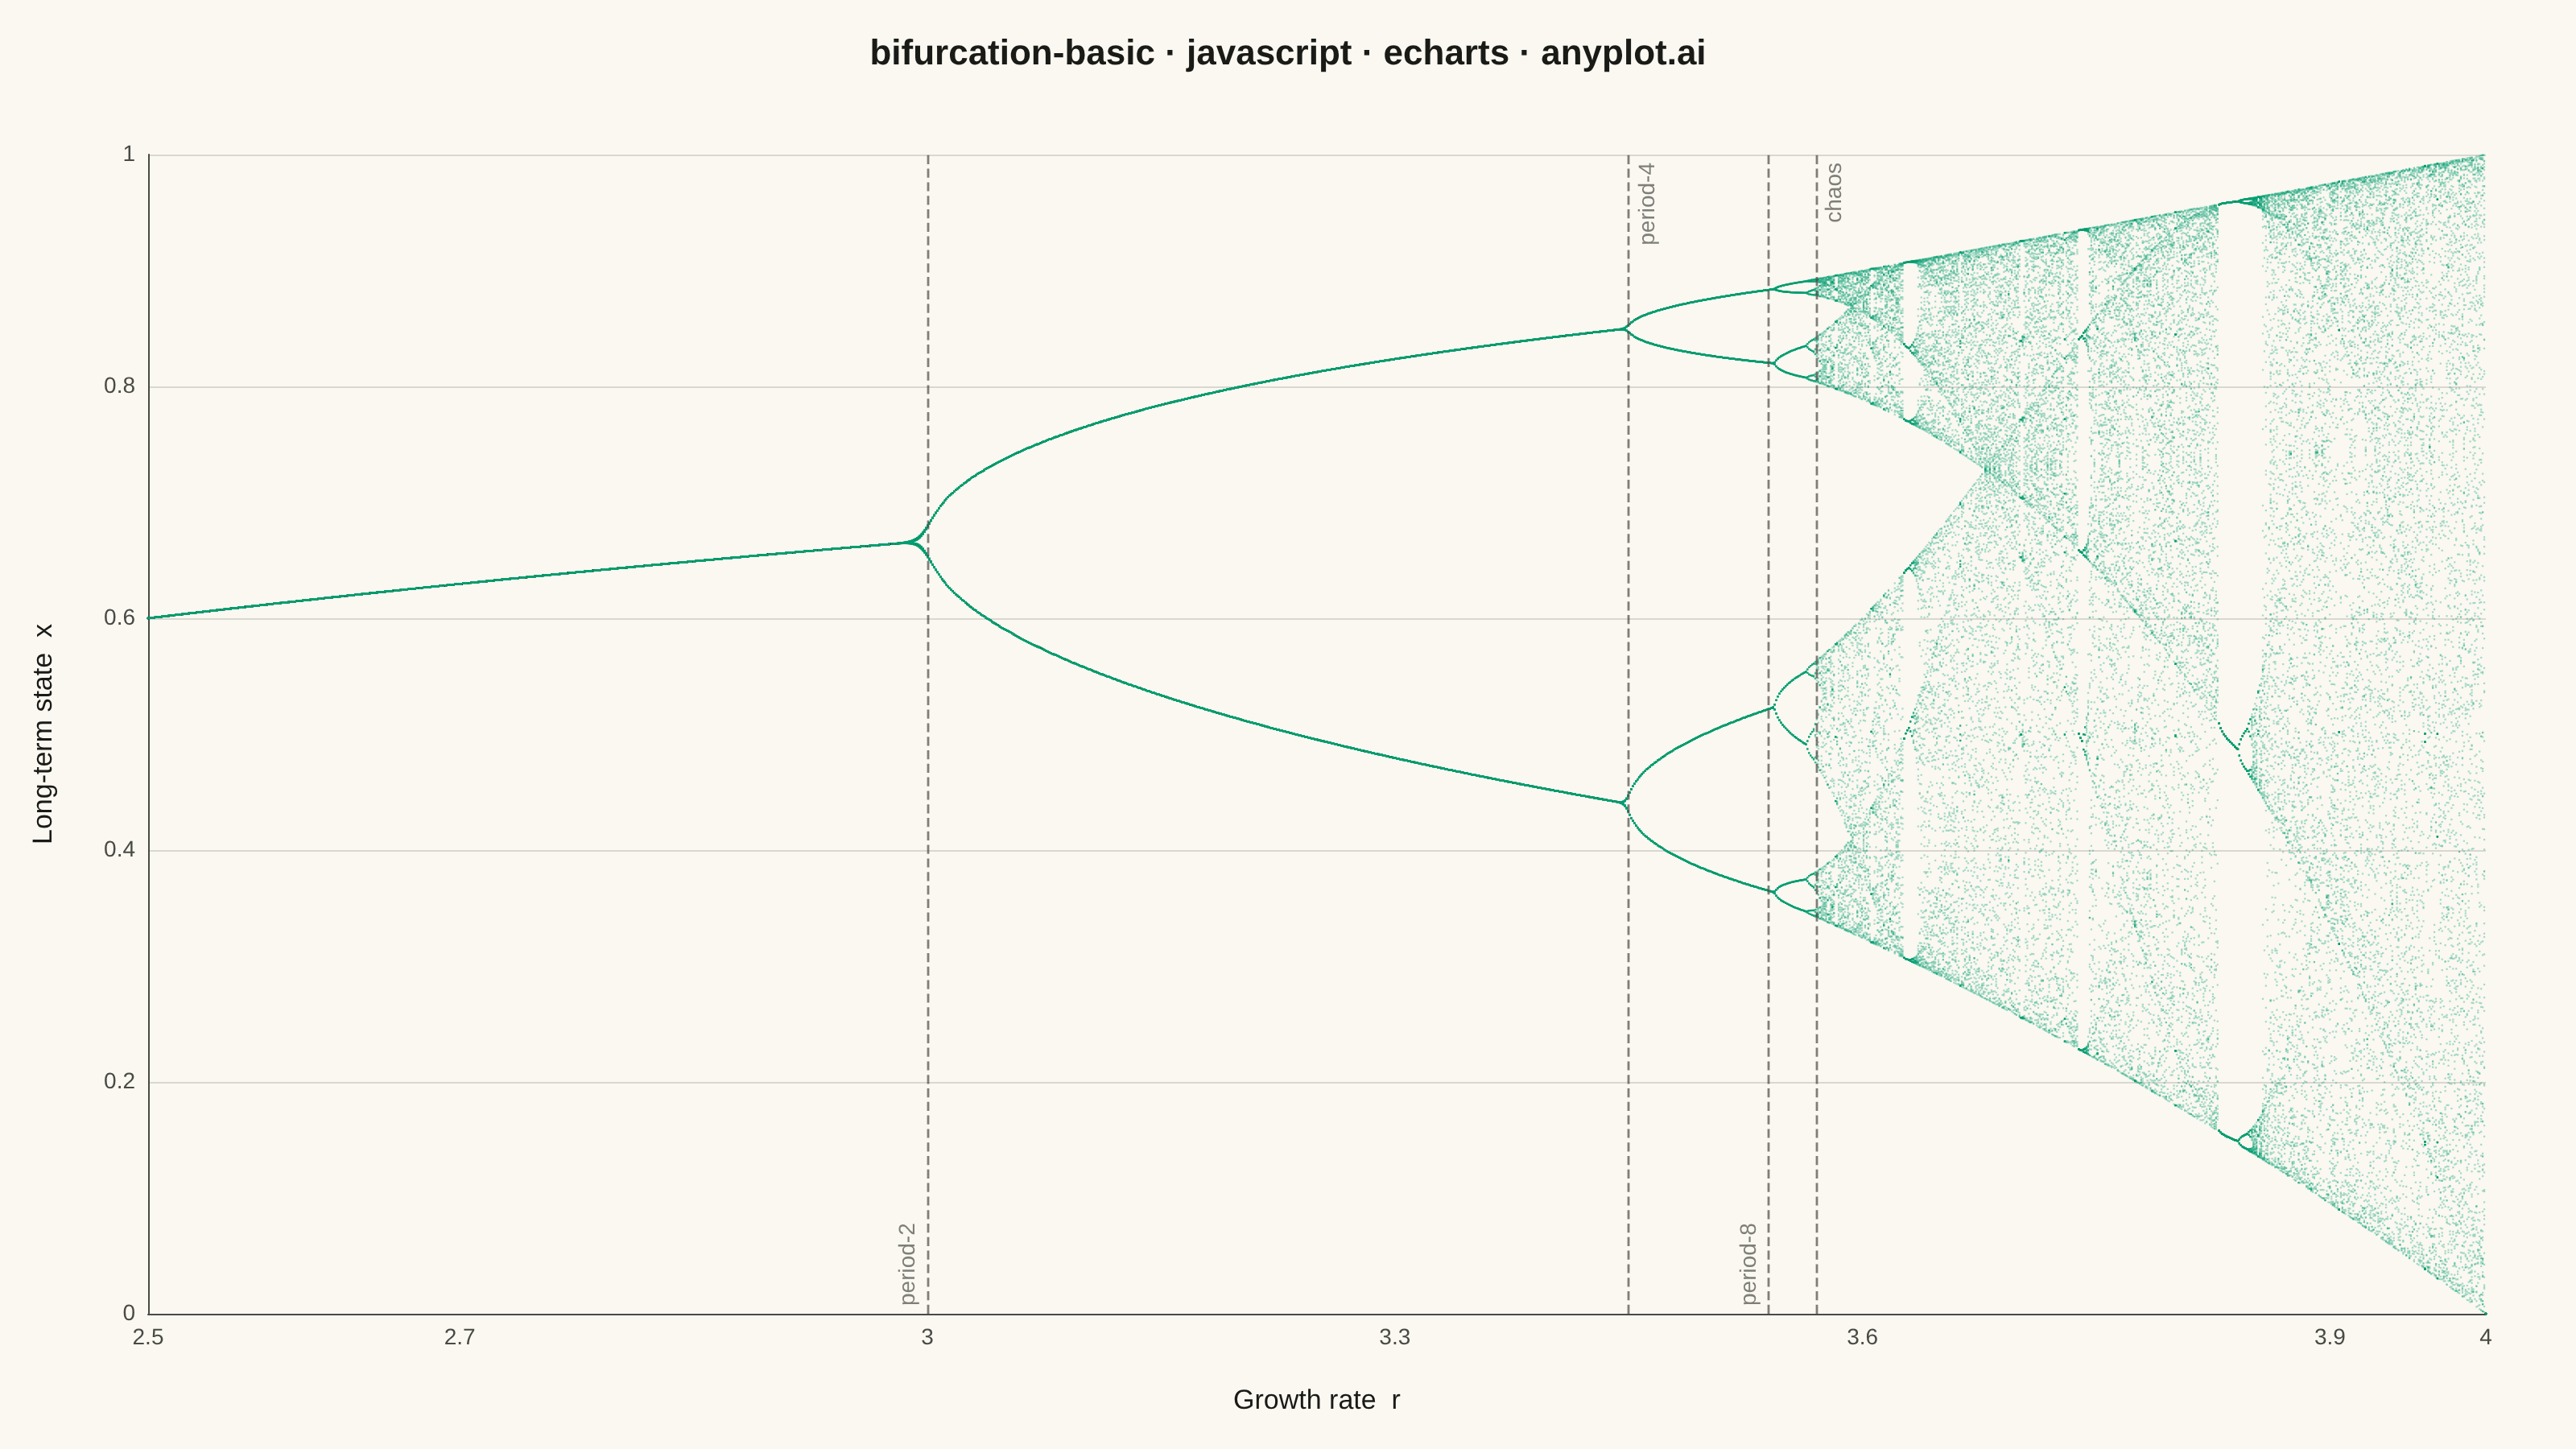
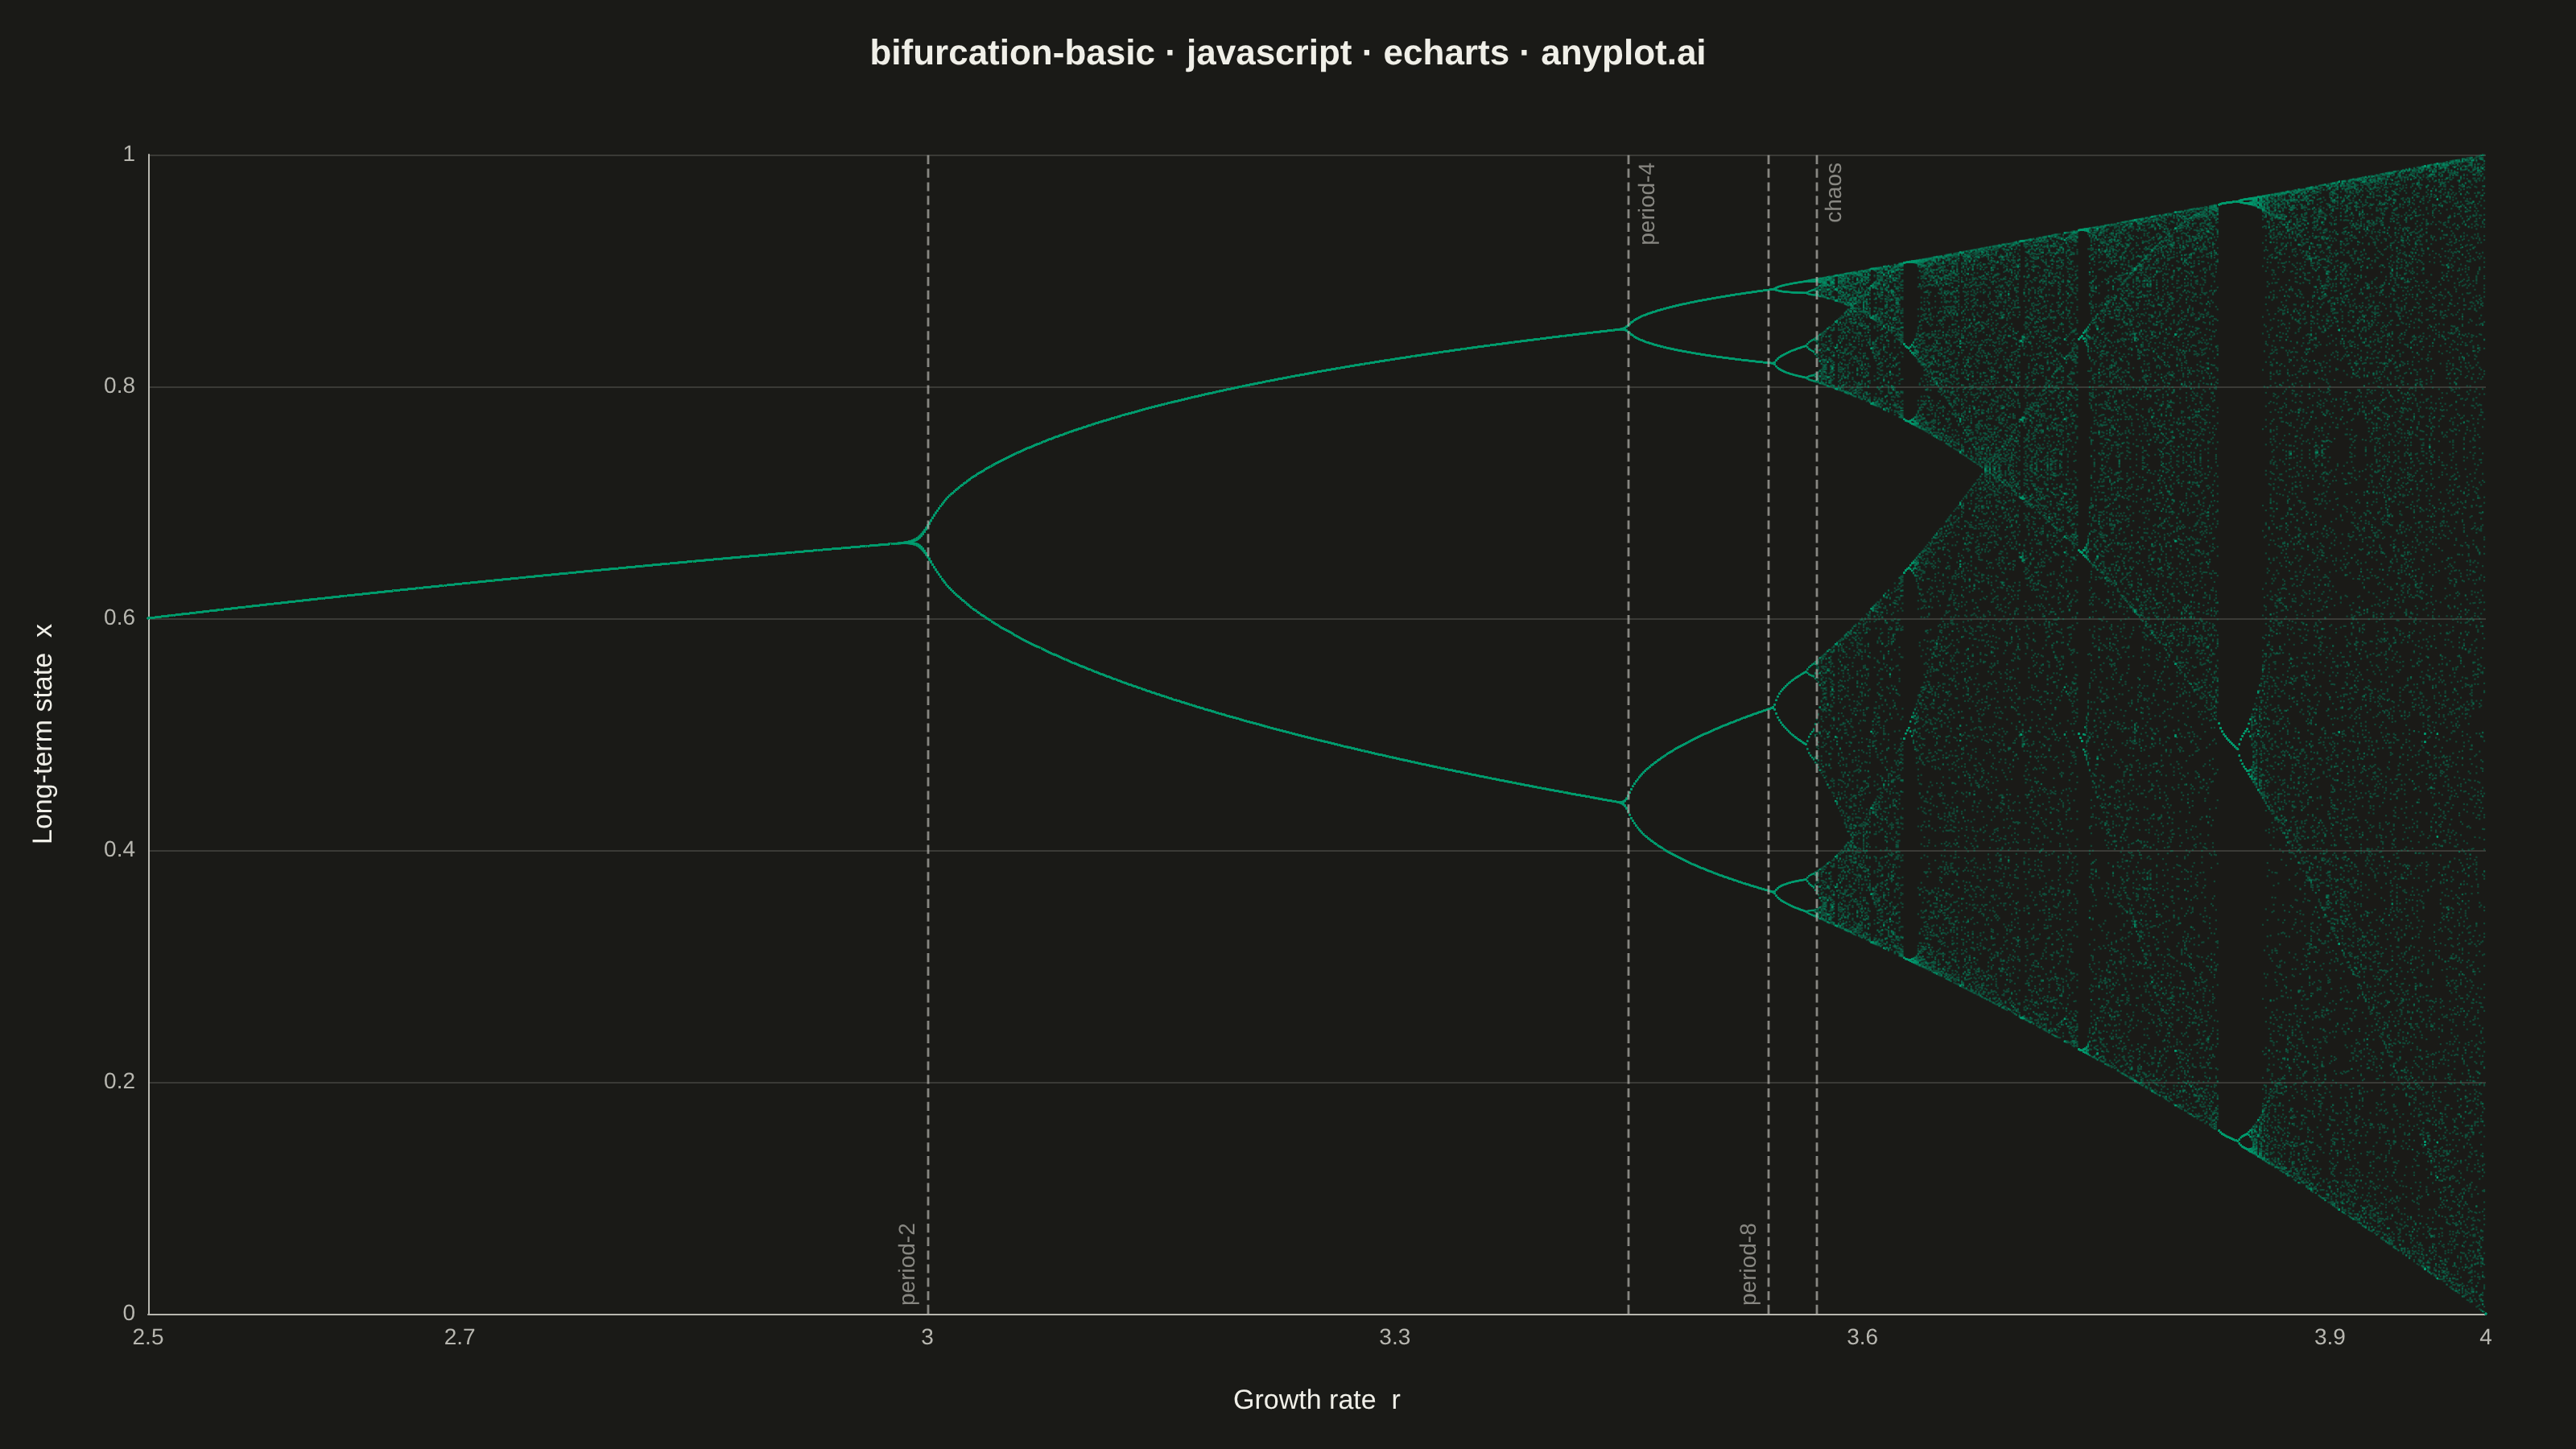
A bifurcation diagram shows how the steady-state behavior of a dynamical system changes as a control parameter varies. By plotting the long-term values of a state variable against a continuously varied parameter, it reveals transitions from stable fixed points through period-doubling cascades to chaotic regimes. The classic example is the logistic map, where the route to chaos is clearly visible as the growth rate parameter increases.
// anyplot.ai
// bifurcation-basic: Bifurcation Diagram for Dynamical Systems
// Library: echarts 5.5.1 | JavaScript 22.22.3
// Quality: 91/100 | Created: 2026-06-17
//# anyplot-orientation: landscape

const t = window.ANYPLOT_TOKENS;
const BRAND = t.palette[0]; // #009E73 — Imprint palette position 1 (first series)

// --- Data: logistic map x(n+1) = r * x(n) * (1 - x(n)) ----------------------
// For each growth rate r, iterate the map, discard the transient, and keep the
// long-term orbit. Fully deterministic — no RNG needed.
const R_MIN = 2.5;
const R_MAX = 4.0;
const R_STEPS = 1500; // parameter resolution across [2.5, 4.0]
const TRANSIENT = 300; // iterations discarded before the orbit settles
const KEEP = 100; // long-term state values recorded per r

const points = [];
for (let i = 0; i < R_STEPS; i++) {
  const r = R_MIN + ((R_MAX - R_MIN) * i) / (R_STEPS - 1);
  let x = 0.5;
  for (let n = 0; n < TRANSIENT; n++) {
    x = r * x * (1 - x);
  }
  for (let n = 0; n < KEEP; n++) {
    x = r * x * (1 - x);
    points.push([r, x]);
  }
}
// ~150,000 points — dense enough to resolve the period-doubling cascade.

// Key period-doubling thresholds on the route to chaos.
// Positions staggered (top/bottom alternating) so the three closely-spaced
// labels near chaos onset (r ≈ 3.449 / 3.544 / 3.5699) don't crowd each other.
const bifurcations = [
  { r: 3.0,    text: "period-2", position: "insideStartTop" },
  { r: 3.449,  text: "period-4", position: "insideEndBottom" },
  { r: 3.544,  text: "period-8", position: "insideStartTop" },
  { r: 3.5699, text: "chaos",    position: "insideEndBottom" },
];

// --- Init -------------------------------------------------------------------
const chart = echarts.init(document.getElementById("container"));

// --- Option -----------------------------------------------------------------
chart.setOption({
  animation: false,
  color: t.palette,
  backgroundColor: "transparent",
  title: {
    text: "bifurcation-basic · javascript · echarts · anyplot.ai",
    left: "center",
    top: 18,
    textStyle: { color: t.ink, fontSize: 22, fontWeight: "bold" },
  },
  grid: { left: 92, right: 56, top: 96, bottom: 84 },
  xAxis: {
    type: "value",
    min: R_MIN,
    max: R_MAX,
    name: "Growth rate  r",
    nameLocation: "middle",
    nameGap: 46,
    nameTextStyle: { color: t.ink, fontSize: 17 },
    axisLabel: { color: t.inkSoft, fontSize: 14 },
    axisLine: { lineStyle: { color: t.inkSoft } },
    axisTick: { show: false },
    splitLine: { show: false },
  },
  yAxis: {
    type: "value",
    min: 0,
    max: 1,
    name: "Long-term state  x",
    nameLocation: "middle",
    nameGap: 56,
    nameTextStyle: { color: t.ink, fontSize: 17 },
    axisLabel: { color: t.inkSoft, fontSize: 14 },
    axisLine: { lineStyle: { color: t.inkSoft } },
    axisTick: { show: false },
    splitLine: { lineStyle: { color: t.grid } },
  },
  series: [
    {
      type: "scatter",
      data: points,
      symbolSize: 1.1, // very small points → density-based visualization
      large: true, // optimised path for the 150k-point cloud
      largeThreshold: 2000,
      itemStyle: { color: BRAND, opacity: 0.34 },
      markLine: {
        symbol: "none",
        silent: true,
        lineStyle: { color: t.inkSoft, type: "dashed", width: 1.4, opacity: 0.7 },
        // Per-item label overrides carry the position and text; fontSize 14 gives
        // comfortable legibility at both full resolution and mobile thumbnail.
        label: { color: t.inkSoft, fontSize: 14 },
        data: bifurcations.map((b) => ({
          xAxis: b.r,
          label: { formatter: b.text, position: b.position },
        })),
      },
    },
  ],
});
Runnable source as JSON, for any HTTP client: https://api.anyplot.ai/specs/bifurcation-basic/echarts/code. Any spec id and library id listed in llms-full.txt fit the same URL shape; every URL below is complete and callable.
{
  "spec_id": "bifurcation-basic",
  "language": "javascript",
  "library": "echarts",
  "page": "https://anyplot.ai/bifurcation-basic/javascript/echarts",
  "hub": "https://anyplot.ai/bifurcation-basic",
  "code_json": "https://api.anyplot.ai/specs/bifurcation-basic/echarts/code",
  "spec_json": "https://api.anyplot.ai/specs/bifurcation-basic",
  "render_light_png": "https://storage.googleapis.com/anyplot-images/plots/bifurcation-basic/javascript/echarts/plot-light.png",
  "render_dark_png": "https://storage.googleapis.com/anyplot-images/plots/bifurcation-basic/javascript/echarts/plot-dark.png",
  "interactive_light_html": "https://storage.googleapis.com/anyplot-images/plots/bifurcation-basic/javascript/echarts/plot-light.html",
  "interactive_dark_html": "https://storage.googleapis.com/anyplot-images/plots/bifurcation-basic/javascript/echarts/plot-dark.html",
  "quality_score": 91.0,
  "license": "MIT",
  "guide": "https://anyplot.ai/llms.txt"
}
Part of Bifurcation Diagram for Dynamical Systems on anyplot.ai.