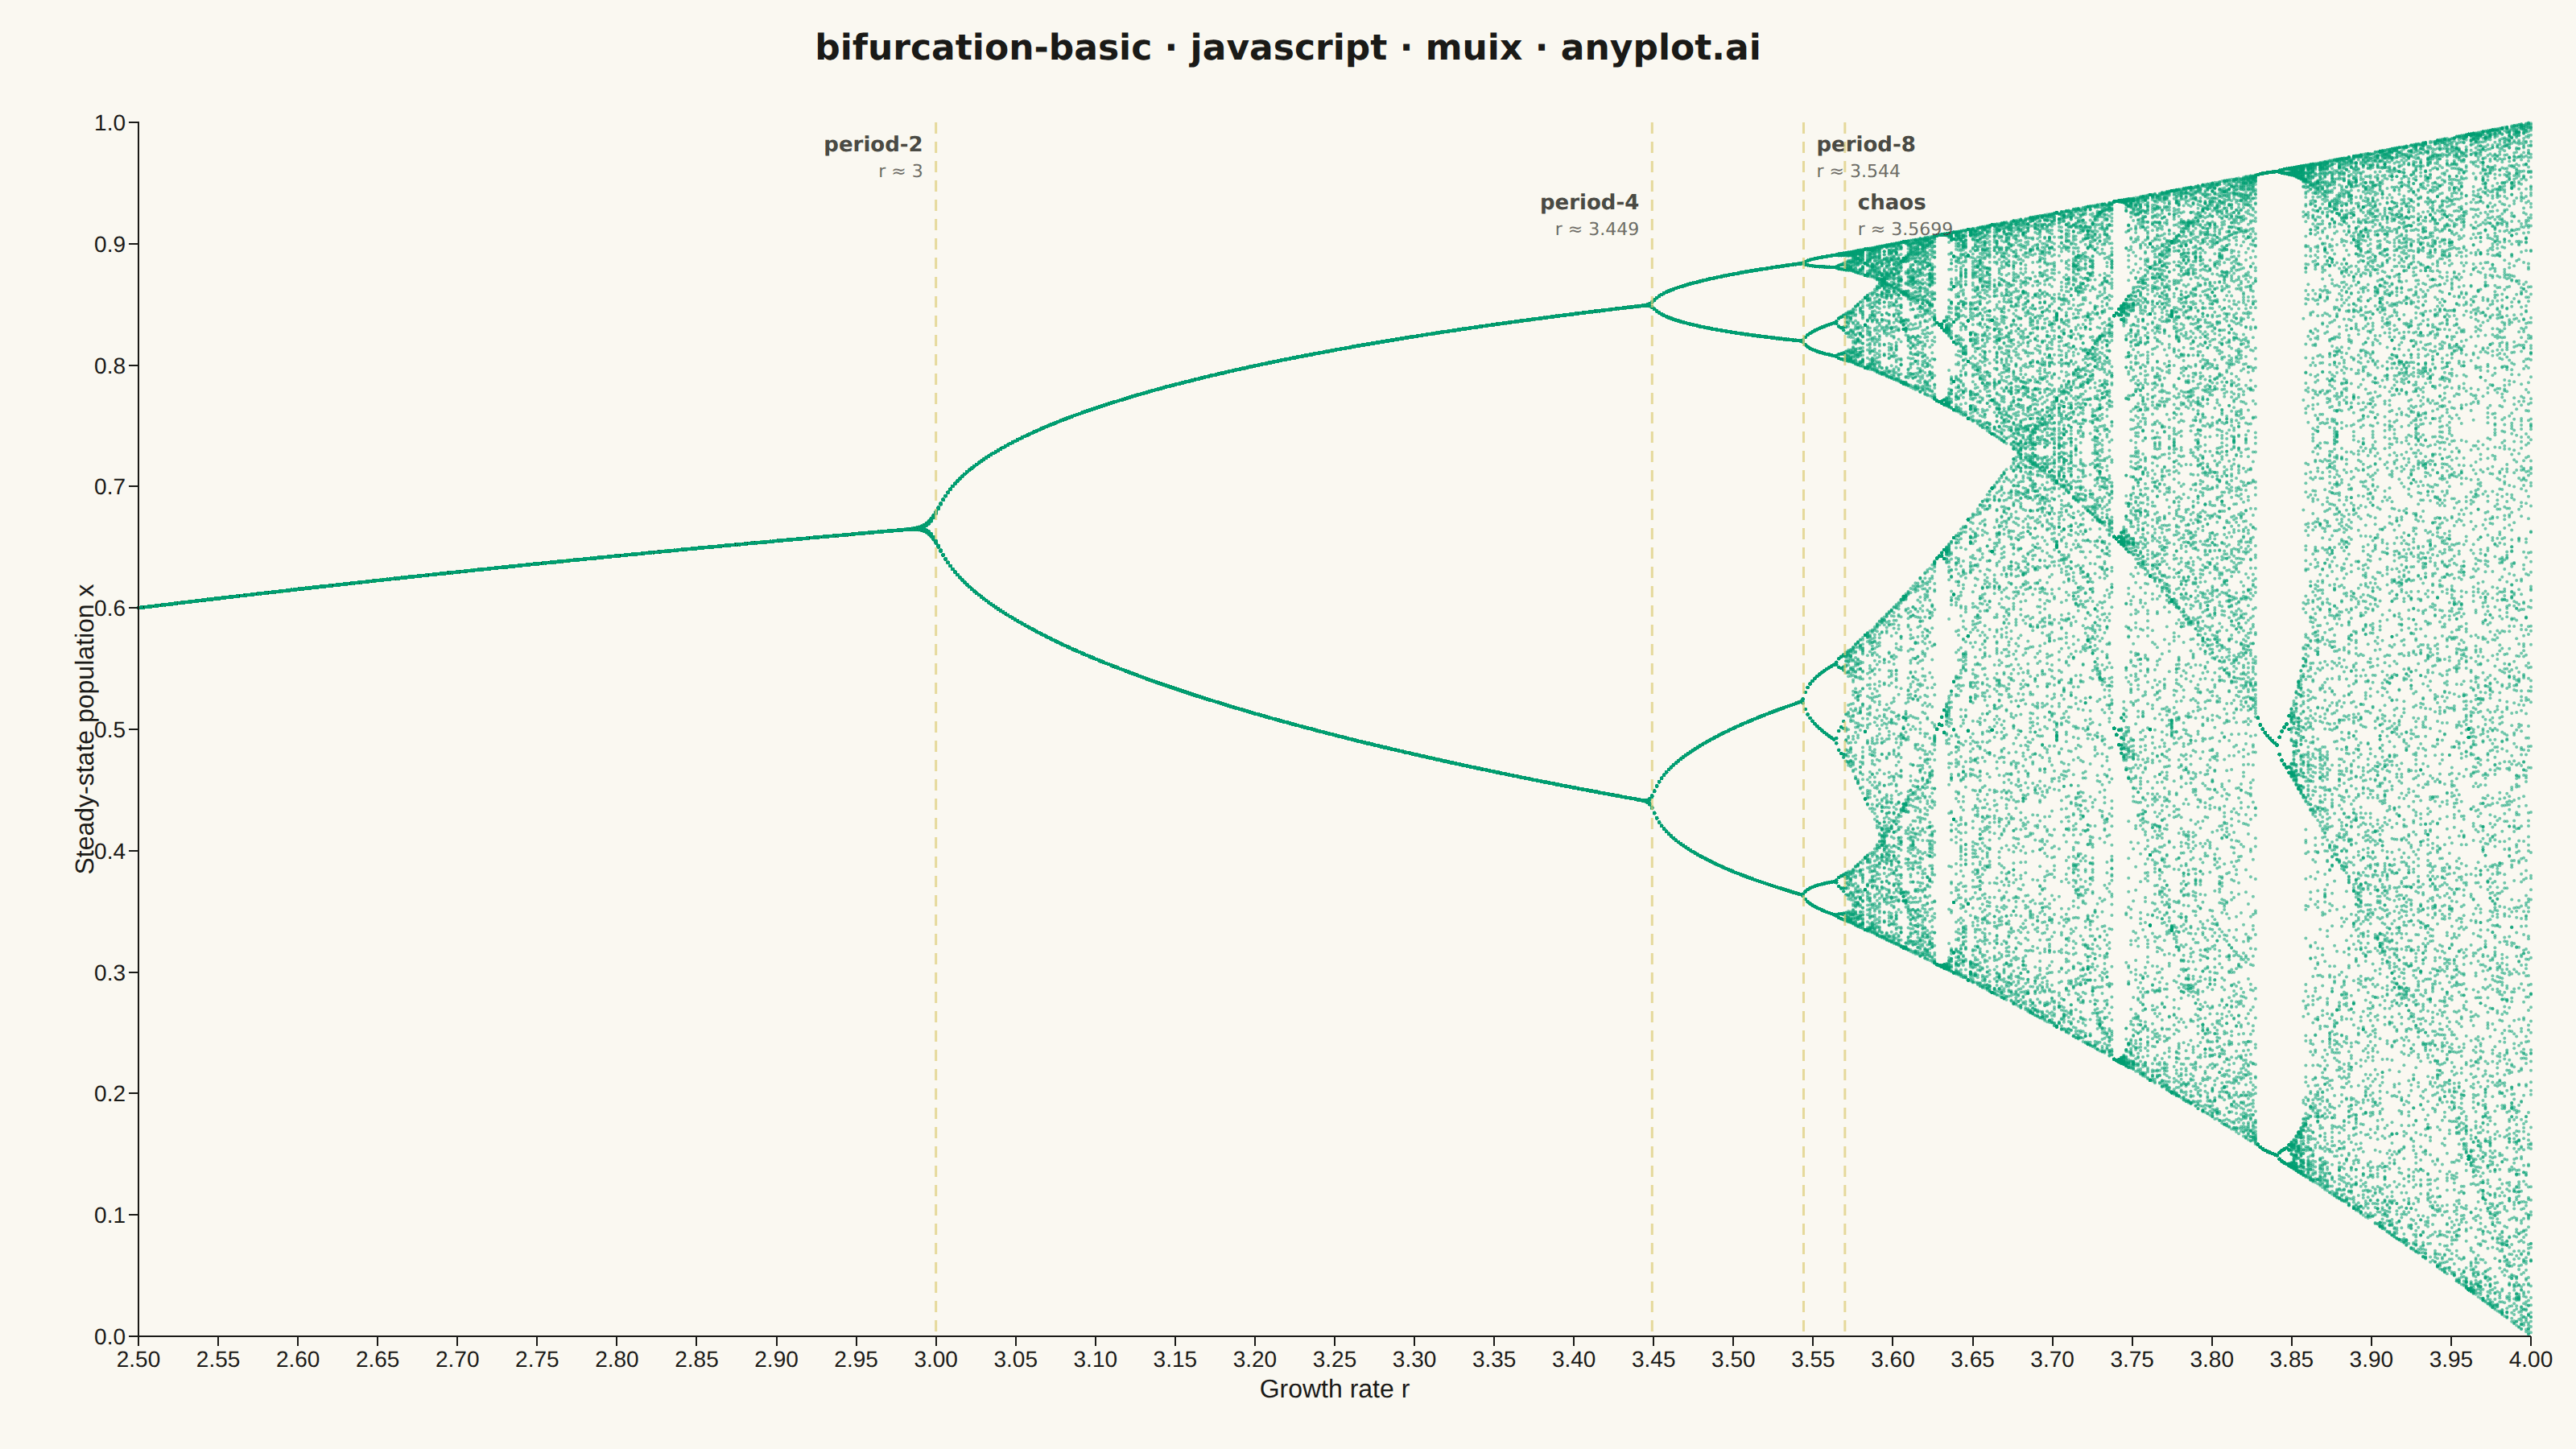
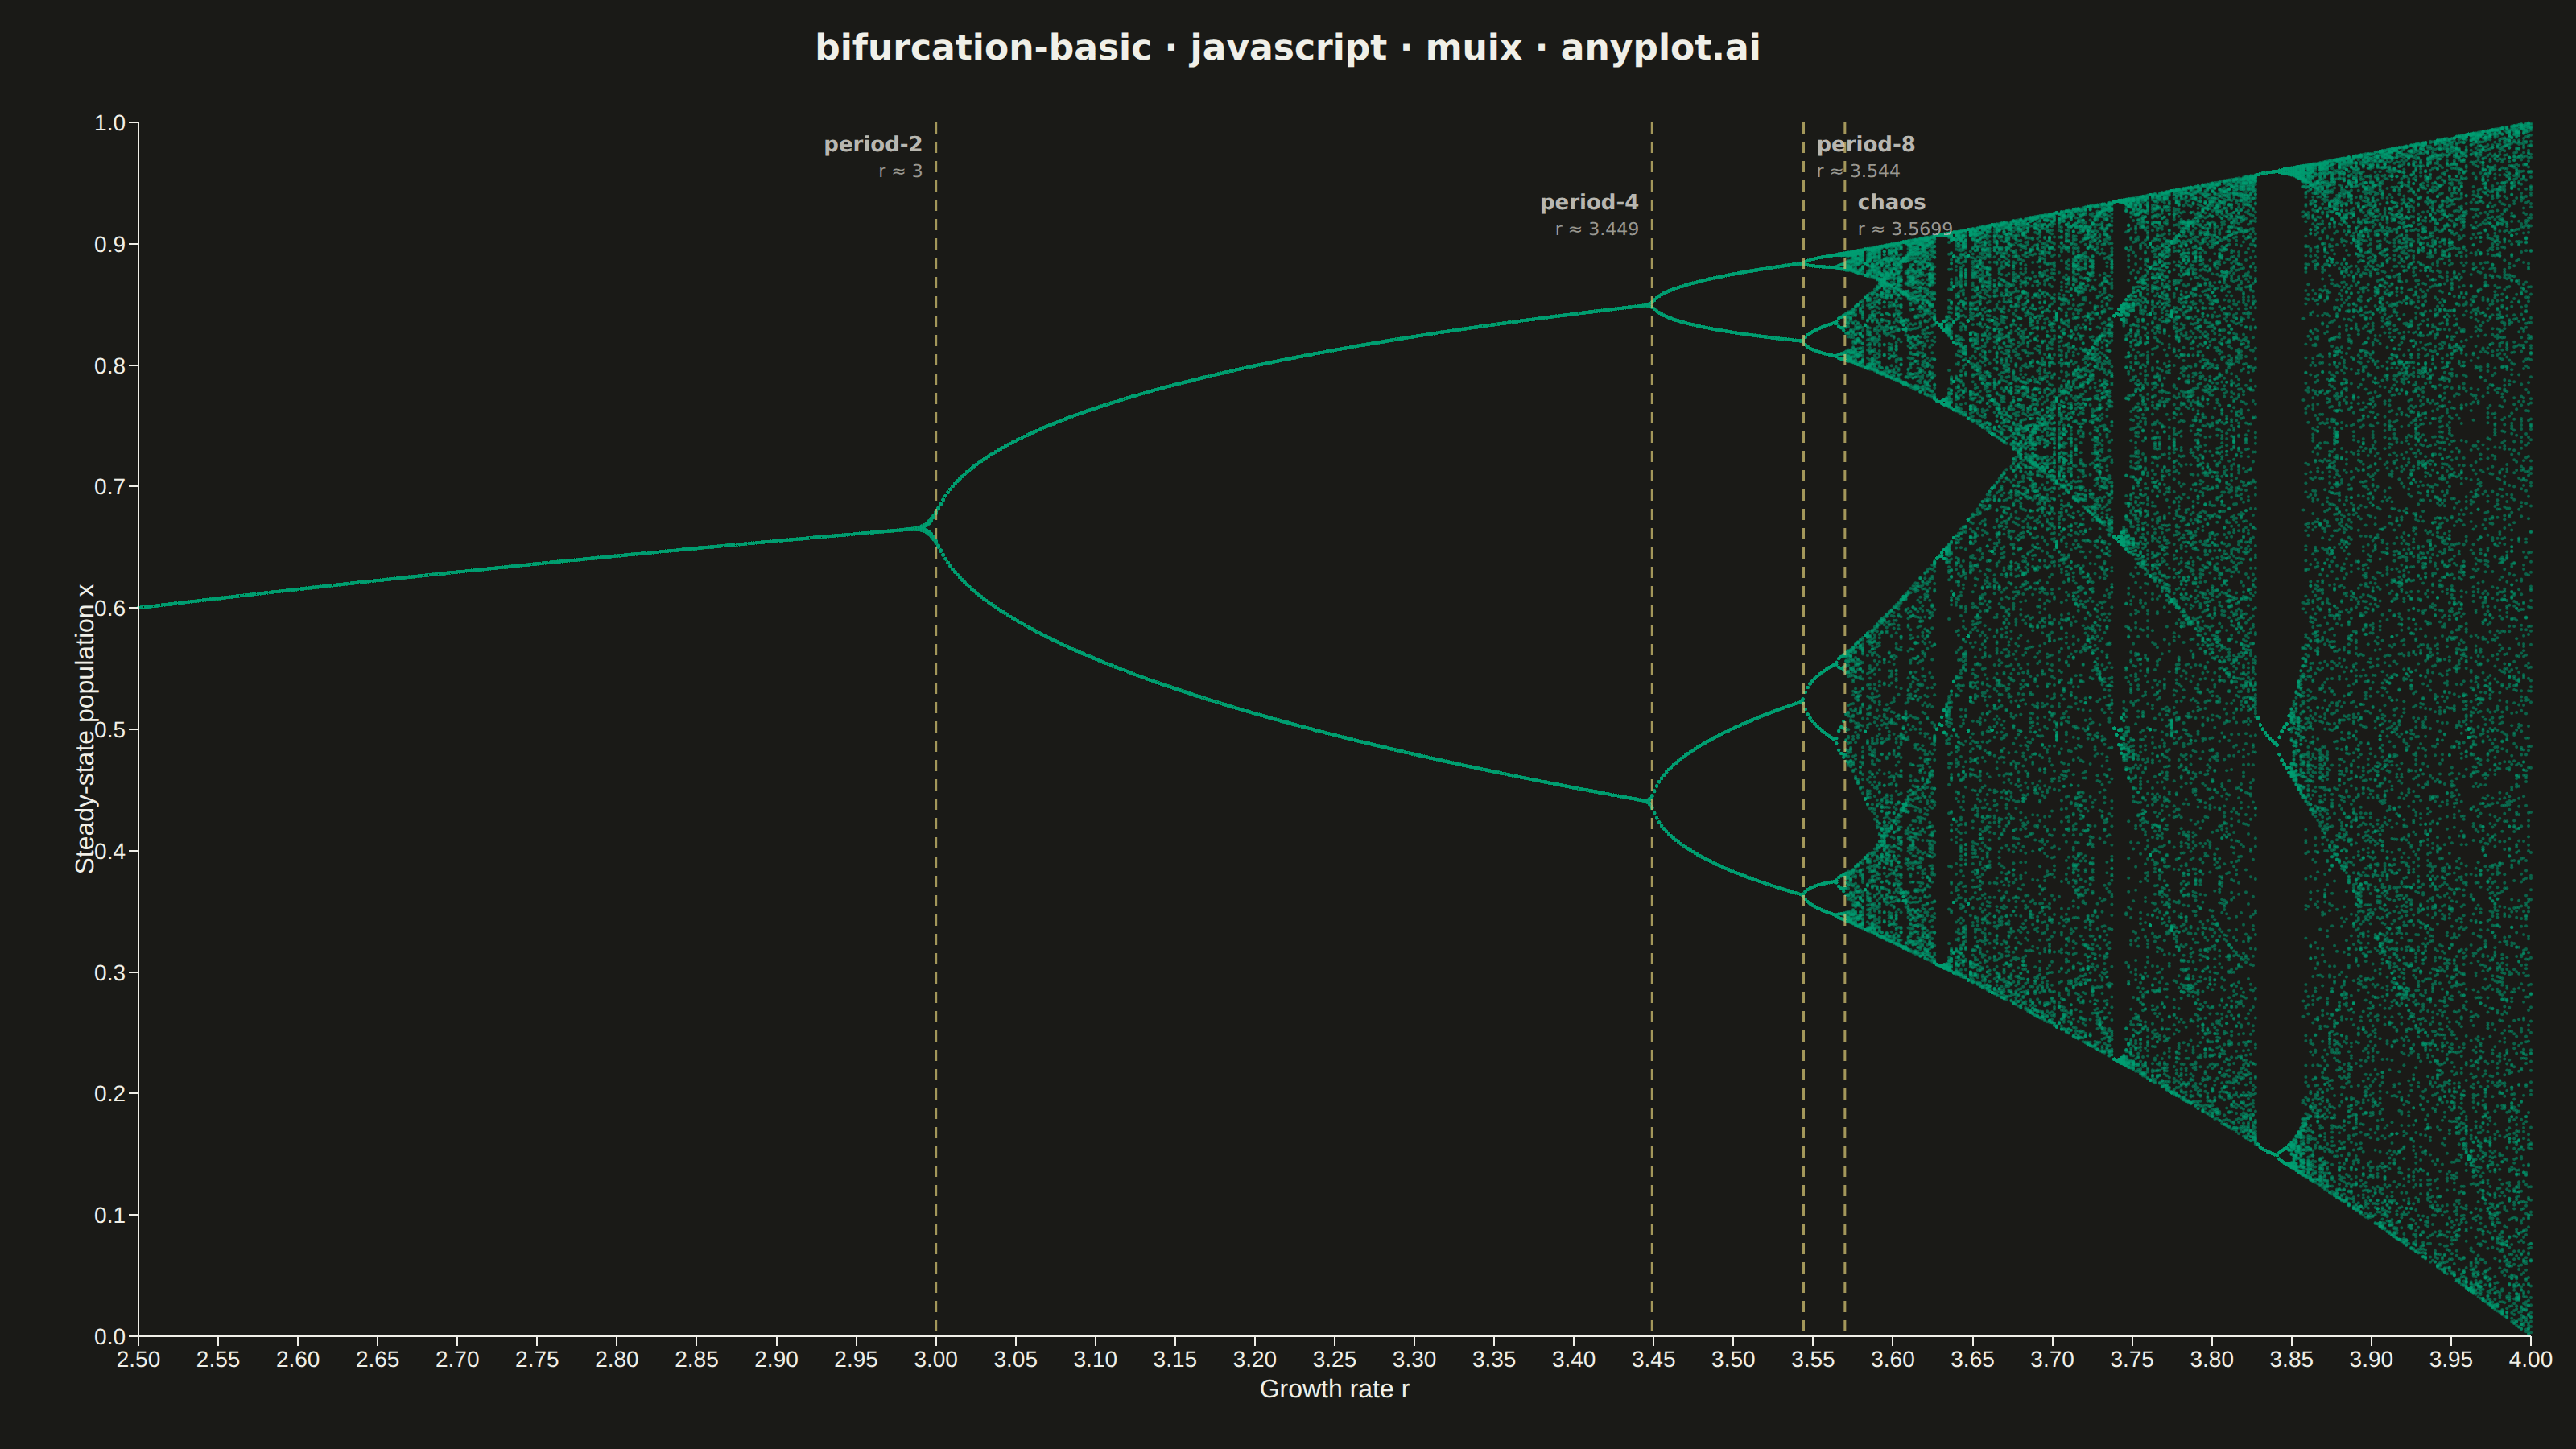
A bifurcation diagram shows how the steady-state behavior of a dynamical system changes as a control parameter varies. By plotting the long-term values of a state variable against a continuously varied parameter, it reveals transitions from stable fixed points through period-doubling cascades to chaotic regimes. The classic example is the logistic map, where the route to chaos is clearly visible as the growth rate parameter increases.
// anyplot.ai
// bifurcation-basic: Bifurcation Diagram for Dynamical Systems
// Library: muix 7.29.1 | JavaScript 22.22.3
// Quality: 91/100 | Created: 2026-06-17
//# anyplot-orientation: landscape
// anyplot.ai
// bifurcation-basic: Bifurcation Diagram for Dynamical Systems
// Library: MUI X Charts | React | Node 22
// License: @mui/x-charts — MIT (community). Pro/Premium are out of scope.
// Quality: pending | Created: 2026-06-17

import { ChartContainer } from "@mui/x-charts/ChartContainer";
import { ScatterPlot } from "@mui/x-charts/ScatterChart";
import { ChartsXAxis } from "@mui/x-charts/ChartsXAxis";
import { ChartsYAxis } from "@mui/x-charts/ChartsYAxis";
import { useDrawingArea } from "@mui/x-charts/hooks";

const t = window.ANYPLOT_TOKENS;

// --- Data: logistic map  x(n+1) = r · x(n) · (1 − x(n)) -------------------
// Iterate deterministically from a fixed start, discard the transient, then
// record long-term orbit points. 1000 r-steps × 120 records = 120 k points —
// dense enough to meet the spec's 100 k+ target and fill the chaotic band.
const R_MIN = 2.5;
const R_MAX = 4.0;
const R_STEPS = 1000;   // parameter resolution along the x-axis
const TRANSIENT = 300;  // discarded initial iterations (settle onto attractor)
const RECORD = 120;     // states kept per r value (the steady-state orbit)
const X0 = 0.4;         // fixed seed (avoids the 0.5 trap at r=4)

const points: { x: number; y: number; id: number }[] = [];
let pid = 0;
for (let i = 0; i < R_STEPS; i++) {
  const r = R_MIN + ((R_MAX - R_MIN) * i) / (R_STEPS - 1);
  let x = X0;
  for (let n = 0; n < TRANSIENT; n++) x = r * x * (1 - x);
  for (let n = 0; n < RECORD; n++) {
    x = r * x * (1 - x);
    points.push({ x: r, y: x, id: pid++ });
  }
}

// Key period-doubling bifurcations (analytic values).
// Labels alternate left (anchor "end") / right (anchor "start") so the
// clustered r=3.544 and r=3.5699 references don't crowd on the same side.
// Two vertical levels spread each left/right pair apart vertically.
const MARKERS = [
  { r: 3.0,    text: "period-2", anchor: "end",   level: 0 },
  { r: 3.449,  text: "period-4", anchor: "end",   level: 1 },
  { r: 3.544,  text: "period-8", anchor: "start", level: 0 },
  { r: 3.5699, text: "chaos",    anchor: "start", level: 1 },
];
const LABEL_Y_OFFSETS = [18, 54];   // two distinct heights (px from top of drawing area)

const TITLE_H = 60;

// Overlay drawn in SVG space via the drawing-area hook. Linear axes map each
// r value to an exact x pixel coordinate without guessing scale factors.
function Bifurcations() {
  const { left, top, width, height } = useDrawingArea();
  const xOf = (r: number) => left + ((r - R_MIN) / (R_MAX - R_MIN)) * width;

  return (
    <g>
      {MARKERS.map((m) => {
        const x = xOf(m.r);
        const dx = m.anchor === "end" ? -8 : 8;
        const labelY = top + LABEL_Y_OFFSETS[m.level];
        return (
          <g key={m.r}>
            <line
              x1={x}
              y1={top}
              x2={x}
              y2={top + height}
              stroke={t.amber}
              strokeWidth={1.5}
              strokeDasharray="7 5"
              opacity={0.7}
            />
            <text
              x={x + dx}
              y={labelY}
              fill={t.inkSoft}
              textAnchor={m.anchor}
              style={{ fontSize: 13, fontFamily: "Inter, system-ui, sans-serif", fontWeight: 600 }}
            >
              {m.text}
            </text>
            <text
              x={x + dx}
              y={labelY + 16}
              fill={t.inkSoft}
              textAnchor={m.anchor}
              opacity={0.8}
              style={{ fontSize: 11, fontFamily: "Inter, system-ui, sans-serif" }}
            >
              r ≈ {m.r}
            </text>
          </g>
        );
      })}
    </g>
  );
}

export default function Chart() {
  const W = window.ANYPLOT_SIZE.width;
  const H = window.ANYPLOT_SIZE.height;

  return (
    <div
      style={{
        width: W,
        height: H,
        background: t.pageBg,
        fontFamily: "Inter, system-ui, sans-serif",
        display: "flex",
        flexDirection: "column",
      }}
    >
      <div
        style={{
          height: TITLE_H,
          display: "flex",
          alignItems: "center",
          justifyContent: "center",
        }}
      >
        <span style={{ fontSize: 22, fontWeight: 600, color: t.ink }}>
          bifurcation-basic · javascript · muix · anyplot.ai
        </span>
      </div>
      <ChartContainer
        width={W}
        height={H - TITLE_H}
        skipAnimation
        // Density via low-alpha brand green (Imprint palette position 1).
        colors={["rgba(0, 158, 115, 0.55)"]}
        margin={{ top: 16, bottom: 70, left: 86, right: 28 }}
        series={[
          {
            type: "scatter",
            data: points,
            markerSize: 1,
            label: "Steady-state orbit",
            disableHover: true,
          },
        ]}
        xAxis={[
          {
            min: R_MIN,
            max: R_MAX,
            label: "Growth rate  r",
            tickLabelStyle: { fontSize: 14 },
            labelStyle: { fontSize: 16 },
          },
        ]}
        yAxis={[
          {
            min: 0,
            max: 1,
            label: "Steady-state population  x",
            tickNumber: 11,
            tickLabelStyle: { fontSize: 14 },
            labelStyle: { fontSize: 16 },
          },
        ]}
        sx={{
          "& .MuiChartsLegend-root": { display: "none" },
          "& .MuiChartsAxis-line": { stroke: t.inkSoft },
          "& .MuiChartsAxis-tick": { stroke: t.inkSoft },
        }}
      >
        <ScatterPlot />
        <ChartsXAxis />
        <ChartsYAxis />
        <Bifurcations />
      </ChartContainer>
    </div>
  );
}
Runnable source as JSON, for any HTTP client: https://api.anyplot.ai/specs/bifurcation-basic/muix/code. Any spec id and library id listed in llms-full.txt fit the same URL shape; every URL below is complete and callable.
{
  "spec_id": "bifurcation-basic",
  "language": "javascript",
  "library": "muix",
  "page": "https://anyplot.ai/bifurcation-basic/javascript/muix",
  "hub": "https://anyplot.ai/bifurcation-basic",
  "code_json": "https://api.anyplot.ai/specs/bifurcation-basic/muix/code",
  "spec_json": "https://api.anyplot.ai/specs/bifurcation-basic",
  "render_light_png": "https://storage.googleapis.com/anyplot-images/plots/bifurcation-basic/javascript/muix/plot-light.png",
  "render_dark_png": "https://storage.googleapis.com/anyplot-images/plots/bifurcation-basic/javascript/muix/plot-dark.png",
  "interactive_light_html": "https://storage.googleapis.com/anyplot-images/plots/bifurcation-basic/javascript/muix/plot-light.html",
  "interactive_dark_html": "https://storage.googleapis.com/anyplot-images/plots/bifurcation-basic/javascript/muix/plot-dark.html",
  "quality_score": 91.0,
  "license": "MIT",
  "guide": "https://anyplot.ai/llms.txt"
}
Part of Bifurcation Diagram for Dynamical Systems on anyplot.ai.