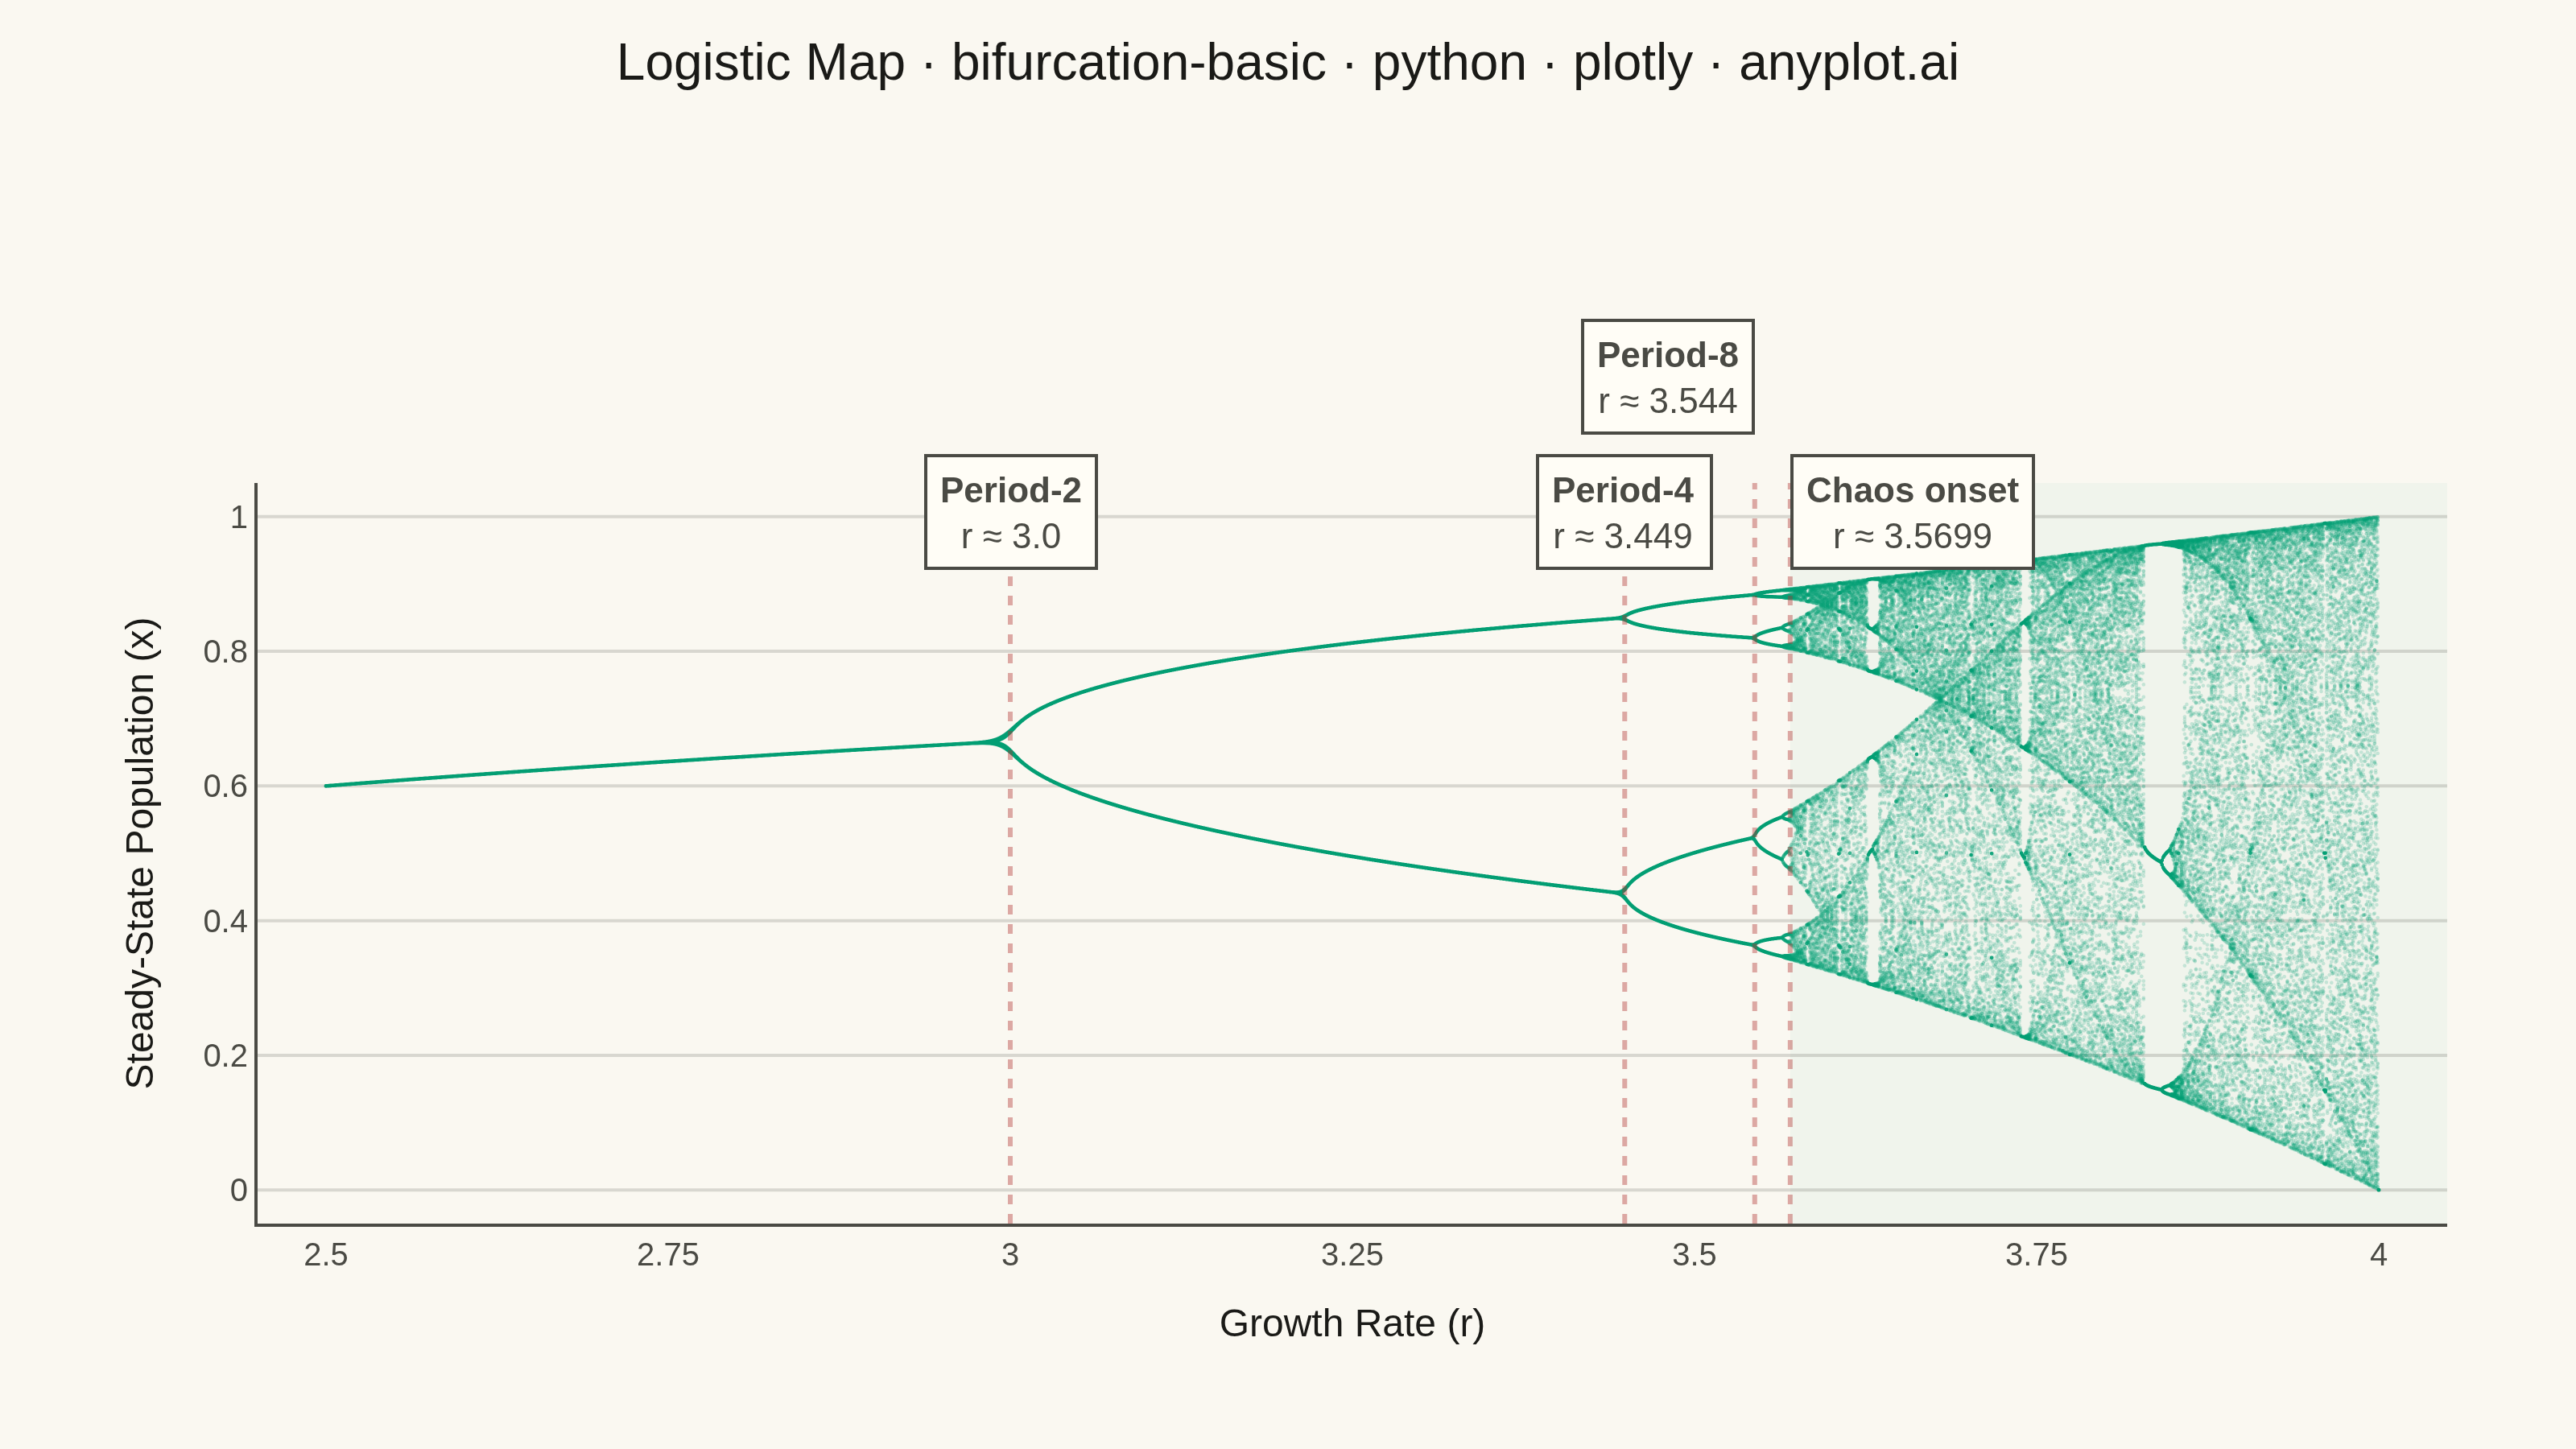
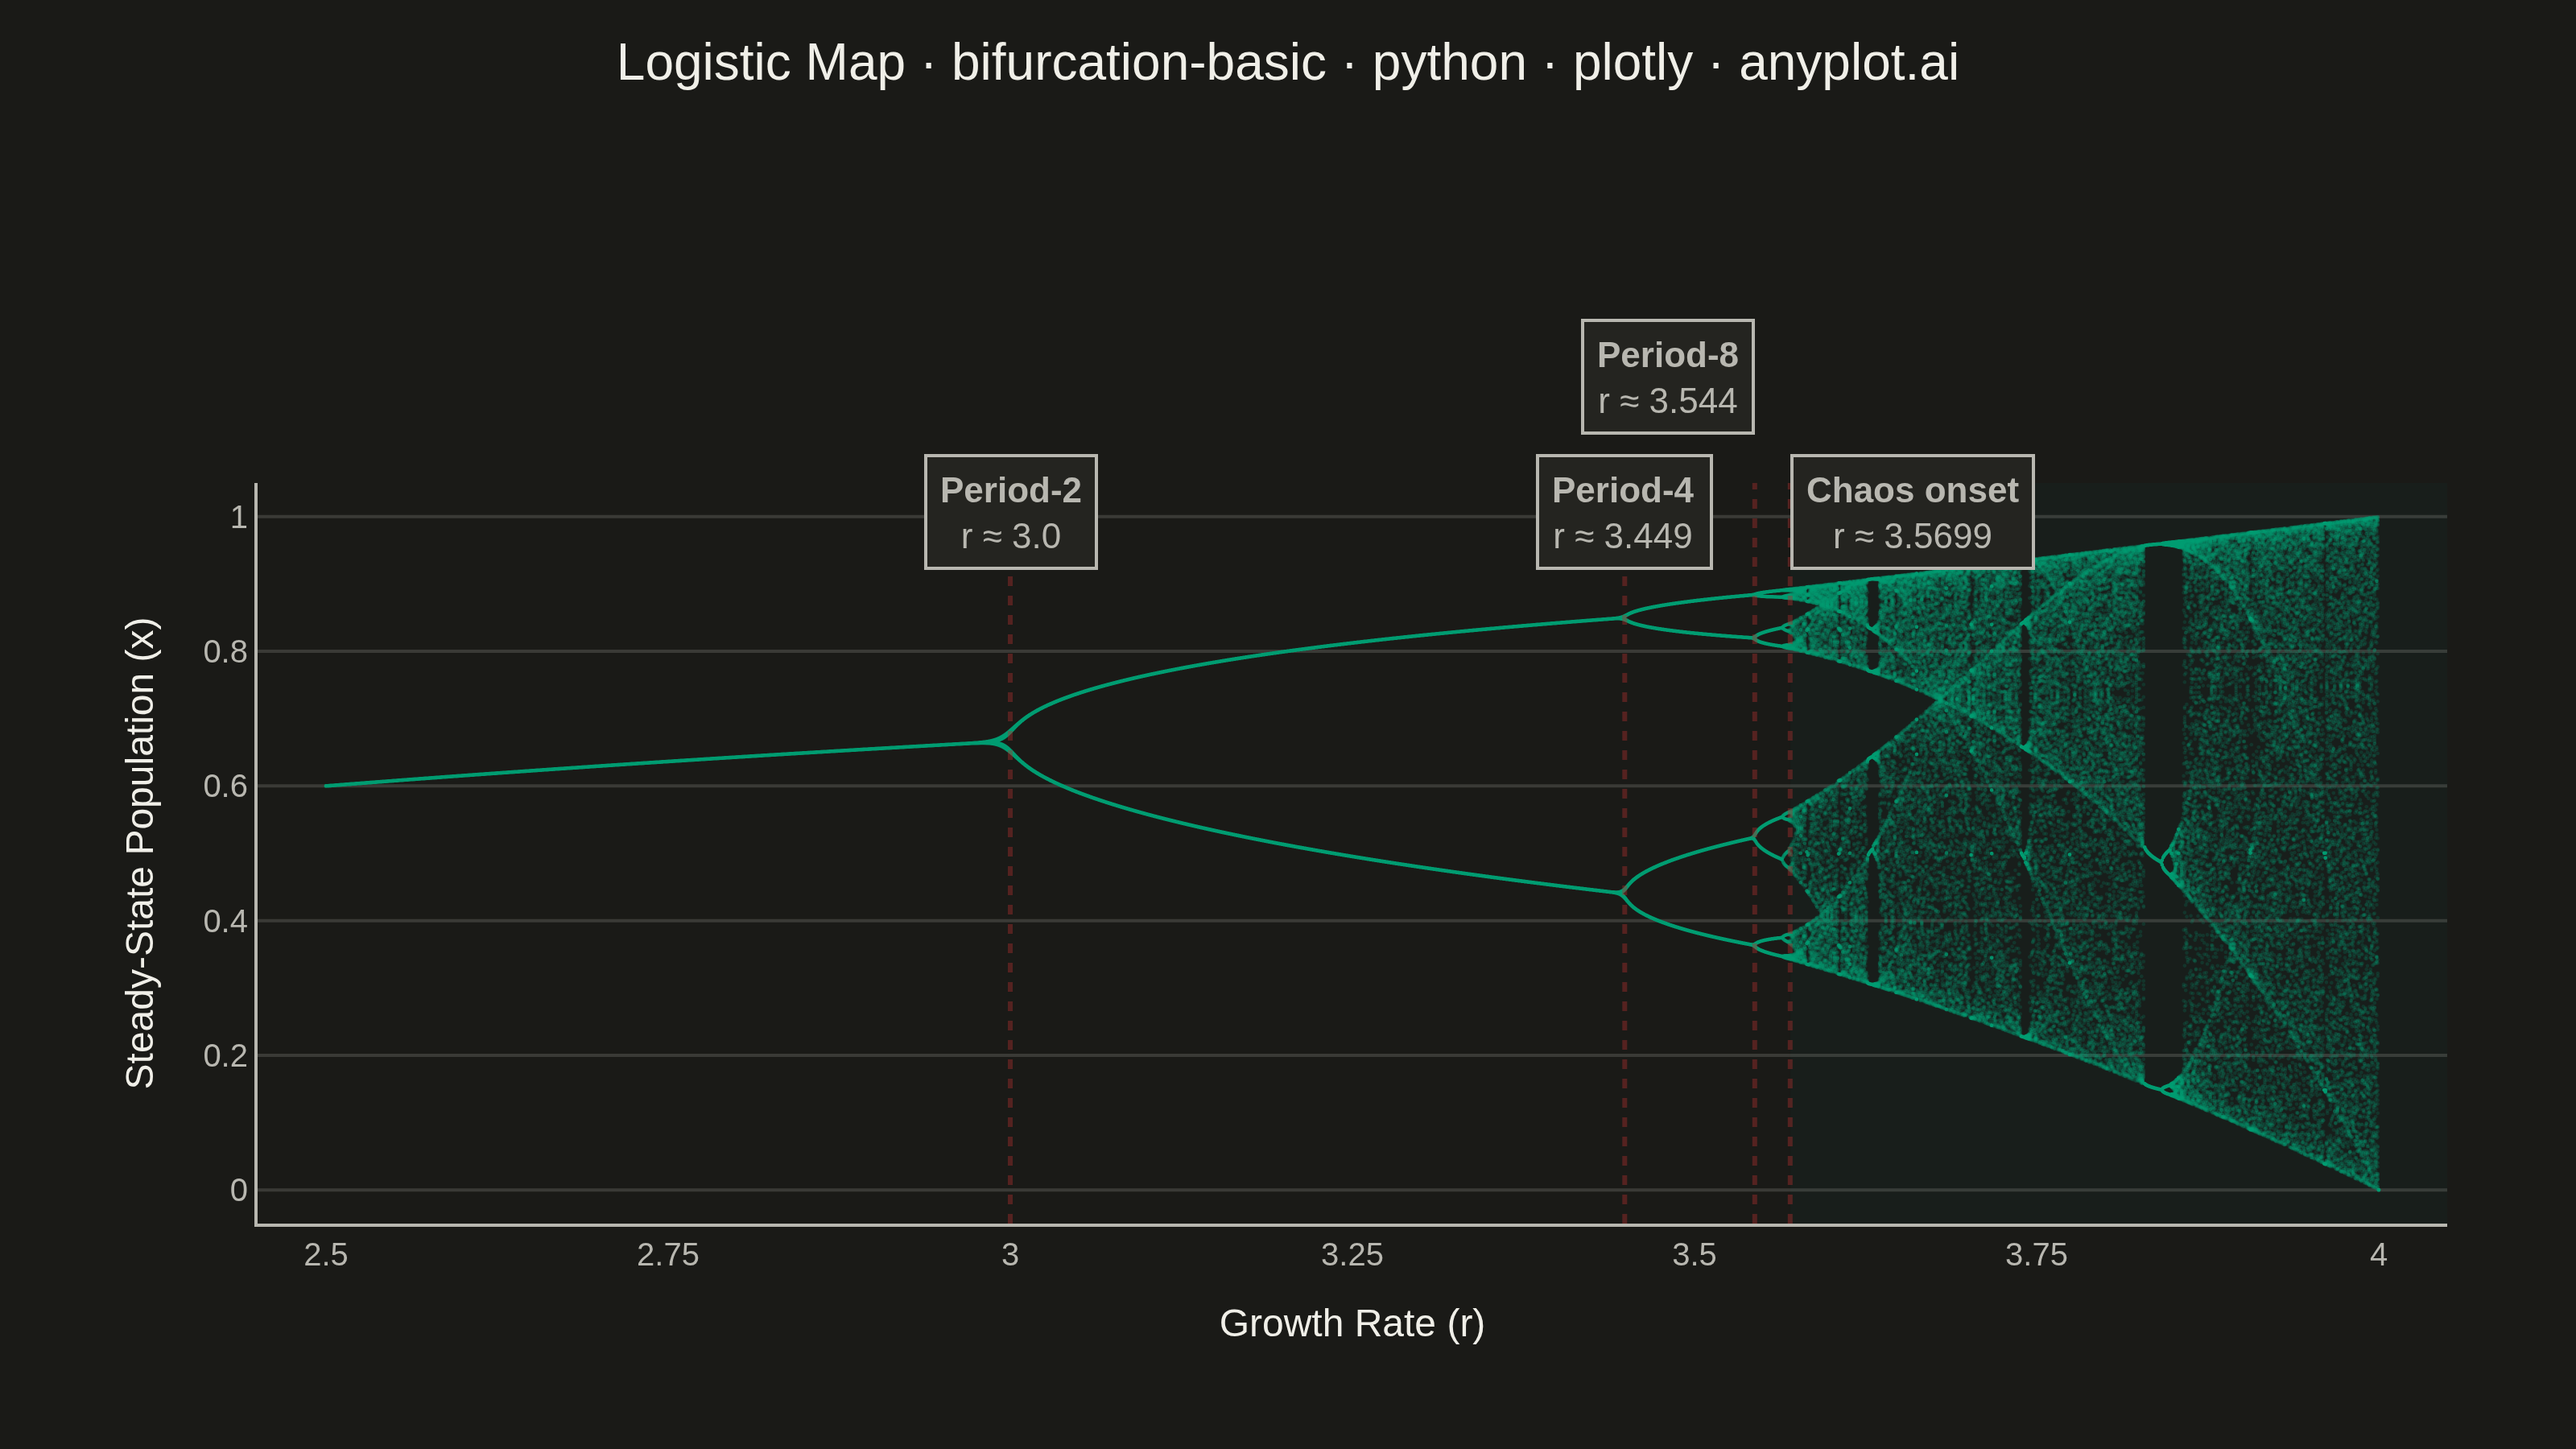
A bifurcation diagram shows how the steady-state behavior of a dynamical system changes as a control parameter varies. By plotting the long-term values of a state variable against a continuously varied parameter, it reveals transitions from stable fixed points through period-doubling cascades to chaotic regimes. The classic example is the logistic map, where the route to chaos is clearly visible as the growth rate parameter increases.
""" anyplot.ai
bifurcation-basic: Bifurcation Diagram for Dynamical Systems
Library: plotly 6.8.0 | Python 3.13.13
Quality: 89/100 | Updated: 2026-06-17
"""

import os

import numpy as np
import plotly.graph_objects as go


# Theme tokens (Imprint palette + adaptive chrome)
THEME = os.getenv("ANYPLOT_THEME", "light")
PAGE_BG = "#FAF8F1" if THEME == "light" else "#1A1A17"
ELEVATED_BG = "#FFFDF6" if THEME == "light" else "#242420"
INK = "#1A1A17" if THEME == "light" else "#F0EFE8"
INK_SOFT = "#4A4A44" if THEME == "light" else "#B8B7B0"
GRID = "rgba(26,26,23,0.15)" if THEME == "light" else "rgba(240,239,232,0.15)"
BRAND = "#009E73"  # Imprint palette position 1 — always first series

# Data: Logistic map x(n+1) = r * x(n) * (1 - x(n))
r_values = np.linspace(2.5, 4.0, 2000)
transient = 200
iterations = 100

r_all = []
x_all = []

for r in r_values:
    x = 0.5
    for _ in range(transient):
        x = r * x * (1.0 - x)
    for _ in range(iterations):
        x = r * x * (1.0 - x)
        r_all.append(r)
        x_all.append(x)

r_all = np.array(r_all)
x_all = np.array(x_all)

# Plot
fig = go.Figure()

fig.add_trace(
    go.Scattergl(
        x=r_all,
        y=x_all,
        mode="markers",
        marker={"size": 1, "color": BRAND, "opacity": 0.18},
        showlegend=False,
        hovertemplate="r = %{x:.4f}<br>x = %{y:.4f}<extra></extra>",
    )
)

# Subtle shading to emphasise the chaotic regime (r > 3.5699)
fig.add_shape(
    type="rect", x0=3.5699, x1=4.05, y0=-0.05, y1=1.05, fillcolor=BRAND, opacity=0.04, line={"width": 0}, layer="below"
)

# Key bifurcation points — vertical reference lines + annotations
# Period-4 and Period-8 are only 0.095 r-units apart, so they're staggered
# vertically to avoid overlap at 3200×1800.
bifurcation_points = [
    (3.0, "Period-2", "center", 1.04),
    (3.449, "Period-4", "center", 1.04),
    (3.544, "Period-8", "right", 1.22),
    (3.5699, "Chaos onset", "left", 1.04),
]

annotations = []
vline_color = "rgba(174,48,48,0.40)"  # Imprint matte red, subdued

for r_bif, label, xanchor, y_pos in bifurcation_points:
    fig.add_vline(x=r_bif, line={"color": vline_color, "width": 1.5, "dash": "dot"})
    annotations.append(
        {
            "x": r_bif,
            "y": y_pos,
            "yref": "paper",
            "text": f"<b>{label}</b><br>r ≈ {r_bif}",
            "showarrow": False,
            "font": {"size": 11, "color": INK_SOFT, "family": "Arial, sans-serif"},
            "bgcolor": ELEVATED_BG,
            "bordercolor": INK_SOFT,
            "borderpad": 4,
            "xanchor": xanchor,
        }
    )

# Title — scale fontsize if longer than 67-char baseline
title = "Logistic Map · bifurcation-basic · python · plotly · anyplot.ai"
n = len(title)
ratio = 67 / n if n > 67 else 1.0
title_fontsize = max(11, round(16 * ratio))

# Style
fig.update_layout(
    autosize=False,
    title={
        "text": title,
        "font": {"size": title_fontsize, "color": INK, "family": "Arial, sans-serif"},
        "x": 0.5,
        "xanchor": "center",
        "y": 0.97,
    },
    xaxis={
        "title": {"text": "Growth Rate (r)", "font": {"size": 12, "color": INK}, "standoff": 12},
        "tickfont": {"size": 10, "color": INK_SOFT},
        "showgrid": False,
        "showline": True,
        "mirror": False,
        "range": [2.45, 4.05],
        "zeroline": False,
        "dtick": 0.25,
        "linecolor": INK_SOFT,
    },
    yaxis={
        "title": {"text": "Steady-State Population (x)", "font": {"size": 12, "color": INK}, "standoff": 12},
        "tickfont": {"size": 10, "color": INK_SOFT},
        "showgrid": True,
        "showline": True,
        "mirror": False,
        "gridwidth": 1,
        "gridcolor": GRID,
        "range": [-0.05, 1.05],
        "zeroline": False,
        "linecolor": INK_SOFT,
    },
    paper_bgcolor=PAGE_BG,
    plot_bgcolor=PAGE_BG,
    font={"color": INK},
    showlegend=False,
    margin={"l": 80, "r": 40, "t": 150, "b": 70},
    annotations=annotations,
    hoverlabel={"bgcolor": ELEVATED_BG, "font_size": 12, "font_color": INK},
)

# Save
fig.write_image(f"plot-{THEME}.png", width=800, height=450, scale=4)
fig.write_html(f"plot-{THEME}.html", include_plotlyjs="cdn")
Runnable source as JSON, for any HTTP client: https://api.anyplot.ai/specs/bifurcation-basic/plotly/code. Any spec id and library id listed in llms-full.txt fit the same URL shape; every URL below is complete and callable.
{
  "spec_id": "bifurcation-basic",
  "language": "python",
  "library": "plotly",
  "page": "https://anyplot.ai/bifurcation-basic/python/plotly",
  "hub": "https://anyplot.ai/bifurcation-basic",
  "code_json": "https://api.anyplot.ai/specs/bifurcation-basic/plotly/code",
  "spec_json": "https://api.anyplot.ai/specs/bifurcation-basic",
  "render_light_png": "https://storage.googleapis.com/anyplot-images/plots/bifurcation-basic/python/plotly/plot-light.png",
  "render_dark_png": "https://storage.googleapis.com/anyplot-images/plots/bifurcation-basic/python/plotly/plot-dark.png",
  "interactive_light_html": "https://storage.googleapis.com/anyplot-images/plots/bifurcation-basic/python/plotly/plot-light.html",
  "interactive_dark_html": "https://storage.googleapis.com/anyplot-images/plots/bifurcation-basic/python/plotly/plot-dark.html",
  "quality_score": 89.0,
  "license": "MIT",
  "guide": "https://anyplot.ai/llms.txt"
}
Part of Bifurcation Diagram for Dynamical Systems on anyplot.ai.