The same plot in 14 other libraries — JavaScript: D3.js, Apache ECharts, Highcharts, MUI X Charts; Python: Altair, Bokeh, lets-plot, Matplotlib, Plotly, plotnine, Pygal, Seaborn; R: ggplot2; Julia: Makie.jl. Compare all 15 side by side: Notched Box Plot in Python, R, Julia and JavaScript.
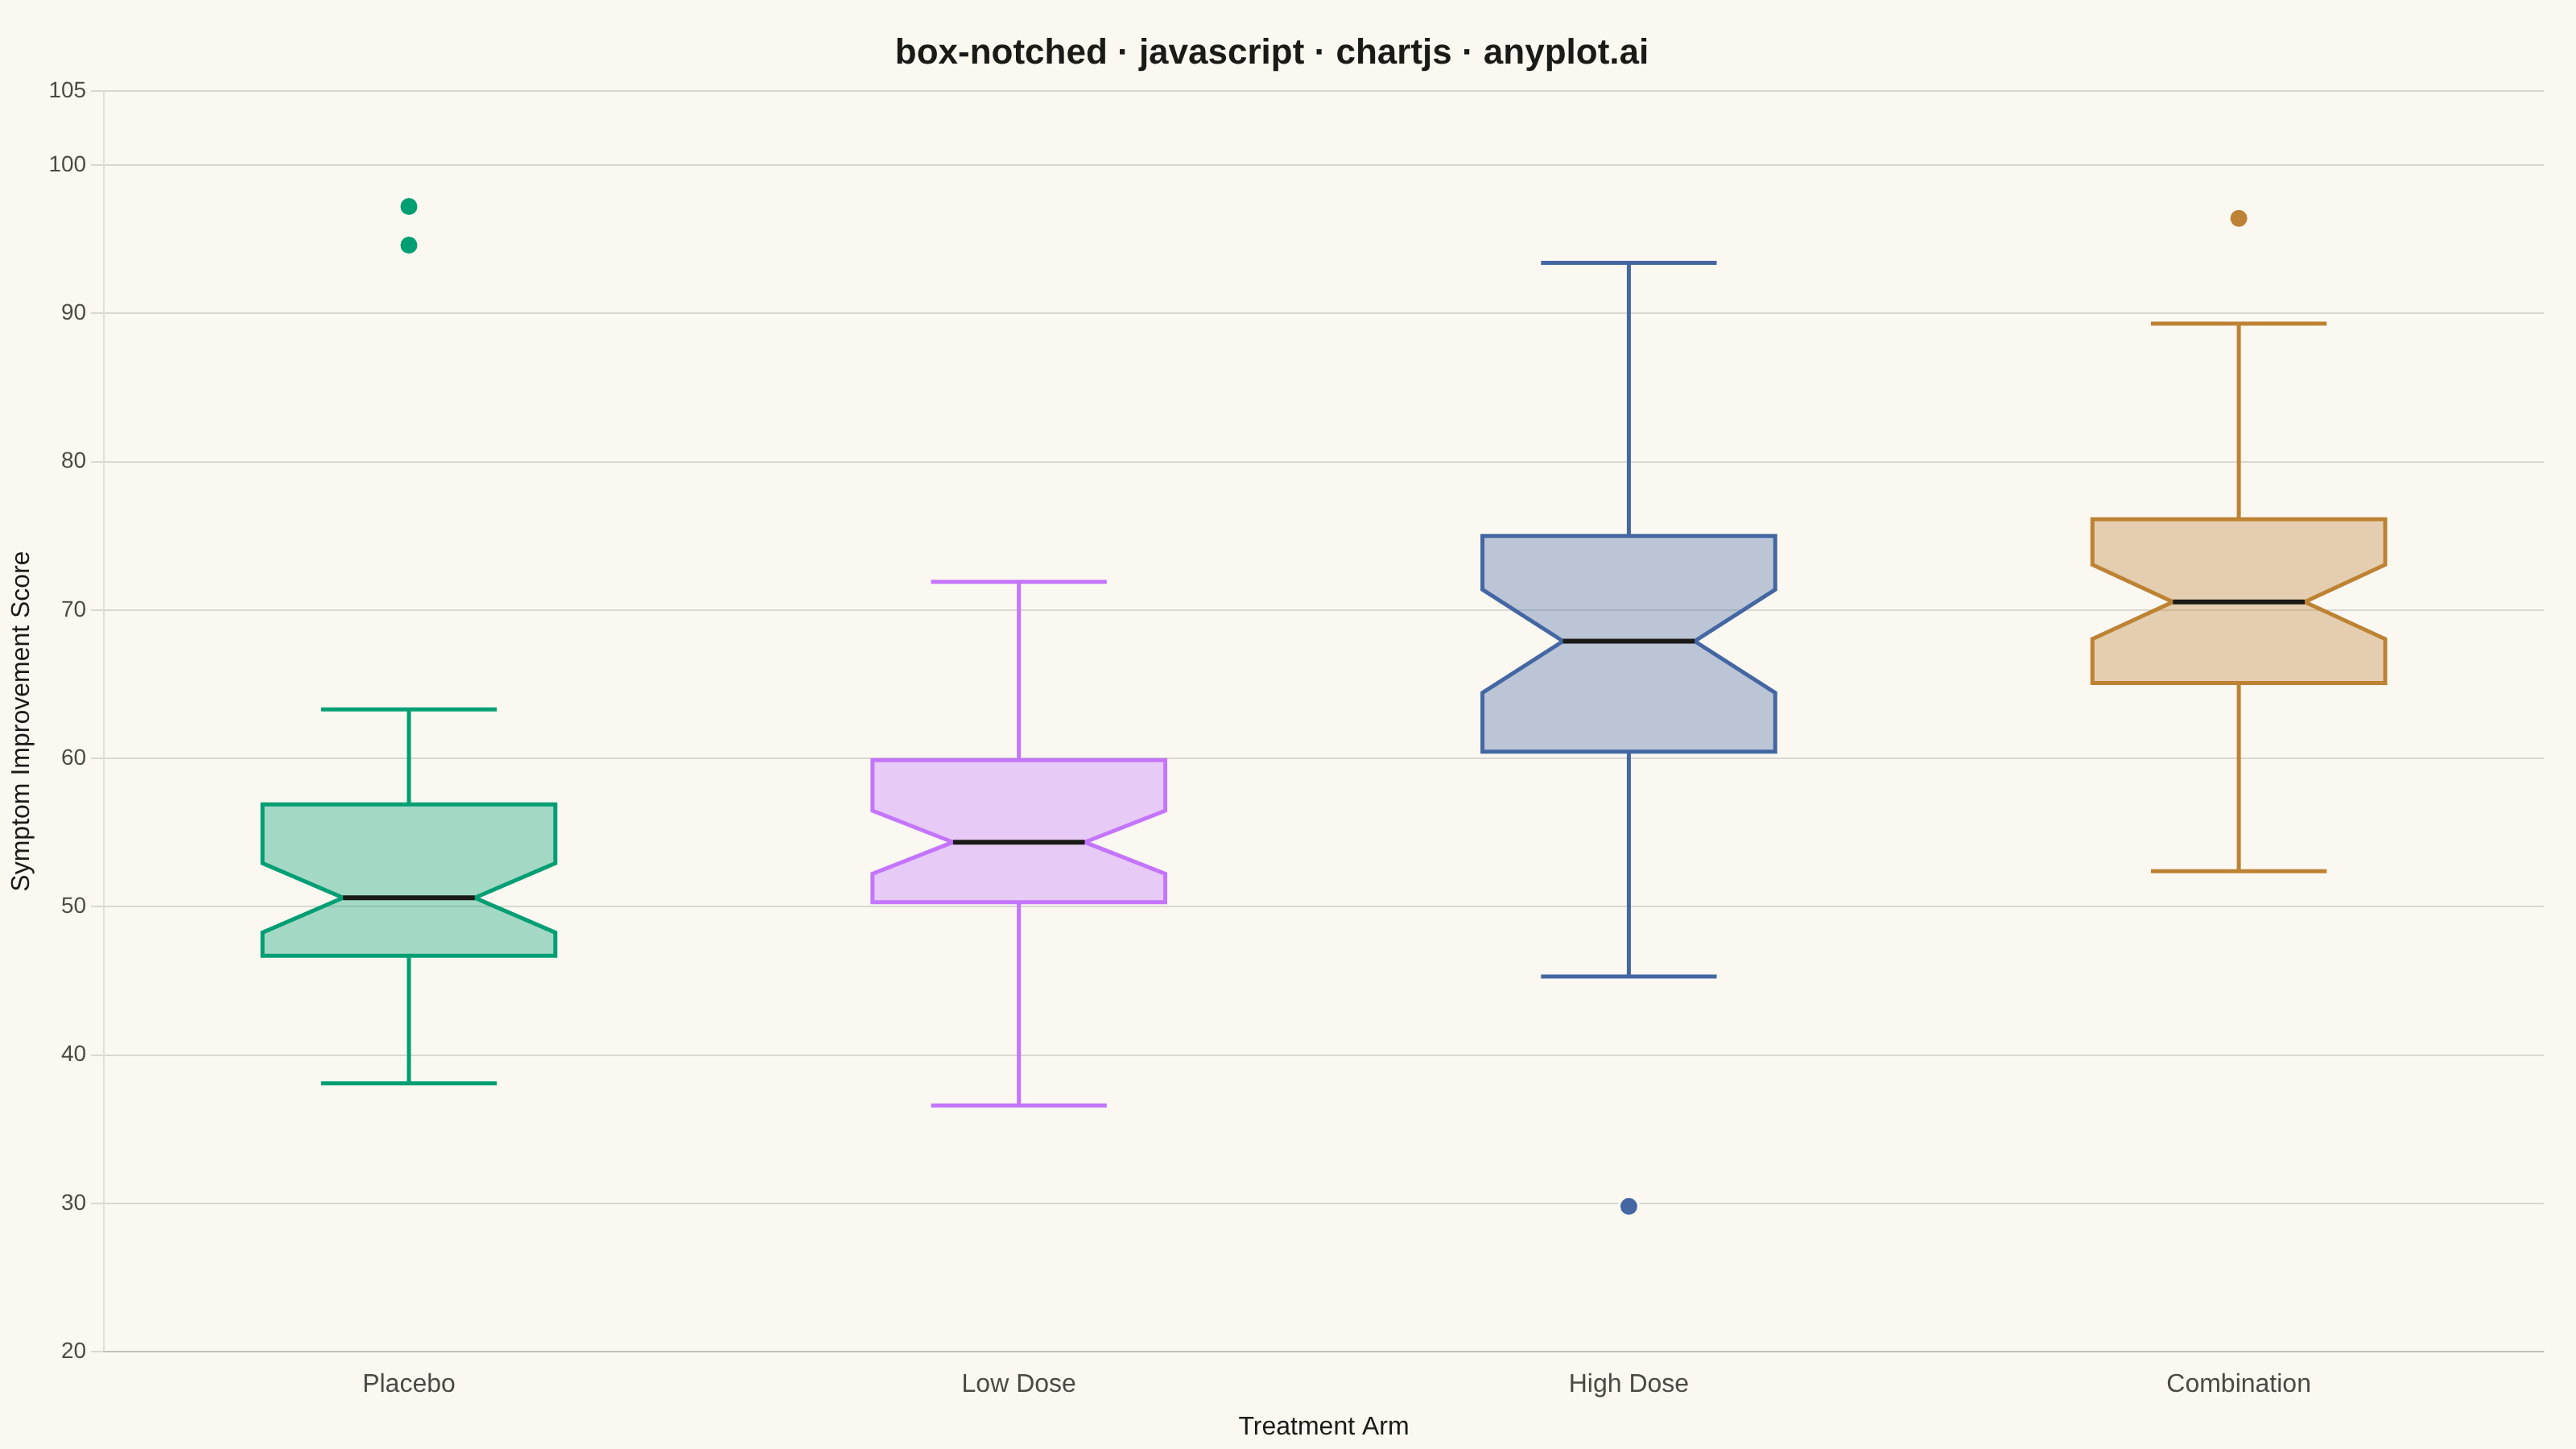
A notched box plot extends the standard box plot by adding notches around the median that represent a confidence interval. If the notches of two boxes do not overlap, this provides visual evidence that the medians differ significantly. This variant is particularly valuable for quick visual hypothesis testing and comparing group medians in statistical analysis.
// anyplot.ai
// box-notched: Notched Box Plot
// Library: chartjs 4.4.7 | JavaScript 22.23.2
// Quality: 91/100 | Created: 2026-08-18

const t = window.ANYPLOT_TOKENS;

// --- Deterministic PRNG (LCG + Box-Muller, no seeded Math.random in browser) ---
const lcgState = { s: 20260818 >>> 0 };
function rand() {
  lcgState.s = (lcgState.s * 1664525 + 1013904223) >>> 0;
  return lcgState.s / 4294967296;
}
function randNormal() {
  const u1 = Math.max(rand(), 1e-9);
  const u2 = rand();
  return Math.sqrt(-2 * Math.log(u1)) * Math.cos(2 * Math.PI * u2);
}

// --- Data: symptom improvement score across a clinical trial's dose arms ------
const groups = [
  { name: "Placebo", n: 45, mean: 50, sd: 8 },
  { name: "Low Dose", n: 50, mean: 54, sd: 8 },
  { name: "High Dose", n: 42, mean: 68, sd: 9 },
  { name: "Combination", n: 48, mean: 71, sd: 9 },
];

function quantile(sorted, q) {
  const pos = (sorted.length - 1) * q;
  const lo = Math.floor(pos);
  const hi = Math.ceil(pos);
  if (lo === hi) return sorted[lo];
  return sorted[lo] + (sorted[hi] - sorted[lo]) * (pos - lo);
}

groups.forEach((g) => {
  const values = Array.from(
    { length: g.n },
    () => Math.round((g.mean + randNormal() * g.sd) * 10) / 10,
  );
  g.values = values;
});
// Inject a few genuine outliers so the "beyond whiskers" rule has something to show.
groups[0].values.push(94.6, 97.2);
groups[2].values.push(29.8);

groups.forEach((g) => {
  const sorted = [...g.values].sort((a, b) => a - b);
  const n = sorted.length;
  const q1 = quantile(sorted, 0.25);
  const median = quantile(sorted, 0.5);
  const q3 = quantile(sorted, 0.75);
  const iqr = q3 - q1;
  const loBound = q1 - 1.5 * iqr;
  const hiBound = q3 + 1.5 * iqr;
  const inRange = sorted.filter((v) => v >= loBound && v <= hiBound);
  const whiskerLo = inRange.length ? inRange[0] : q1;
  const whiskerHi = inRange.length ? inRange[inRange.length - 1] : q3;
  const outliers = sorted.filter((v) => v < whiskerLo || v > whiskerHi);
  const notchHalf = (1.57 * iqr) / Math.sqrt(n);

  g.stats = {
    n,
    q1,
    median,
    q3,
    whiskerLo,
    whiskerHi,
    outliers,
    notchTop: Math.min(median + notchHalf, q3),
    notchBottom: Math.max(median - notchHalf, q1),
  };
});

const allValues = groups.flatMap((g) => [
  g.stats.whiskerLo,
  g.stats.whiskerHi,
  ...g.stats.outliers,
]);
const dataMin = Math.min(...allValues);
const dataMax = Math.max(...allValues);
const dataPad = (dataMax - dataMin) * 0.1;
const axisMin = Math.floor((dataMin - dataPad) / 5) * 5;
const axisMax = Math.ceil((dataMax + dataPad) / 5) * 5;

// --- Mount -------------------------------------------------------------------
const canvas = document.createElement("canvas");
document.getElementById("container").appendChild(canvas);

// --- Custom notched-box renderer ----------------------------------------------
// Chart.js has no built-in box-plot type; the box + notch + whisker geometry is
// drawn by hand with the canvas API inside a plugin hook, using the bar chart's
// own category/linear scales for coordinate conversion. No external chart type
// or plugin package is involved — this is core Chart.js's public plugin API.
function hexToRgba(hex, alpha) {
  const r = parseInt(hex.slice(1, 3), 16);
  const g = parseInt(hex.slice(3, 5), 16);
  const b = parseInt(hex.slice(5, 7), 16);
  return `rgba(${r}, ${g}, ${b}, ${alpha})`;
}

const notchedBoxPlugin = {
  id: "notchedBox",
  afterDatasetsDraw(chart) {
    const { ctx, scales } = chart;
    const xScale = scales.x;
    const yScale = scales.y;
    const bandWidth =
      groups.length > 1
        ? xScale.getPixelForValue(1) - xScale.getPixelForValue(0)
        : chart.chartArea.width;
    const halfWidth = bandWidth * 0.24;
    const innerHalfWidth = halfWidth * 0.45;

    groups.forEach((g, i) => {
      const s = g.stats;
      const color = t.palette[i % t.palette.length];
      const cx = xScale.getPixelForValue(i);
      const yQ1 = yScale.getPixelForValue(s.q1);
      const yQ3 = yScale.getPixelForValue(s.q3);
      const yMed = yScale.getPixelForValue(s.median);
      const yNotchTop = yScale.getPixelForValue(s.notchTop);
      const yNotchBottom = yScale.getPixelForValue(s.notchBottom);
      const yWhiskerLo = yScale.getPixelForValue(s.whiskerLo);
      const yWhiskerHi = yScale.getPixelForValue(s.whiskerHi);

      // Whiskers
      ctx.save();
      ctx.strokeStyle = color;
      ctx.lineWidth = 2.5;
      ctx.beginPath();
      ctx.moveTo(cx, yQ3);
      ctx.lineTo(cx, yWhiskerHi);
      ctx.moveTo(cx - halfWidth * 0.6, yWhiskerHi);
      ctx.lineTo(cx + halfWidth * 0.6, yWhiskerHi);
      ctx.moveTo(cx, yQ1);
      ctx.lineTo(cx, yWhiskerLo);
      ctx.moveTo(cx - halfWidth * 0.6, yWhiskerLo);
      ctx.lineTo(cx + halfWidth * 0.6, yWhiskerLo);
      ctx.stroke();

      // Notched box (hourglass taper toward the median CI)
      ctx.beginPath();
      ctx.moveTo(cx - halfWidth, yQ3);
      ctx.lineTo(cx + halfWidth, yQ3);
      ctx.lineTo(cx + halfWidth, yNotchTop);
      ctx.lineTo(cx + innerHalfWidth, yMed);
      ctx.lineTo(cx + halfWidth, yNotchBottom);
      ctx.lineTo(cx + halfWidth, yQ1);
      ctx.lineTo(cx - halfWidth, yQ1);
      ctx.lineTo(cx - halfWidth, yNotchBottom);
      ctx.lineTo(cx - innerHalfWidth, yMed);
      ctx.lineTo(cx - halfWidth, yNotchTop);
      ctx.closePath();
      ctx.fillStyle = hexToRgba(color, 0.35);
      ctx.fill();
      ctx.stroke();

      // Median line, spanning the notch's pinched width
      ctx.strokeStyle = t.ink;
      ctx.lineWidth = 3;
      ctx.beginPath();
      ctx.moveTo(cx - innerHalfWidth, yMed);
      ctx.lineTo(cx + innerHalfWidth, yMed);
      ctx.stroke();
      ctx.restore();

      // Outliers
      ctx.save();
      ctx.fillStyle = color;
      ctx.strokeStyle = t.pageBg;
      ctx.lineWidth = 1.5;
      s.outliers.forEach((v) => {
        const cy = yScale.getPixelForValue(v);
        ctx.beginPath();
        ctx.arc(cx, cy, 6, 0, 2 * Math.PI);
        ctx.fill();
        ctx.stroke();
      });
      ctx.restore();
    });
  },
};

// --- Chart ---------------------------------------------------------------------
new Chart(canvas, {
  type: "bar",
  data: {
    labels: groups.map((g) => g.name),
    datasets: [
      {
        label: "Symptom Improvement Score",
        data: groups.map(() => null),
        backgroundColor: "transparent",
        borderWidth: 0,
      },
    ],
  },
  options: {
    responsive: true,
    maintainAspectRatio: false,
    animation: false,
    layout: { padding: { top: 10, right: 20, bottom: 0, left: 0 } },
    plugins: {
      title: {
        display: true,
        text: "box-notched · javascript · chartjs · anyplot.ai",
        color: t.ink,
        font: { size: 22 },
      },
      legend: { display: false },
      tooltip: { enabled: false },
    },
    scales: {
      x: {
        ticks: { color: t.inkSoft, font: { size: 16 } },
        grid: { display: false },
        title: {
          display: true,
          text: "Treatment Arm",
          color: t.ink,
          font: { size: 16 },
        },
      },
      y: {
        min: axisMin,
        max: axisMax,
        ticks: { color: t.inkSoft, font: { size: 14 } },
        grid: { color: t.grid },
        title: {
          display: true,
          text: "Symptom Improvement Score",
          color: t.ink,
          font: { size: 16 },
        },
      },
    },
  },
  plugins: [notchedBoxPlugin],
});
Runnable source as JSON, for any HTTP client: https://api.anyplot.ai/specs/box-notched/chartjs/code. Any spec id and library id listed in llms-full.txt fit the same URL shape; every URL below is complete and callable.
{
  "spec_id": "box-notched",
  "language": "javascript",
  "library": "chartjs",
  "page": "https://anyplot.ai/box-notched/javascript/chartjs",
  "hub": "https://anyplot.ai/box-notched",
  "code_json": "https://api.anyplot.ai/specs/box-notched/chartjs/code",
  "spec_json": "https://api.anyplot.ai/specs/box-notched",
  "render_light_png": "https://storage.googleapis.com/anyplot-images/plots/box-notched/javascript/chartjs/plot-light.png",
  "render_dark_png": "https://storage.googleapis.com/anyplot-images/plots/box-notched/javascript/chartjs/plot-dark.png",
  "interactive_light_html": "https://storage.googleapis.com/anyplot-images/plots/box-notched/javascript/chartjs/plot-light.html",
  "interactive_dark_html": "https://storage.googleapis.com/anyplot-images/plots/box-notched/javascript/chartjs/plot-dark.html",
  "quality_score": 91.0,
  "license": "MIT",
  "guide": "https://anyplot.ai/llms.txt"
}
Part of Notched Box Plot on anyplot.ai.