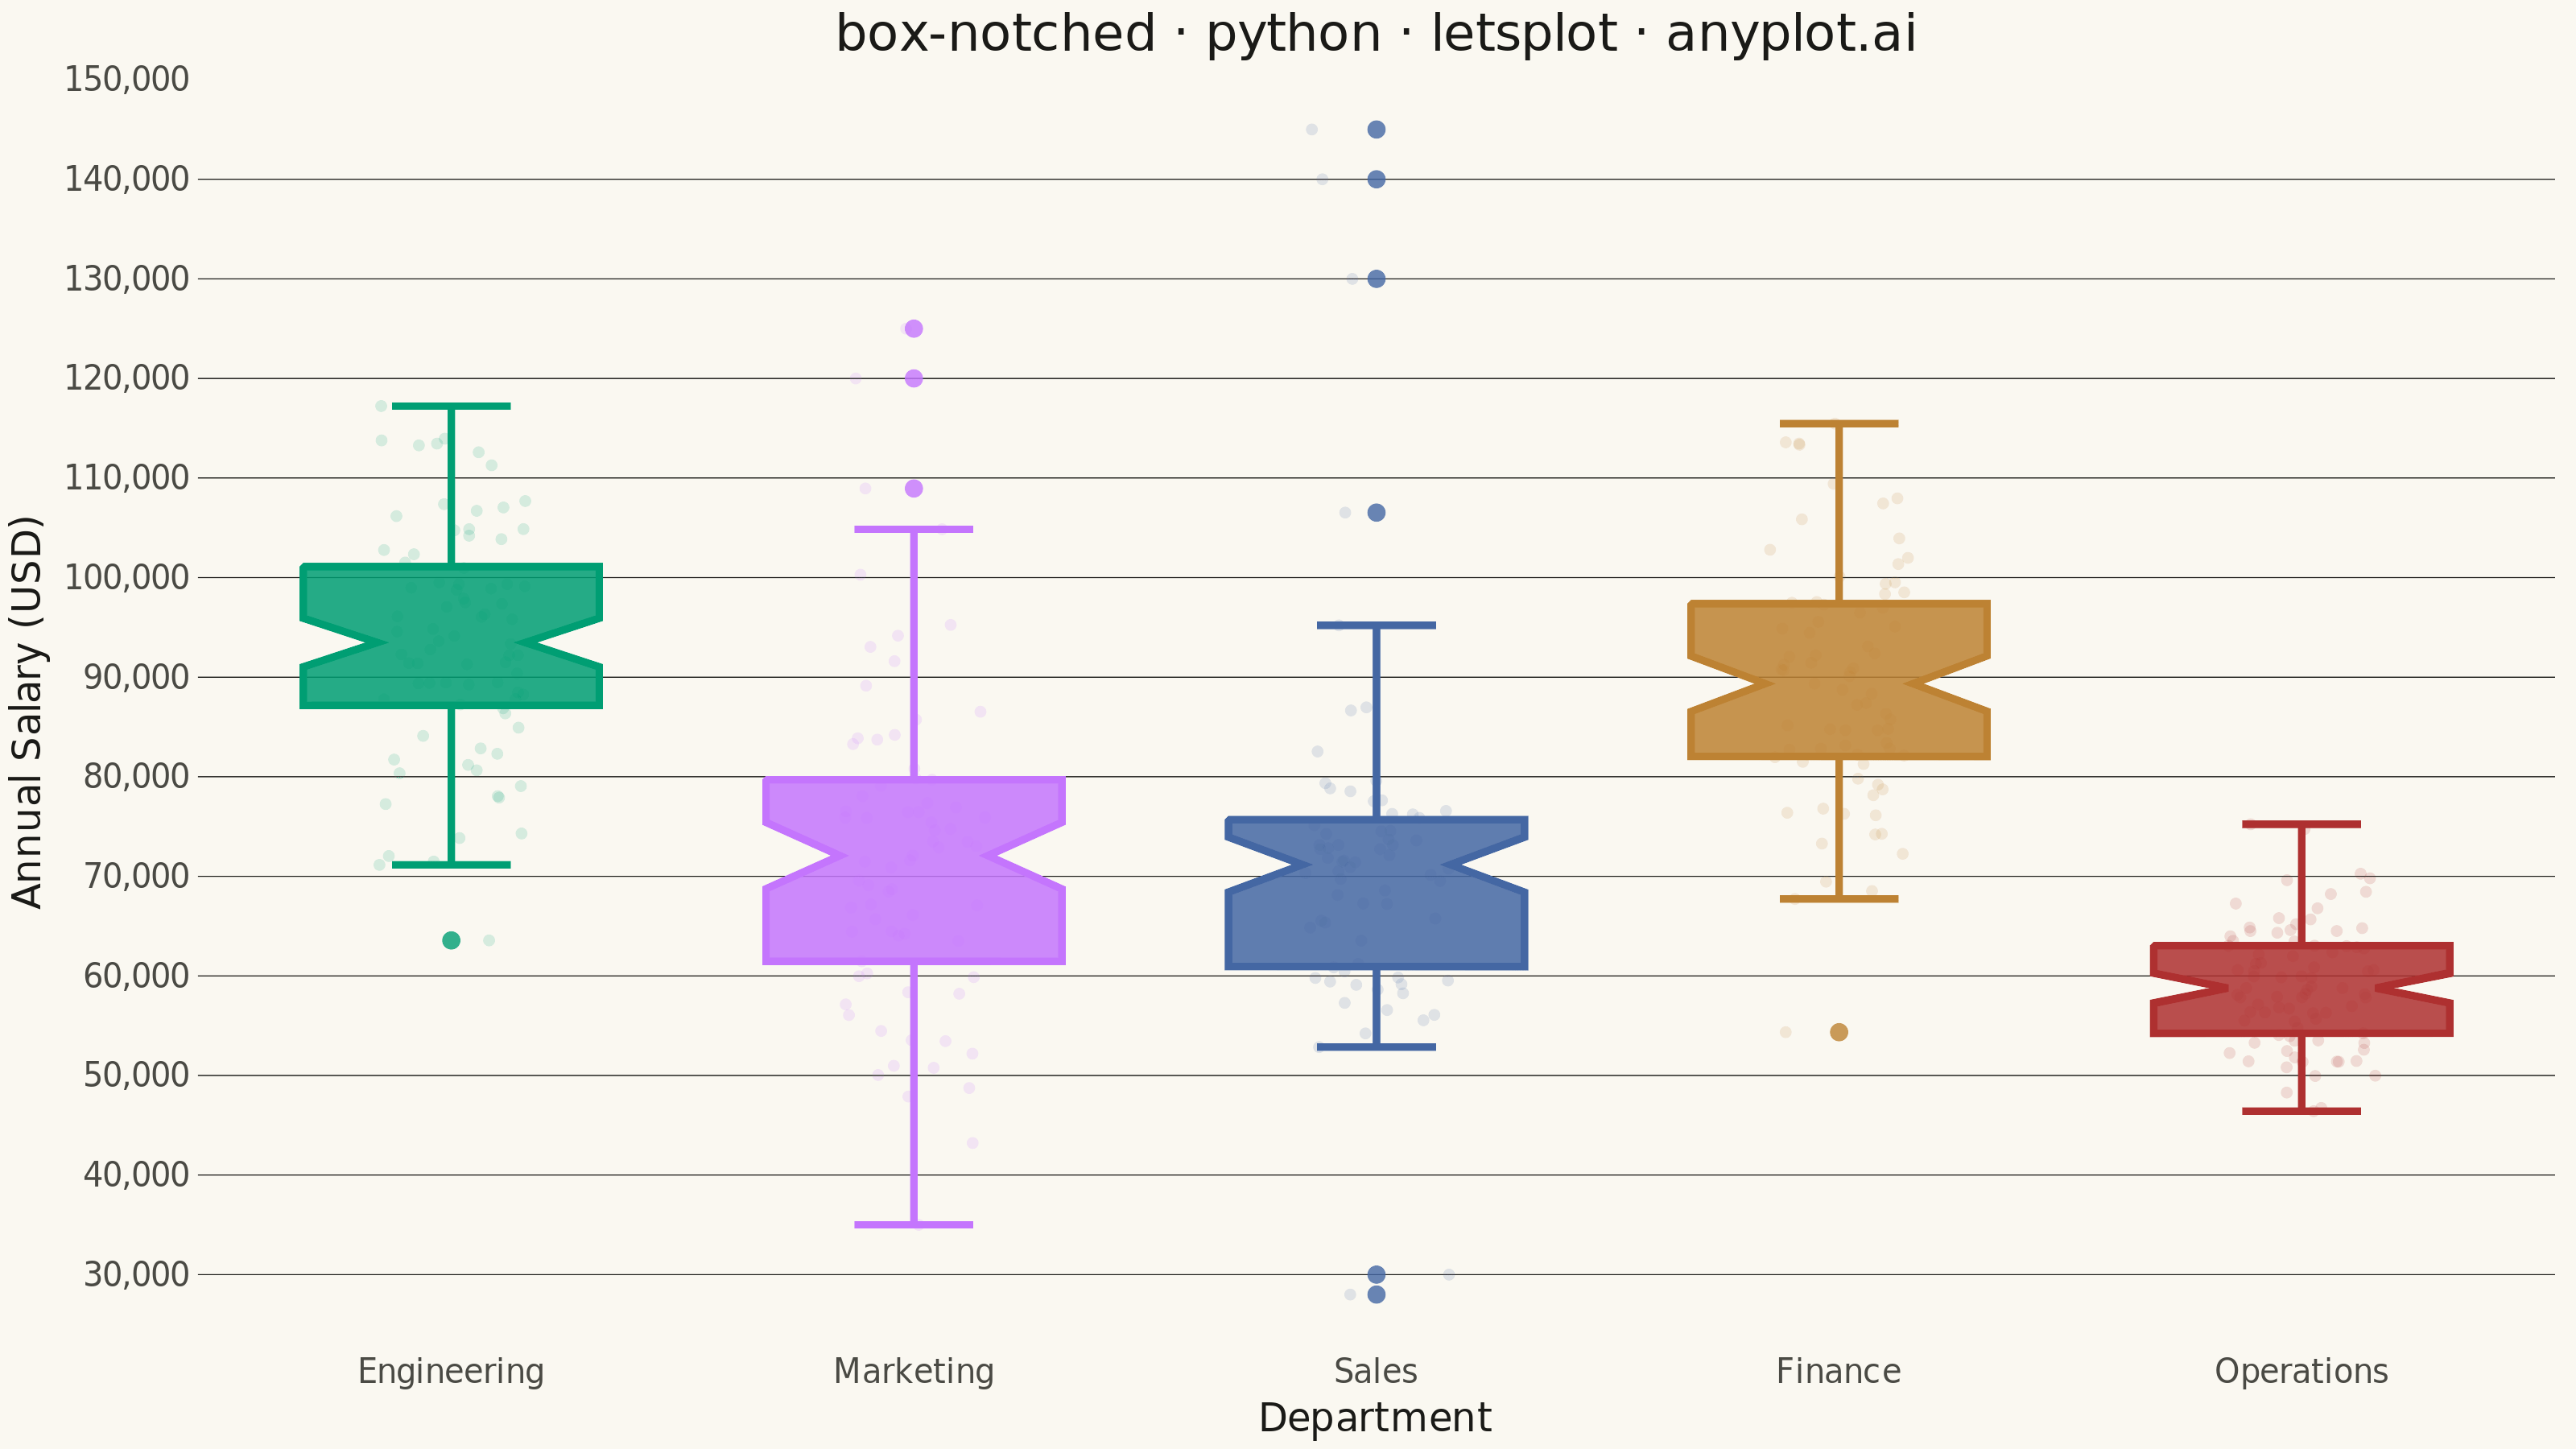
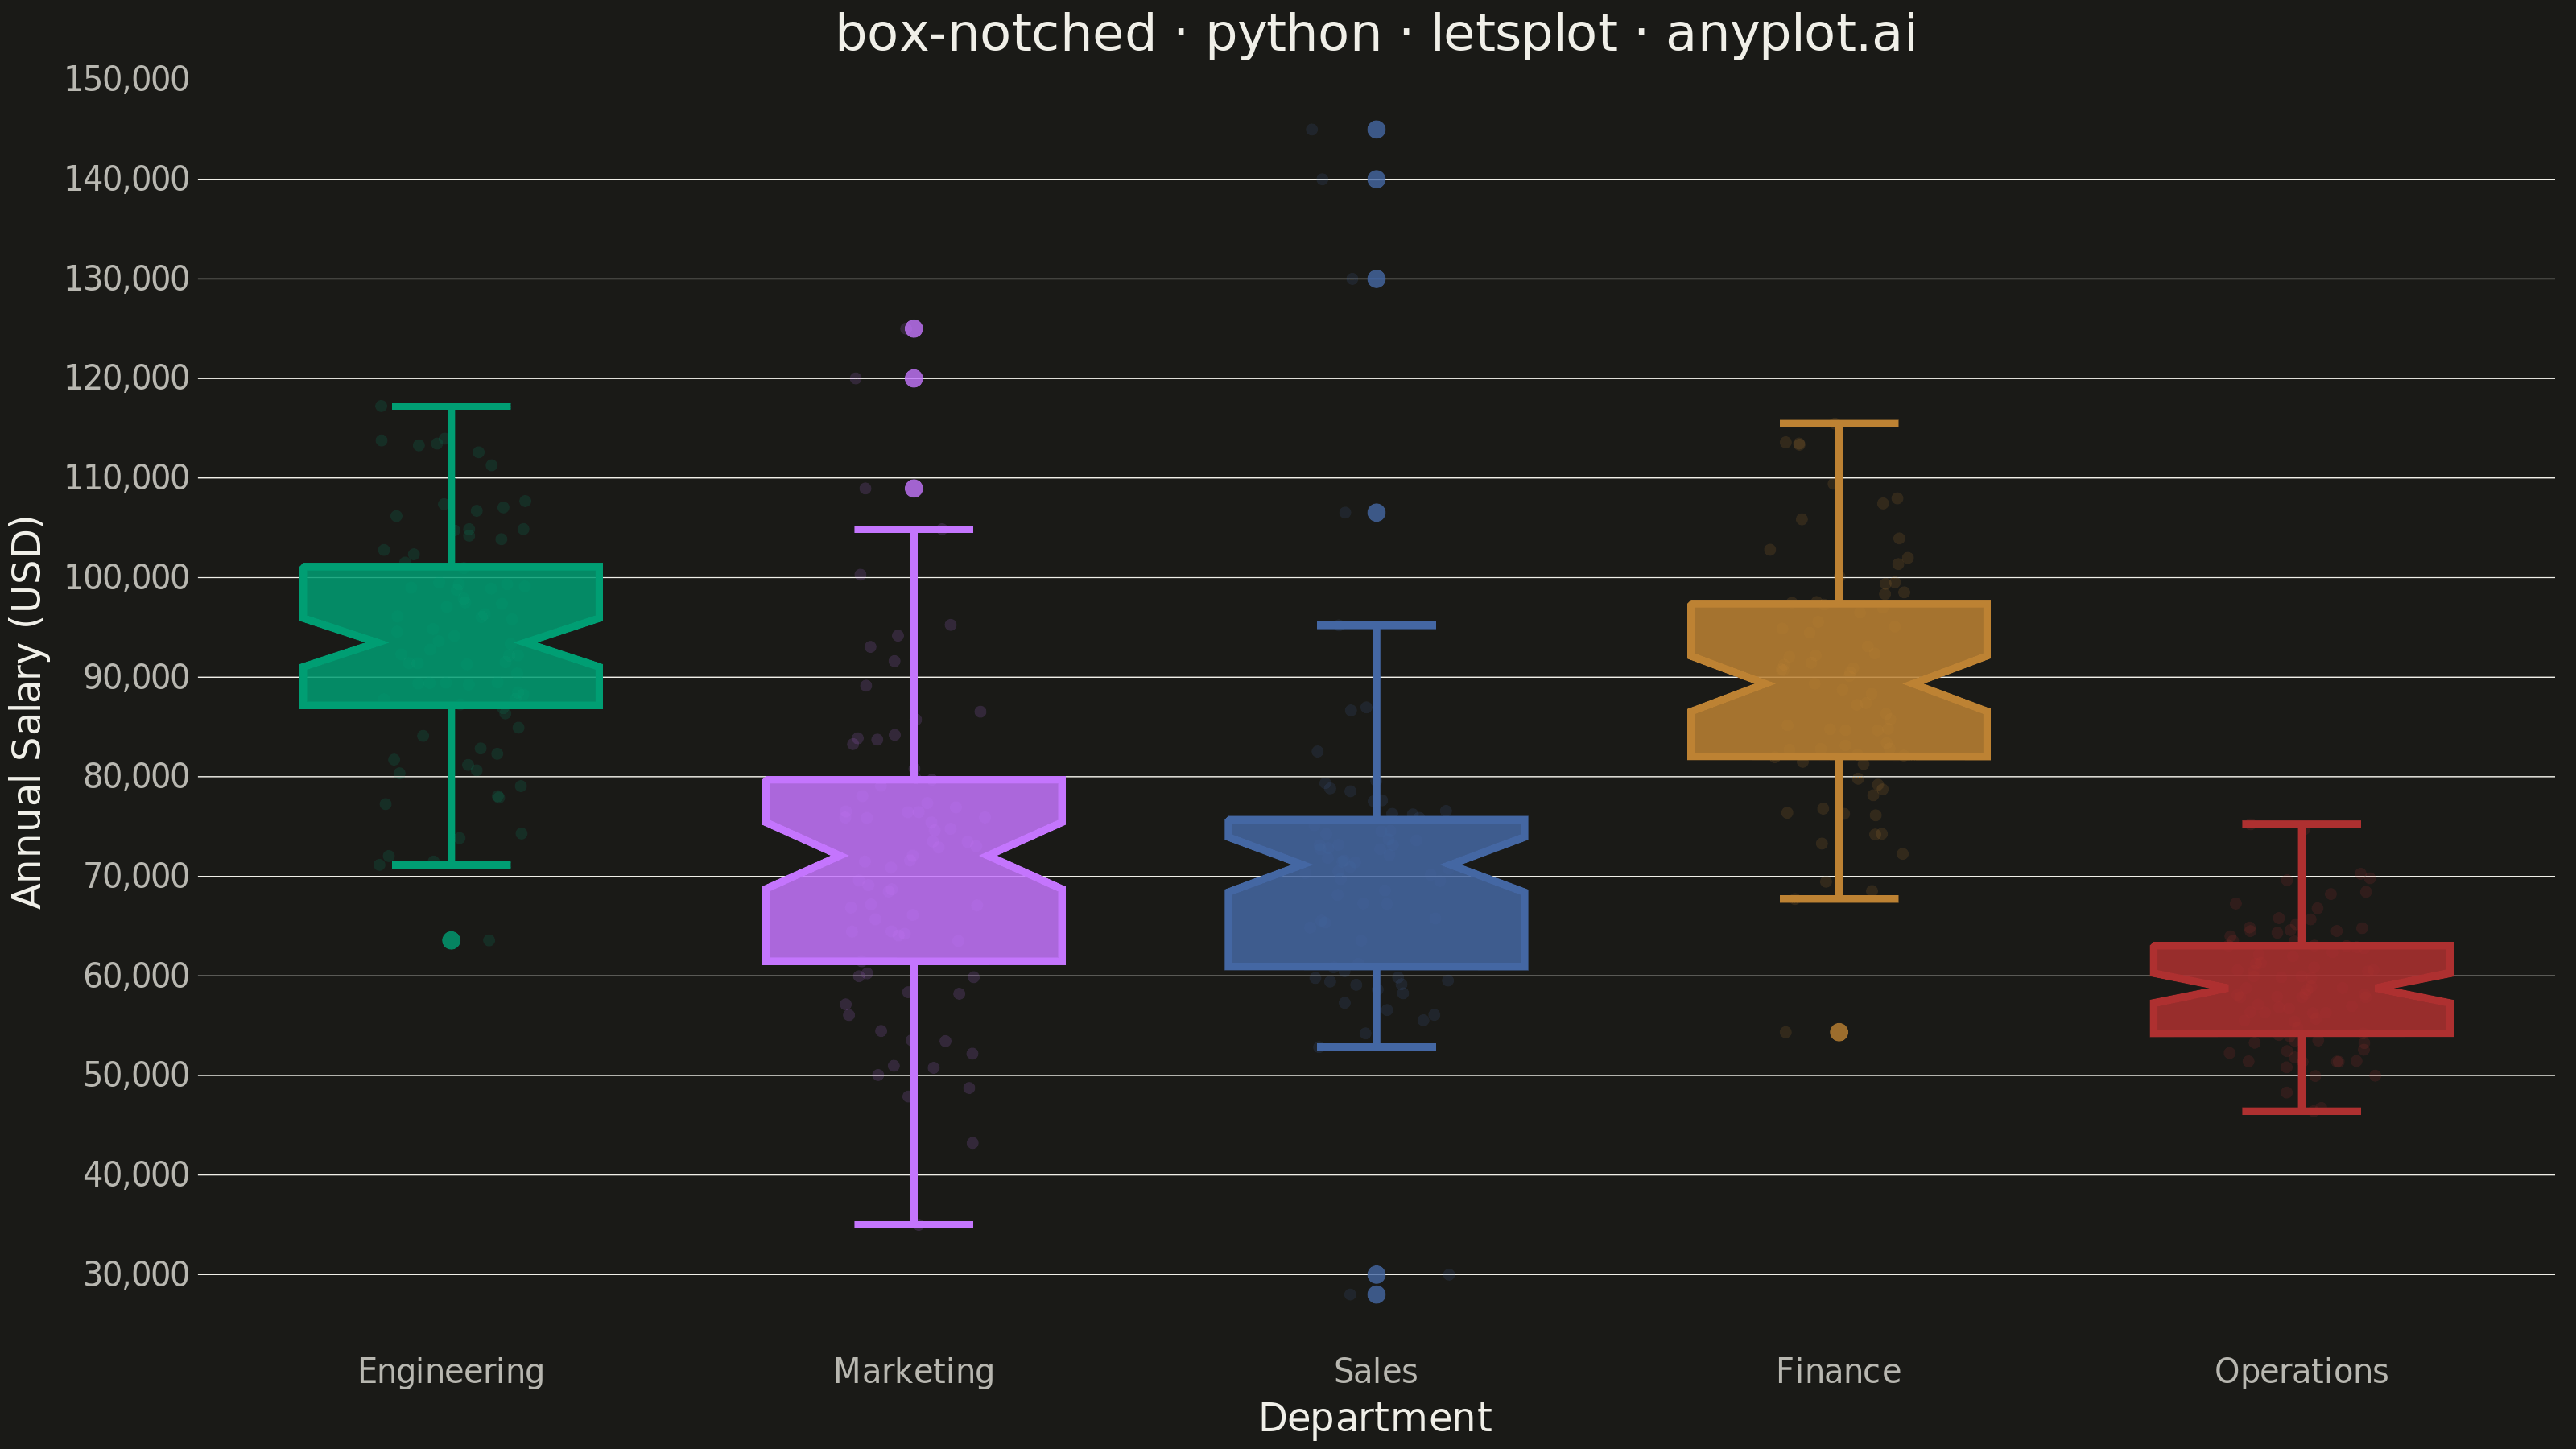
A notched box plot extends the standard box plot by adding notches around the median that represent a confidence interval. If the notches of two boxes do not overlap, this provides visual evidence that the medians differ significantly. This variant is particularly valuable for quick visual hypothesis testing and comparing group medians in statistical analysis.
""" anyplot.ai
box-notched: Notched Box Plot
Library: letsplot 4.11.0 | Python 3.13.15
Quality: 93/100 | Updated: 2026-08-18
"""

import os

import numpy as np
import pandas as pd
from lets_plot import *
from lets_plot.export import ggsave


LetsPlot.setup_html()

# Theme tokens
THEME = os.getenv("ANYPLOT_THEME", "light")
PAGE_BG = "#FAF8F1" if THEME == "light" else "#1A1A17"
INK = "#1A1A17" if THEME == "light" else "#F0EFE8"
INK_SOFT = "#4A4A44" if THEME == "light" else "#B8B7B0"
GRID_COLOR = "rgba(26,26,23,0.15)" if THEME == "light" else "rgba(240,239,232,0.15)"

IMPRINT = ["#009E73", "#C475FD", "#4467A3", "#BD8233", "#AE3030"]

# Data - department salaries with different distributions for statistical comparison
np.random.seed(42)

departments = ["Engineering", "Marketing", "Sales", "Finance", "Operations"]
data = []

# Engineering: higher salaries, moderate spread
eng_salaries = np.random.normal(95000, 12000, 80)
data.extend([{"Department": "Engineering", "Salary": s} for s in eng_salaries])

# Marketing: medium salaries, wider spread with some outliers
mkt_salaries = np.concatenate(
    [
        np.random.normal(72000, 15000, 70),
        np.array([120000, 125000, 35000]),  # outliers
    ]
)
data.extend([{"Department": "Marketing", "Salary": s} for s in mkt_salaries])

# Sales: variable salaries with commission-based outliers
sales_salaries = np.concatenate(
    [
        np.random.normal(68000, 10000, 65),
        np.array([130000, 140000, 145000, 30000, 28000]),  # high and low outliers
    ]
)
data.extend([{"Department": "Sales", "Salary": s} for s in sales_salaries])

# Finance: similar to engineering but slightly lower (overlapping notches expected)
fin_salaries = np.random.normal(90000, 11000, 75)
data.extend([{"Department": "Finance", "Salary": s} for s in fin_salaries])

# Operations: lower salaries, tight distribution
ops_salaries = np.random.normal(58000, 8000, 85)
data.extend([{"Department": "Operations", "Salary": s} for s in ops_salaries])

df = pd.DataFrame(data)

# lets-plot's geom_boxplot(notch=...) keyword is not implemented by the
# rendering backend (silently ignored), so the notch geometry is built by
# hand from the five-number summary: a 10-vertex "bowtie" polygon per
# category whose waist pinches to the median at +/-1.57*IQR/sqrt(n).
dept_x = {dept: i + 1 for i, dept in enumerate(departments)}
df["x"] = df["Department"].map(dept_x)

BOX_HALF_WIDTH = 0.32
NOTCH_INDENT_FRAC = 0.5  # fraction of half-width the waist pinches to (R default)

poly_rows = []
whisker_rows = []
outlier_rows = []

for dept in departments:
    vals = df.loc[df["Department"] == dept, "Salary"].to_numpy()
    n = len(vals)
    q1, median, q3 = np.percentile(vals, [25, 50, 75])
    iqr = q3 - q1
    lo_fence, hi_fence = q1 - 1.5 * iqr, q3 + 1.5 * iqr
    inside = vals[(vals >= lo_fence) & (vals <= hi_fence)]
    whisker_lo, whisker_hi = inside.min(), inside.max()
    outliers = vals[(vals < lo_fence) | (vals > hi_fence)]

    notch_half = 1.57 * iqr / np.sqrt(n)
    notch_lo = max(median - notch_half, q1)
    notch_hi = min(median + notch_half, q3)

    x0 = dept_x[dept]
    hw = BOX_HALF_WIDTH
    indent = hw * NOTCH_INDENT_FRAC

    vertices = [
        (x0 - hw, q3),
        (x0 + hw, q3),
        (x0 + hw, notch_hi),
        (x0 + indent, median),
        (x0 + hw, notch_lo),
        (x0 + hw, q1),
        (x0 - hw, q1),
        (x0 - hw, notch_lo),
        (x0 - indent, median),
        (x0 - hw, notch_hi),
    ]
    poly_rows.extend(
        {
            "Department": dept,
            "x": px,
            "y": py,
            "Q1": round(q1),
            "Median": round(median),
            "Q3": round(q3),
            "NotchCI": f"{round(notch_lo)} - {round(notch_hi)}",
        }
        for px, py in vertices
    )

    cap = hw * 0.4
    whisker_rows.append({"Department": dept, "x": x0, "xend": x0, "y": q3, "yend": whisker_hi})
    whisker_rows.append({"Department": dept, "x": x0, "xend": x0, "y": q1, "yend": whisker_lo})
    whisker_rows.append({"Department": dept, "x": x0 - cap, "xend": x0 + cap, "y": whisker_hi, "yend": whisker_hi})
    whisker_rows.append({"Department": dept, "x": x0 - cap, "xend": x0 + cap, "y": whisker_lo, "yend": whisker_lo})

    outlier_rows.extend({"Department": dept, "x": x0, "y": o} for o in outliers)

poly_df = pd.DataFrame(poly_rows)
whisker_df = pd.DataFrame(whisker_rows)
outlier_df = pd.DataFrame(outlier_rows)

# Jittered raw points behind the boxes surface the underlying distribution
# shape that the five-number summary hides
df["x_jitter"] = df["x"] + np.random.uniform(-0.16, 0.16, len(df))

plot = (
    ggplot()
    + geom_point(
        aes(x="x_jitter", y="Salary", color="Department"), data=df, size=1.6, alpha=0.15, shape=16, show_legend=False
    )
    + geom_segment(
        aes(x="x", xend="xend", y="y", yend="yend", color="Department"), data=whisker_df, size=1.0, show_legend=False
    )
    + geom_polygon(
        aes(x="x", y="y", group="Department", fill="Department"),
        data=poly_df,
        color=INK,
        size=0.6,
        alpha=0.85,
        show_legend=False,
        tooltips=layer_tooltips()
        .line("@Department")
        .line("Q1/Median/Q3|@Q1 / @Median / @Q3")
        .line("Notch CI|@NotchCI"),
    )
    + geom_point(
        aes(x="x", y="y", color="Department"),
        data=outlier_df,
        size=2.5,
        alpha=0.8,
        show_legend=False,
        tooltips=layer_tooltips().line("@Department").line("Outlier salary|@y"),
    )
    + scale_fill_manual(values=IMPRINT)
    + scale_color_manual(values=IMPRINT)
    + scale_x_continuous(breaks=list(dept_x.values()), labels=list(dept_x.keys()))
    + labs(title="box-notched · python · letsplot · anyplot.ai", x="Department", y="Annual Salary (USD)")
    + theme_minimal()
    + theme(
        plot_background=element_rect(fill=PAGE_BG, color=PAGE_BG),
        panel_background=element_rect(fill=PAGE_BG, color=PAGE_BG),
        panel_grid_major_y=element_line(color=GRID_COLOR, size=0.3, linetype="solid"),
        panel_grid_major_x=element_blank(),
        panel_grid_minor=element_blank(),
        axis_title=element_text(size=12, color=INK),
        axis_text_x=element_text(size=10, color=INK_SOFT),
        axis_text_y=element_text(size=10, color=INK_SOFT),
        axis_line=element_line(color=INK_SOFT, size=0.4),
        plot_title=element_text(size=16, color=INK, hjust=0.5),
        legend_position="none",
    )
    + ggsize(800, 450)
)

# Save as PNG (scale 4x for 3200x1800)
ggsave(plot, f"plot-{THEME}.png", path=".", scale=4)

# Save as HTML for interactivity
ggsave(plot, f"plot-{THEME}.html", path=".")
Runnable source as JSON, for any HTTP client: https://api.anyplot.ai/specs/box-notched/letsplot/code. Any spec id and library id listed in llms-full.txt fit the same URL shape; every URL below is complete and callable.
{
  "spec_id": "box-notched",
  "language": "python",
  "library": "letsplot",
  "page": "https://anyplot.ai/box-notched/python/letsplot",
  "hub": "https://anyplot.ai/box-notched",
  "code_json": "https://api.anyplot.ai/specs/box-notched/letsplot/code",
  "spec_json": "https://api.anyplot.ai/specs/box-notched",
  "render_light_png": "https://storage.googleapis.com/anyplot-images/plots/box-notched/python/letsplot/plot-light.png",
  "render_dark_png": "https://storage.googleapis.com/anyplot-images/plots/box-notched/python/letsplot/plot-dark.png",
  "interactive_light_html": "https://storage.googleapis.com/anyplot-images/plots/box-notched/python/letsplot/plot-light.html",
  "interactive_dark_html": "https://storage.googleapis.com/anyplot-images/plots/box-notched/python/letsplot/plot-dark.html",
  "quality_score": 93.0,
  "license": "MIT",
  "guide": "https://anyplot.ai/llms.txt"
}
Part of Notched Box Plot on anyplot.ai.