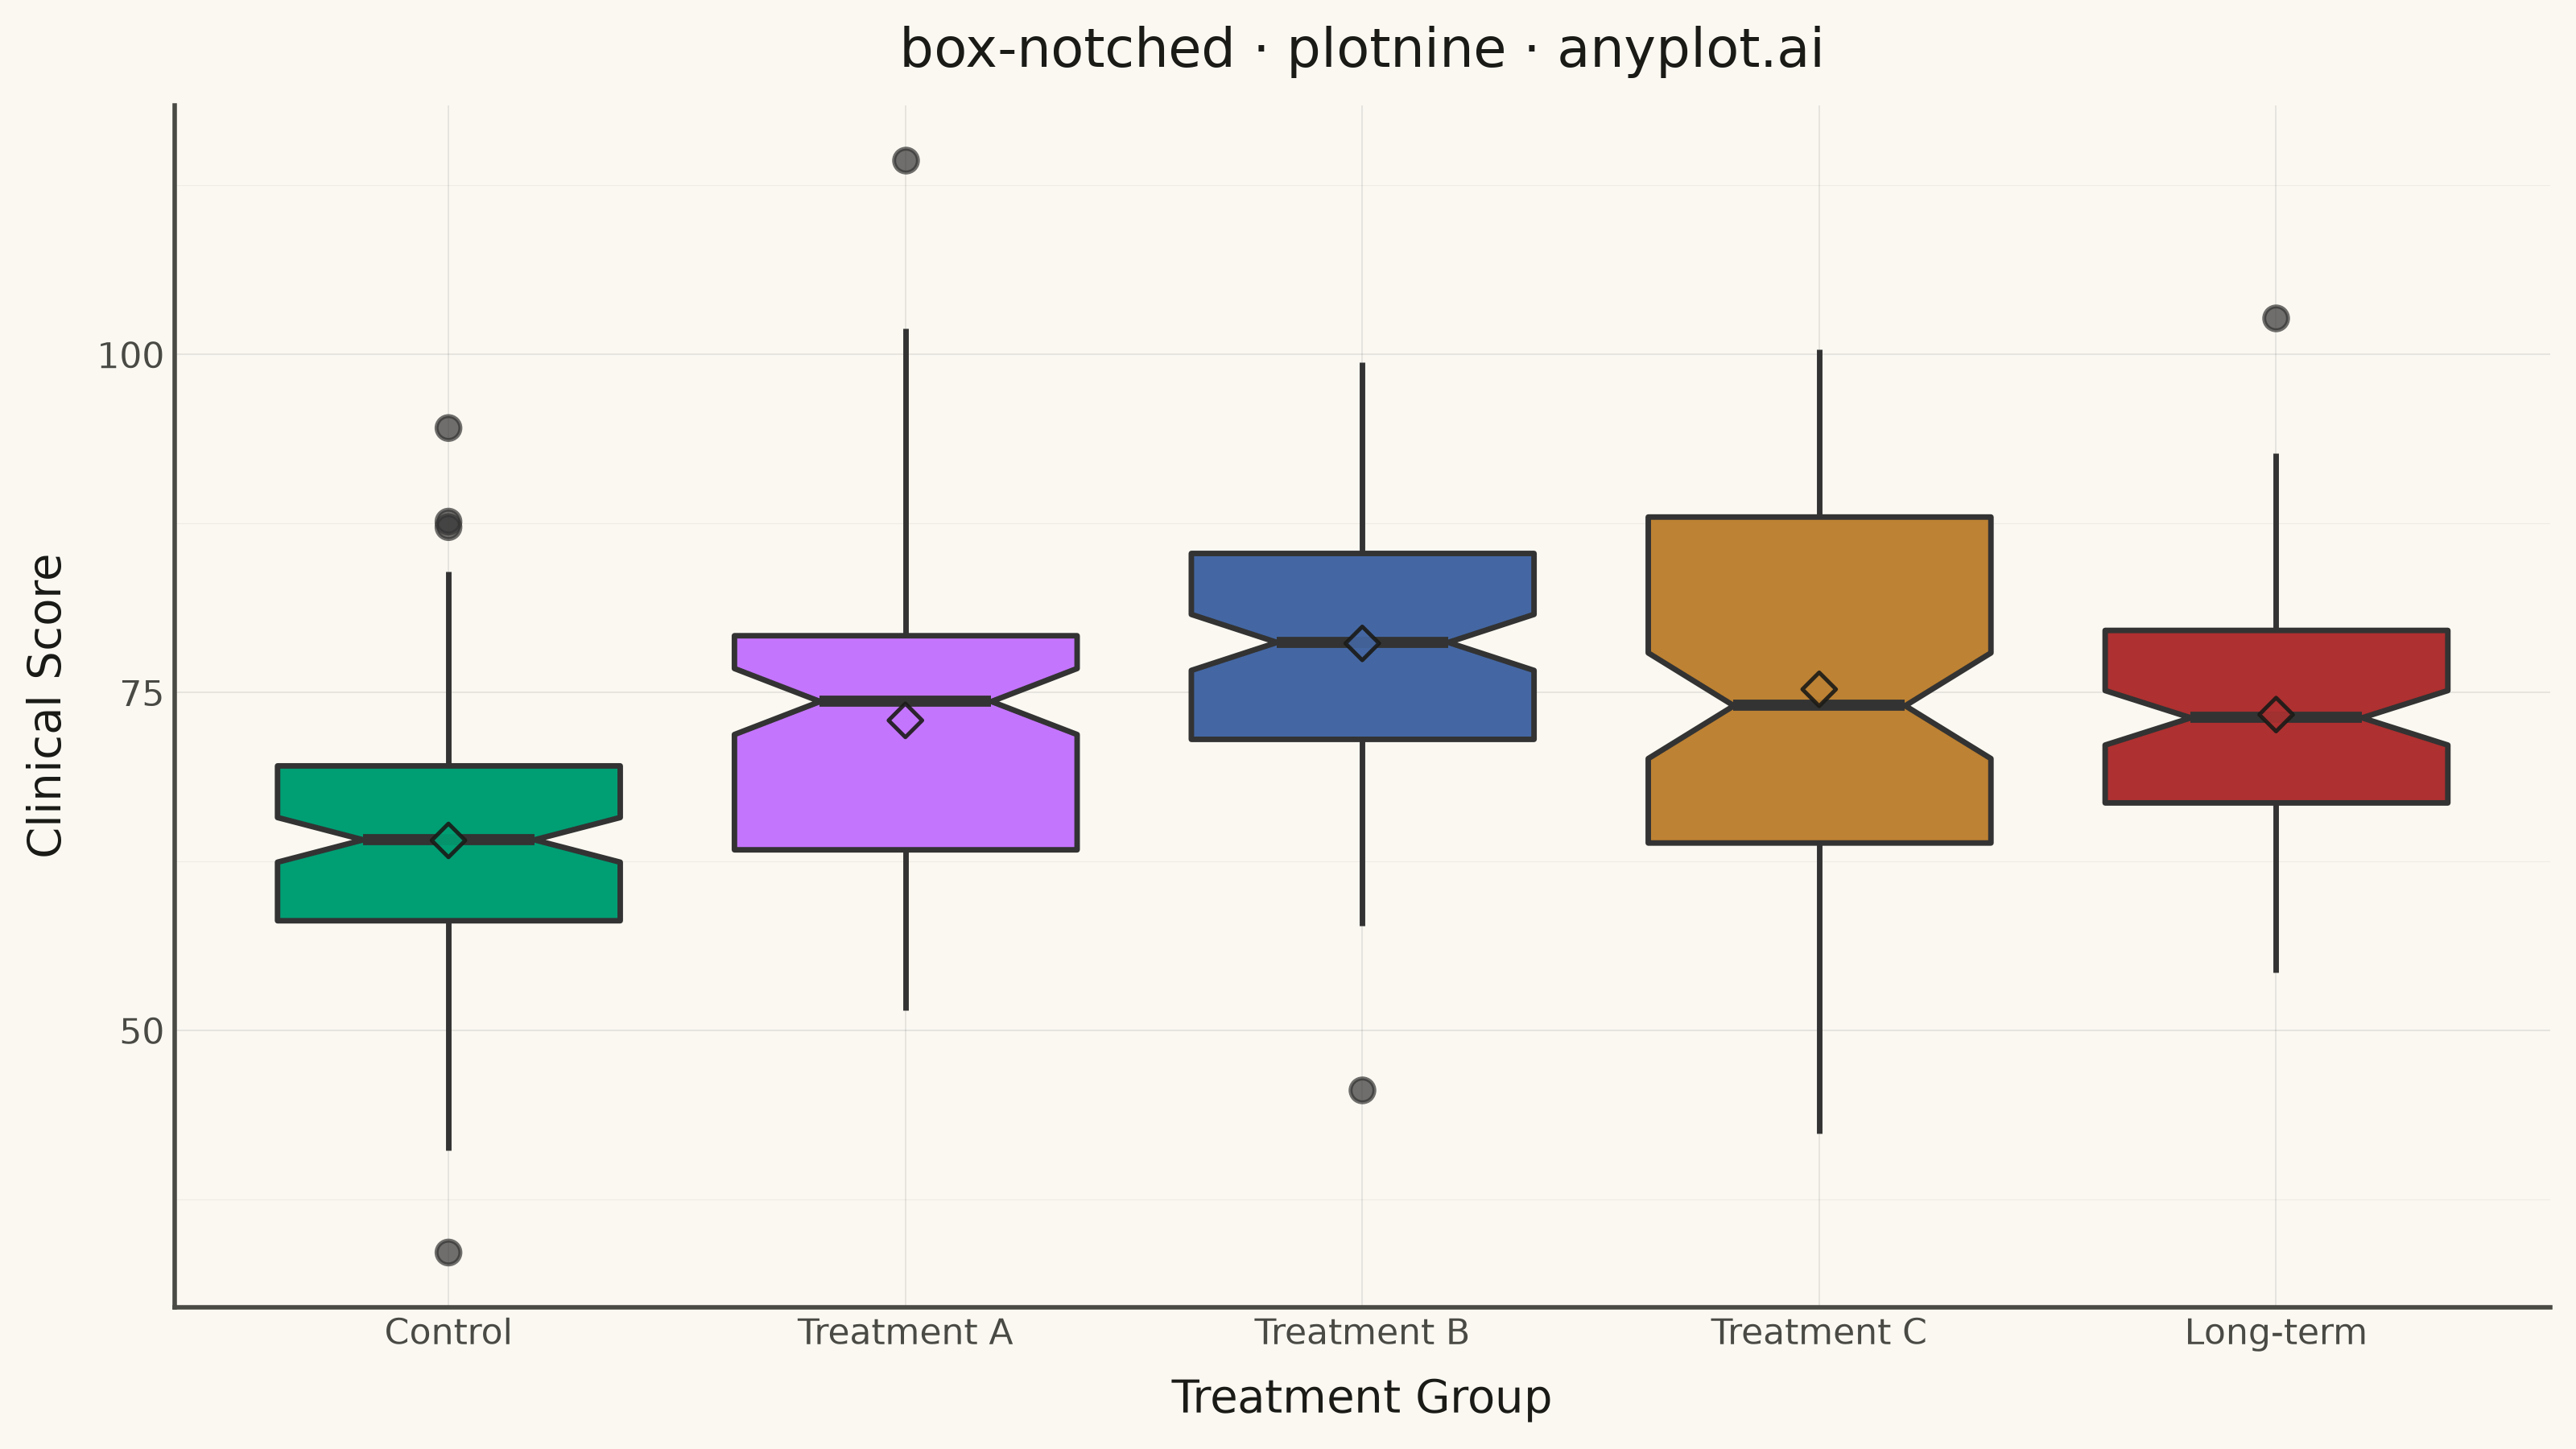
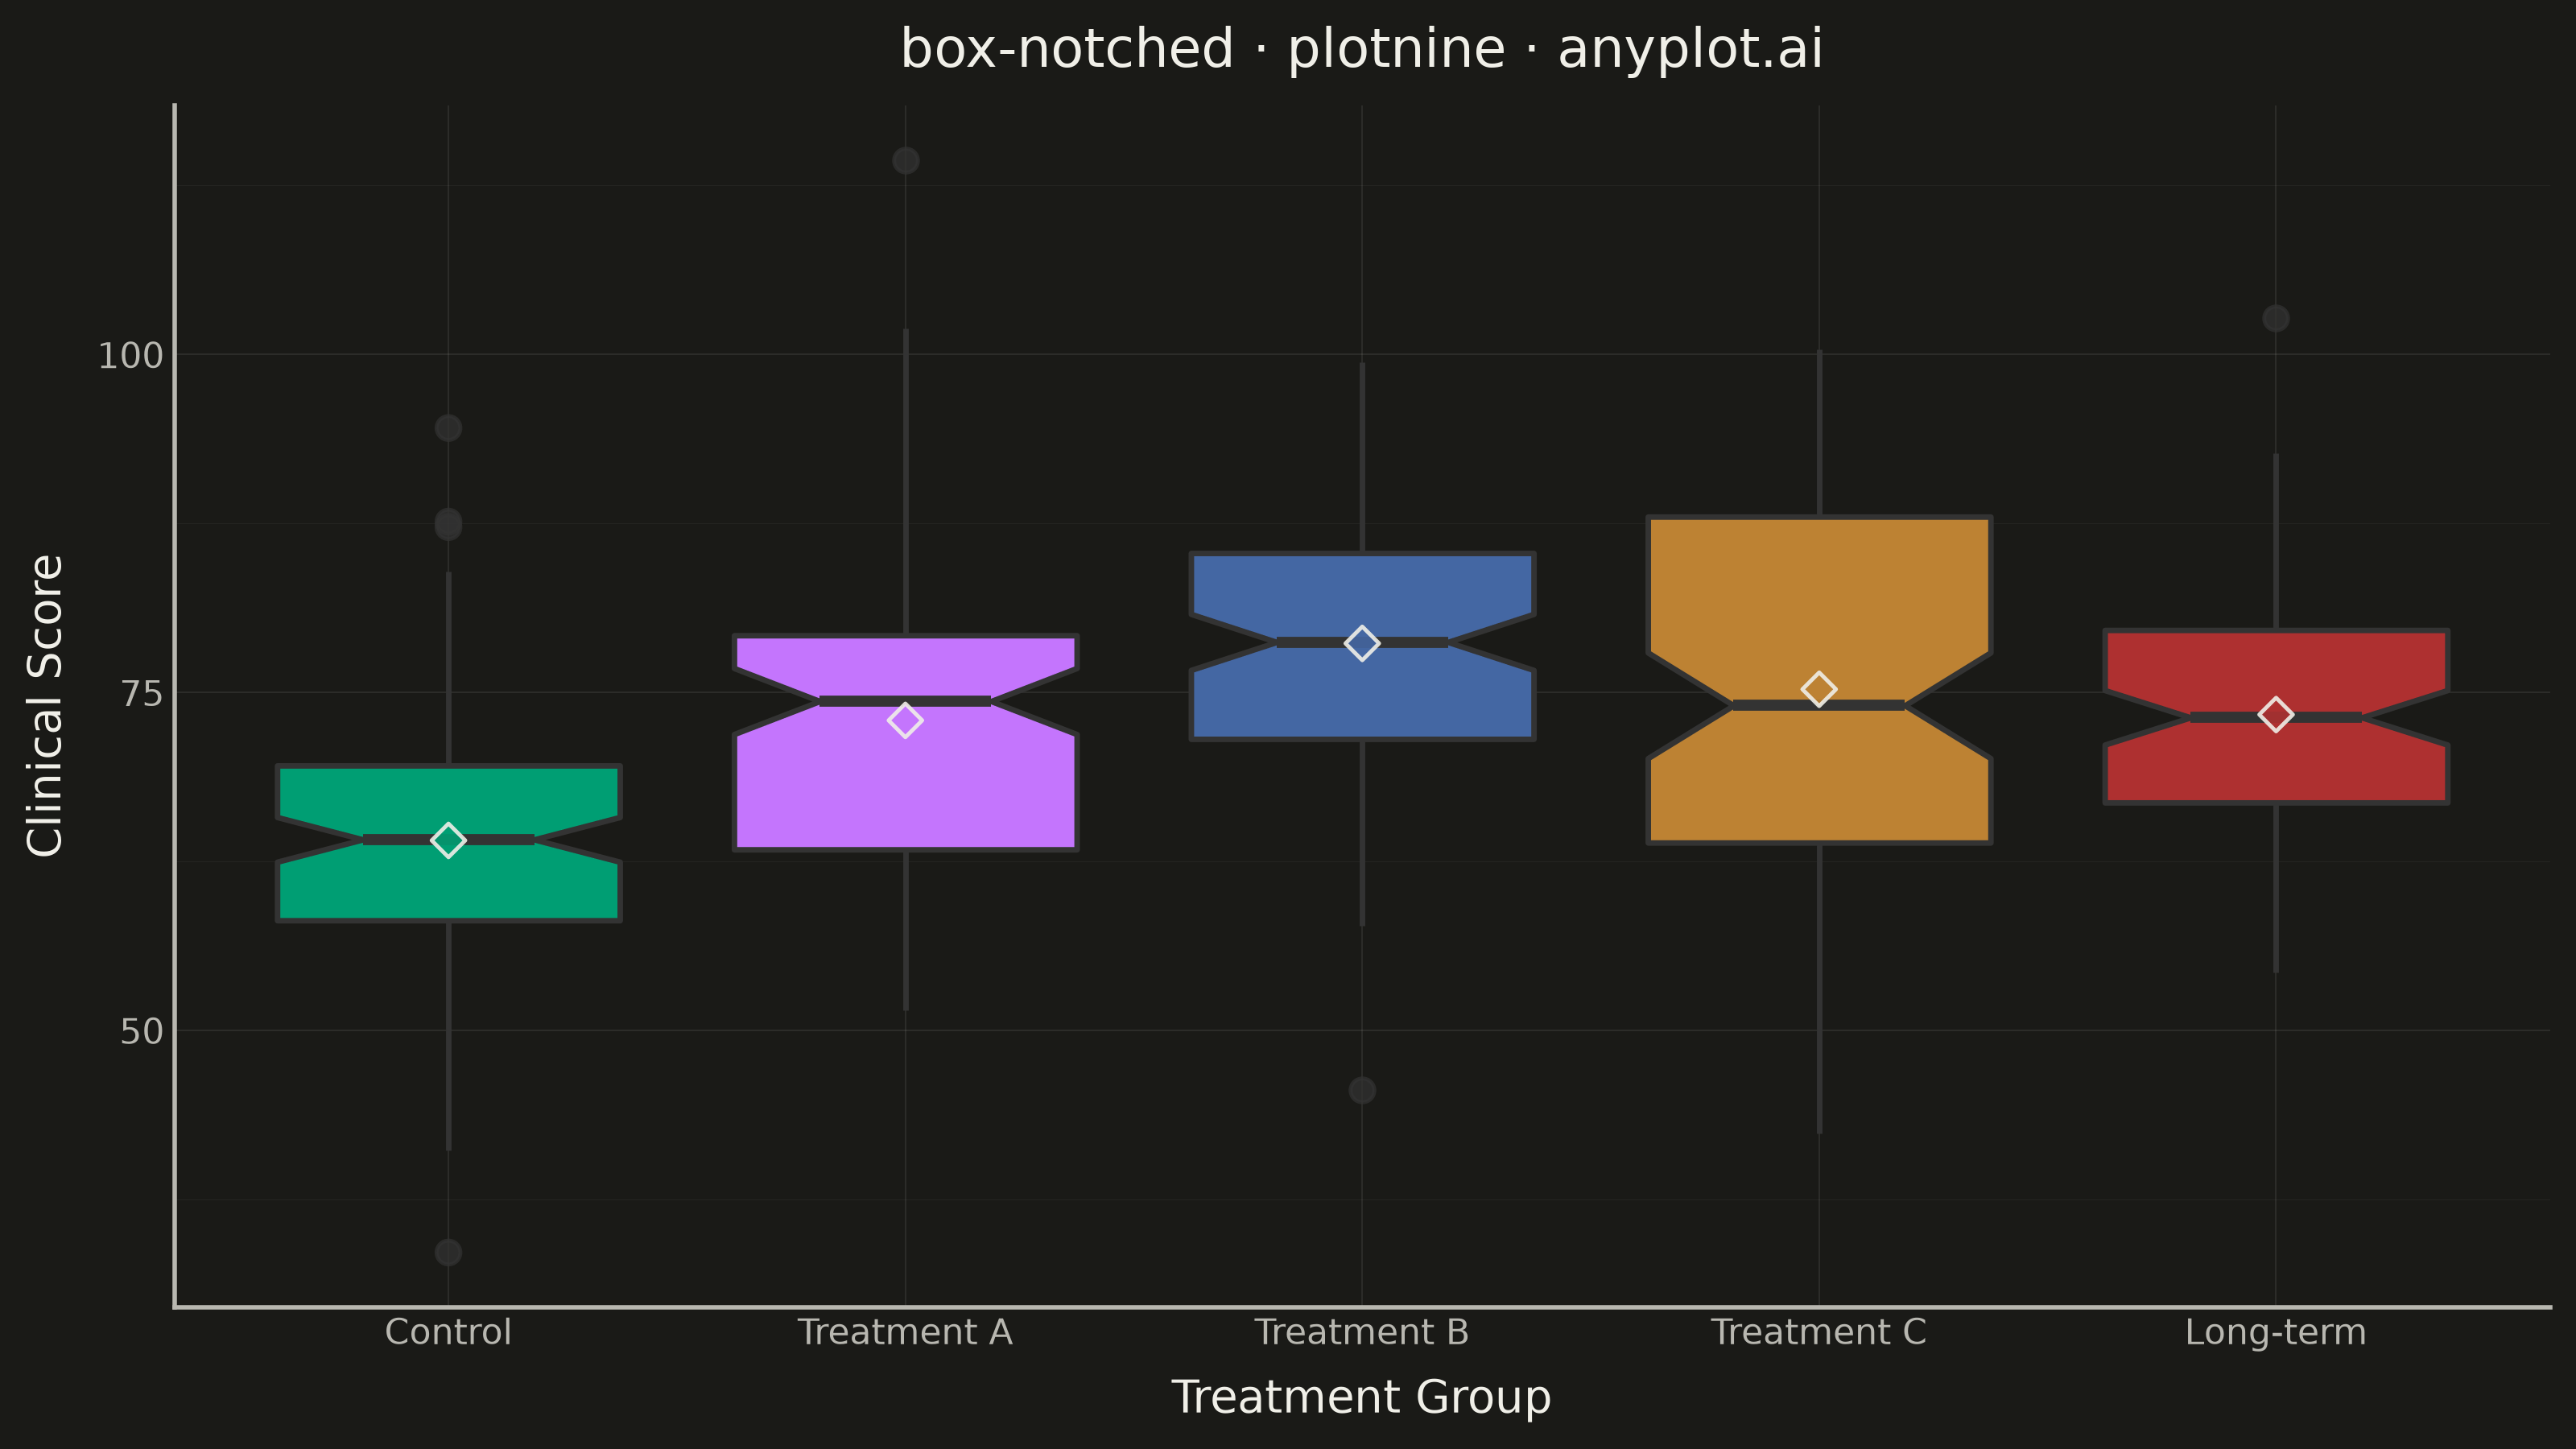
A notched box plot extends the standard box plot by adding notches around the median that represent a confidence interval. If the notches of two boxes do not overlap, this provides visual evidence that the medians differ significantly. This variant is particularly valuable for quick visual hypothesis testing and comparing group medians in statistical analysis.
""" anyplot.ai
box-notched: Notched Box Plot
Library: plotnine 0.15.8 | Python 3.13.15
Quality: 90/100 | Updated: 2026-08-18
"""

import os

import numpy as np
import pandas as pd
from plotnine import (
    aes,
    element_blank,
    element_line,
    element_rect,
    element_text,
    geom_boxplot,
    ggplot,
    labs,
    scale_fill_manual,
    stat_summary,
    theme,
    theme_minimal,
)


# Theme tokens
THEME = os.getenv("ANYPLOT_THEME", "light")
PAGE_BG = "#FAF8F1" if THEME == "light" else "#1A1A17"
ELEVATED_BG = "#FFFDF6" if THEME == "light" else "#242420"
INK = "#1A1A17" if THEME == "light" else "#F0EFE8"
INK_SOFT = "#4A4A44" if THEME == "light" else "#B8B7B0"

# Okabe-Ito palette
IMPRINT = ["#009E73", "#C475FD", "#4467A3", "#BD8233", "#AE3030"]

# Data - clinical trial outcomes across treatment groups
np.random.seed(42)

groups = ["Control", "Treatment A", "Treatment B", "Treatment C", "Long-term"]
n_per_group = [120, 105, 110, 95, 100]

data = []
# Control: baseline, modest median
data.extend([{"group": "Control", "score": v} for v in np.random.normal(65, 12, n_per_group[0])])
# Treatment A: moderate improvement
data.extend([{"group": "Treatment A", "score": v} for v in np.random.normal(72, 11, n_per_group[1])])
# Treatment B: strong improvement
data.extend([{"group": "Treatment B", "score": v} for v in np.random.normal(78, 10, n_per_group[2])])
# Treatment C: variable response, some outliers
treatment_c = np.concatenate([np.random.normal(70, 13, 70), np.random.normal(88, 6, 25)])
data.extend([{"group": "Treatment C", "score": v} for v in treatment_c])
# Long-term: sustained benefit
data.extend([{"group": "Long-term", "score": v} for v in np.random.normal(75, 9, n_per_group[4])])

df = pd.DataFrame(data)
df["group"] = pd.Categorical(df["group"], categories=groups, ordered=True)

# Plot
plot = (
    ggplot(df, aes(x="group", y="score", fill="group"))
    + geom_boxplot(notch=True, notchwidth=0.5, outlier_size=2.5, outlier_alpha=0.7, size=0.7)
    # Mean markers (diamond) layered over the median-based box — a plotnine-native
    # way to expose the mean-vs-median gap that notches alone don't show.
    + stat_summary(fun_y=np.mean, geom="point", shape="D", size=2.5, color=INK, alpha=0.9)
    + scale_fill_manual(values=IMPRINT)
    + labs(x="Treatment Group", y="Clinical Score", title="box-notched · plotnine · anyplot.ai")
    + theme_minimal()
    + theme(
        figure_size=(8, 4.5),
        text=element_text(size=7),
        axis_title=element_text(size=10, color=INK),
        axis_text=element_text(size=8, color=INK_SOFT),
        plot_title=element_text(size=12, color=INK),
        plot_background=element_rect(fill=PAGE_BG, color=PAGE_BG),
        panel_background=element_rect(fill=PAGE_BG),
        panel_grid_major=element_line(color=INK, size=0.3, alpha=0.10),
        panel_grid_minor=element_line(color=INK, size=0.2, alpha=0.05),
        # L-shaped spine (bottom + left only) instead of a full panel box —
        # a leaner frame that keeps focus on the boxes/notches.
        panel_border=element_blank(),
        axis_line=element_line(color=INK_SOFT),
        legend_position="none",
    )
)

# Save
plot.save(f"plot-{THEME}.png", dpi=400, width=8, height=4.5, units="in", verbose=False)
Runnable source as JSON, for any HTTP client: https://api.anyplot.ai/specs/box-notched/plotnine/code. Any spec id and library id listed in llms-full.txt fit the same URL shape; every URL below is complete and callable.
{
  "spec_id": "box-notched",
  "language": "python",
  "library": "plotnine",
  "page": "https://anyplot.ai/box-notched/python/plotnine",
  "hub": "https://anyplot.ai/box-notched",
  "code_json": "https://api.anyplot.ai/specs/box-notched/plotnine/code",
  "spec_json": "https://api.anyplot.ai/specs/box-notched",
  "render_light_png": "https://storage.googleapis.com/anyplot-images/plots/box-notched/python/plotnine/plot-light.png",
  "render_dark_png": "https://storage.googleapis.com/anyplot-images/plots/box-notched/python/plotnine/plot-dark.png",
  "quality_score": 90.0,
  "license": "MIT",
  "guide": "https://anyplot.ai/llms.txt"
}
Part of Notched Box Plot on anyplot.ai.