The same plot in 14 other libraries — JavaScript: Chart.js, D3.js, Highcharts, MUI X Charts; Python: Altair, Bokeh, lets-plot, Matplotlib, Plotly, plotnine, Pygal, Seaborn; R: ggplot2; Julia: Makie.jl. Compare all 15 side by side: Notched Box Plot in Python, R, Julia and JavaScript.
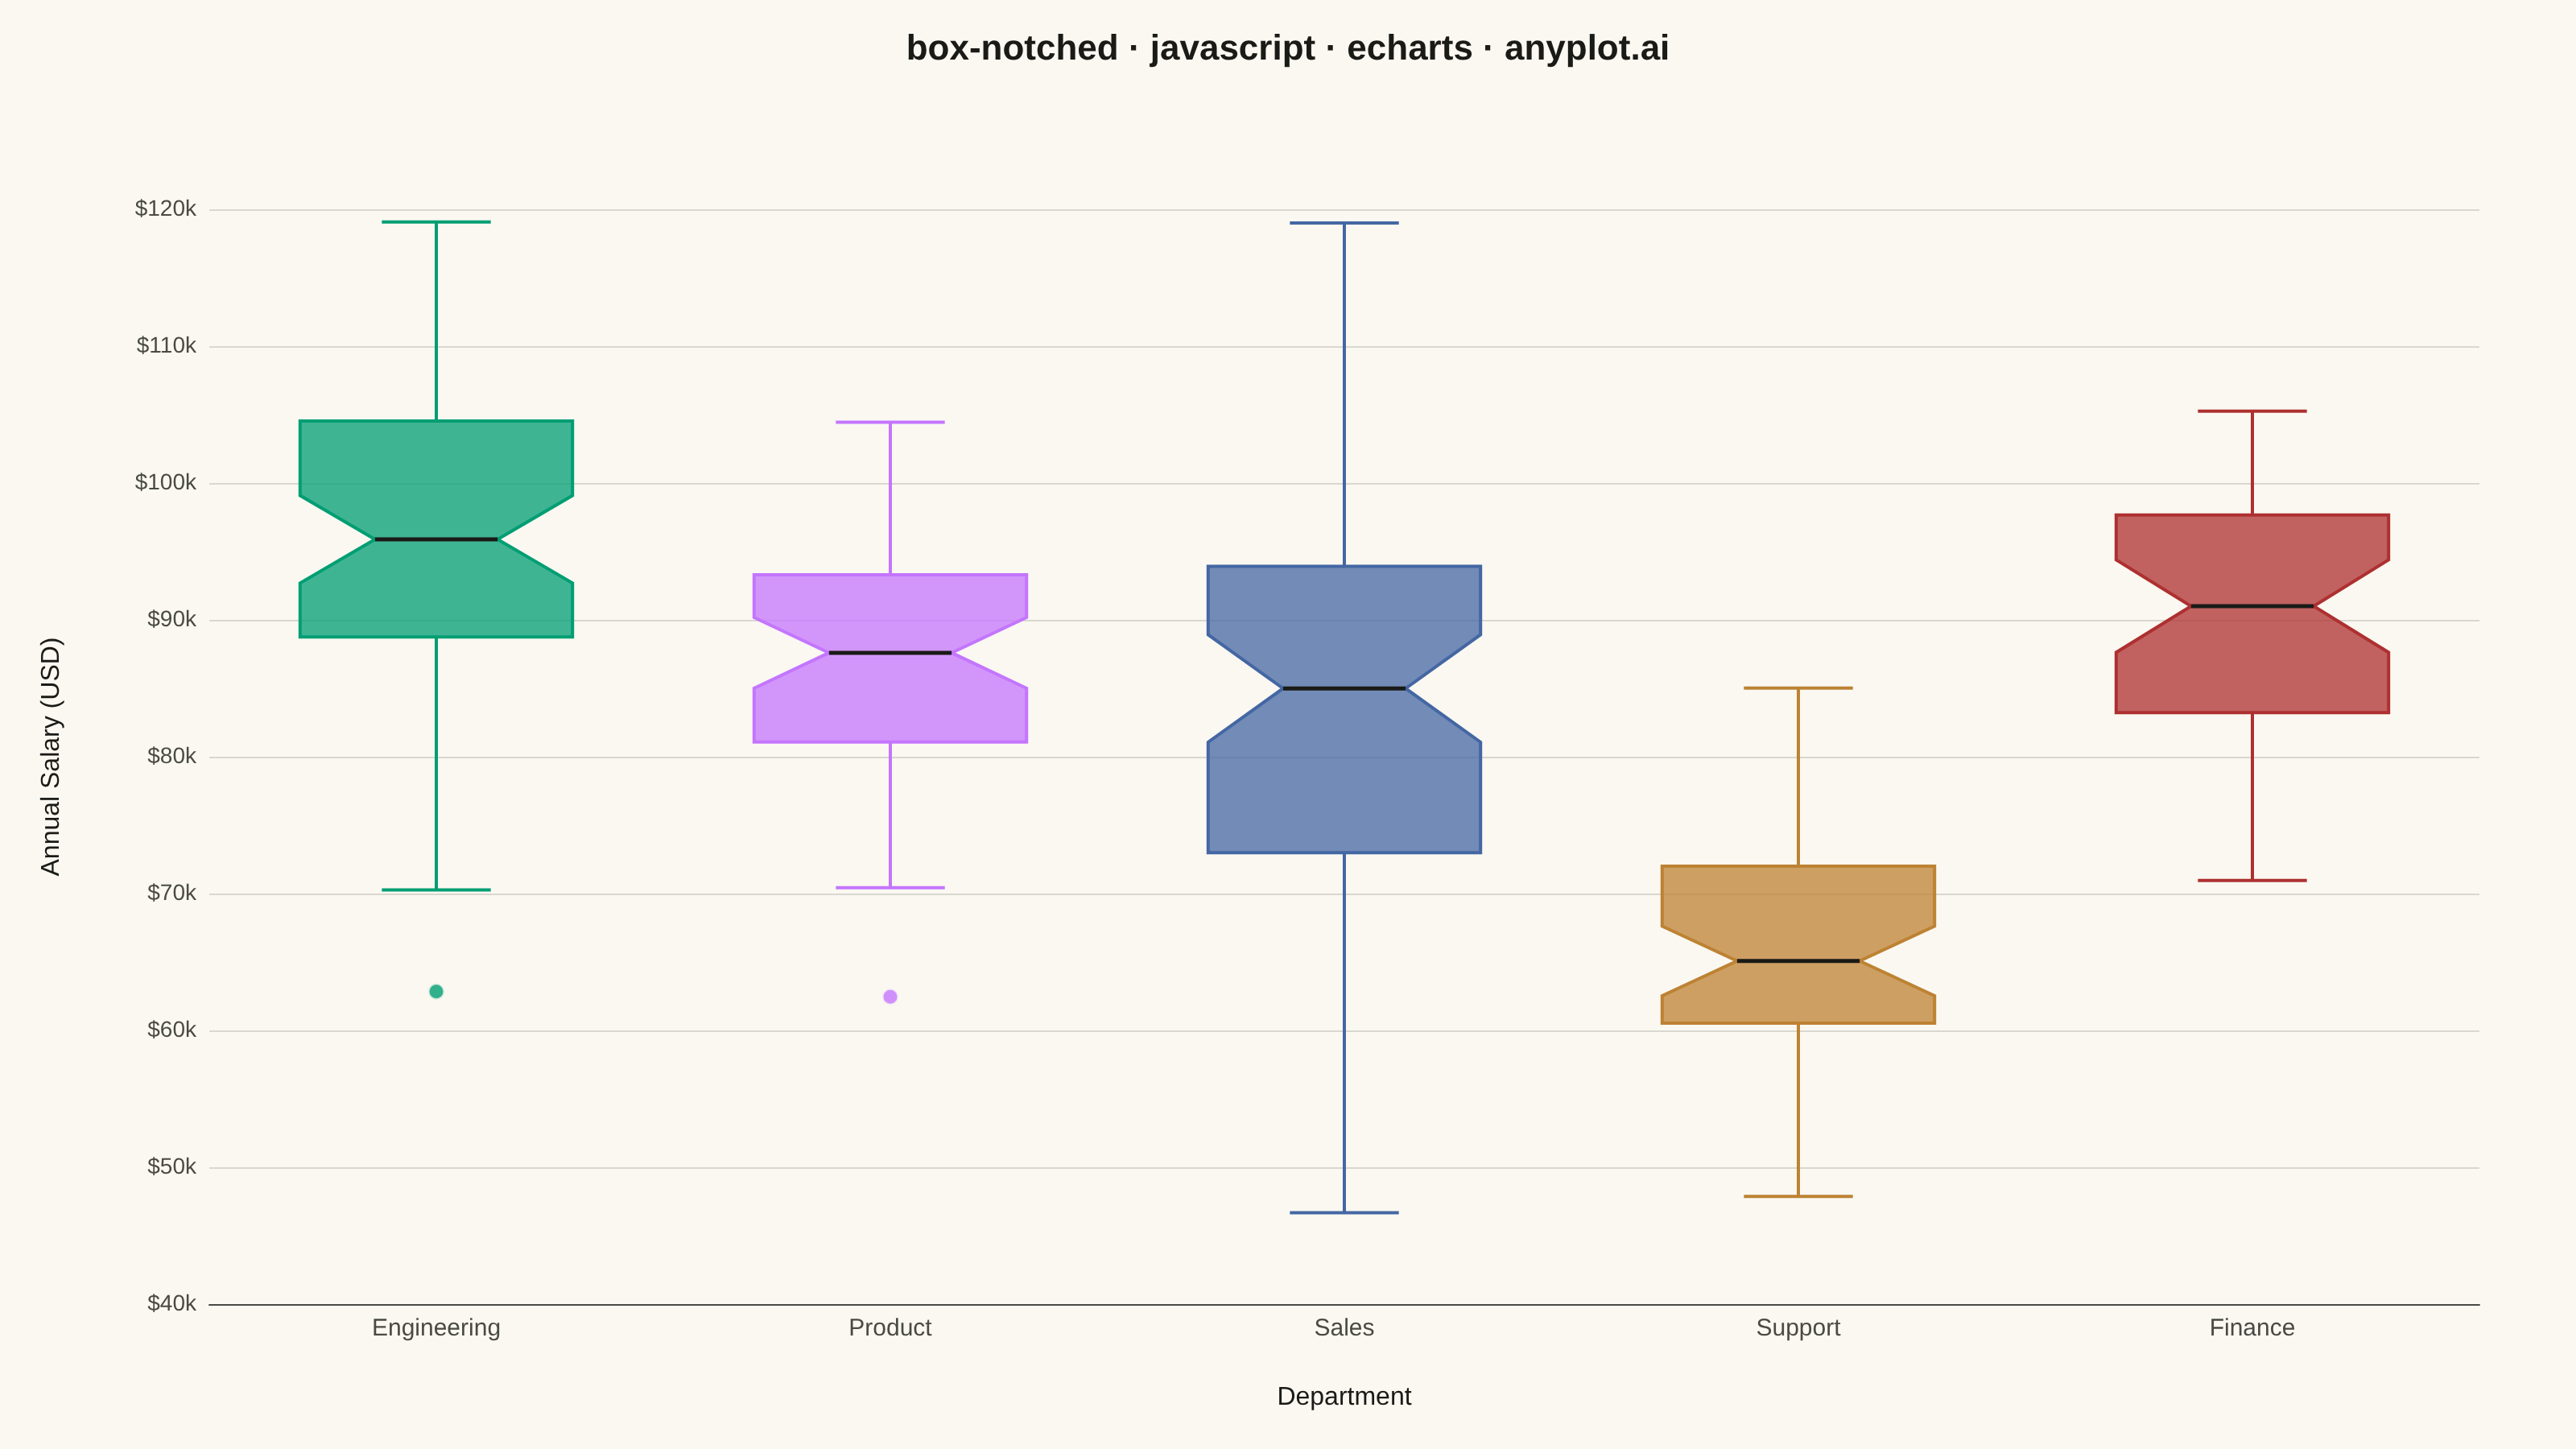
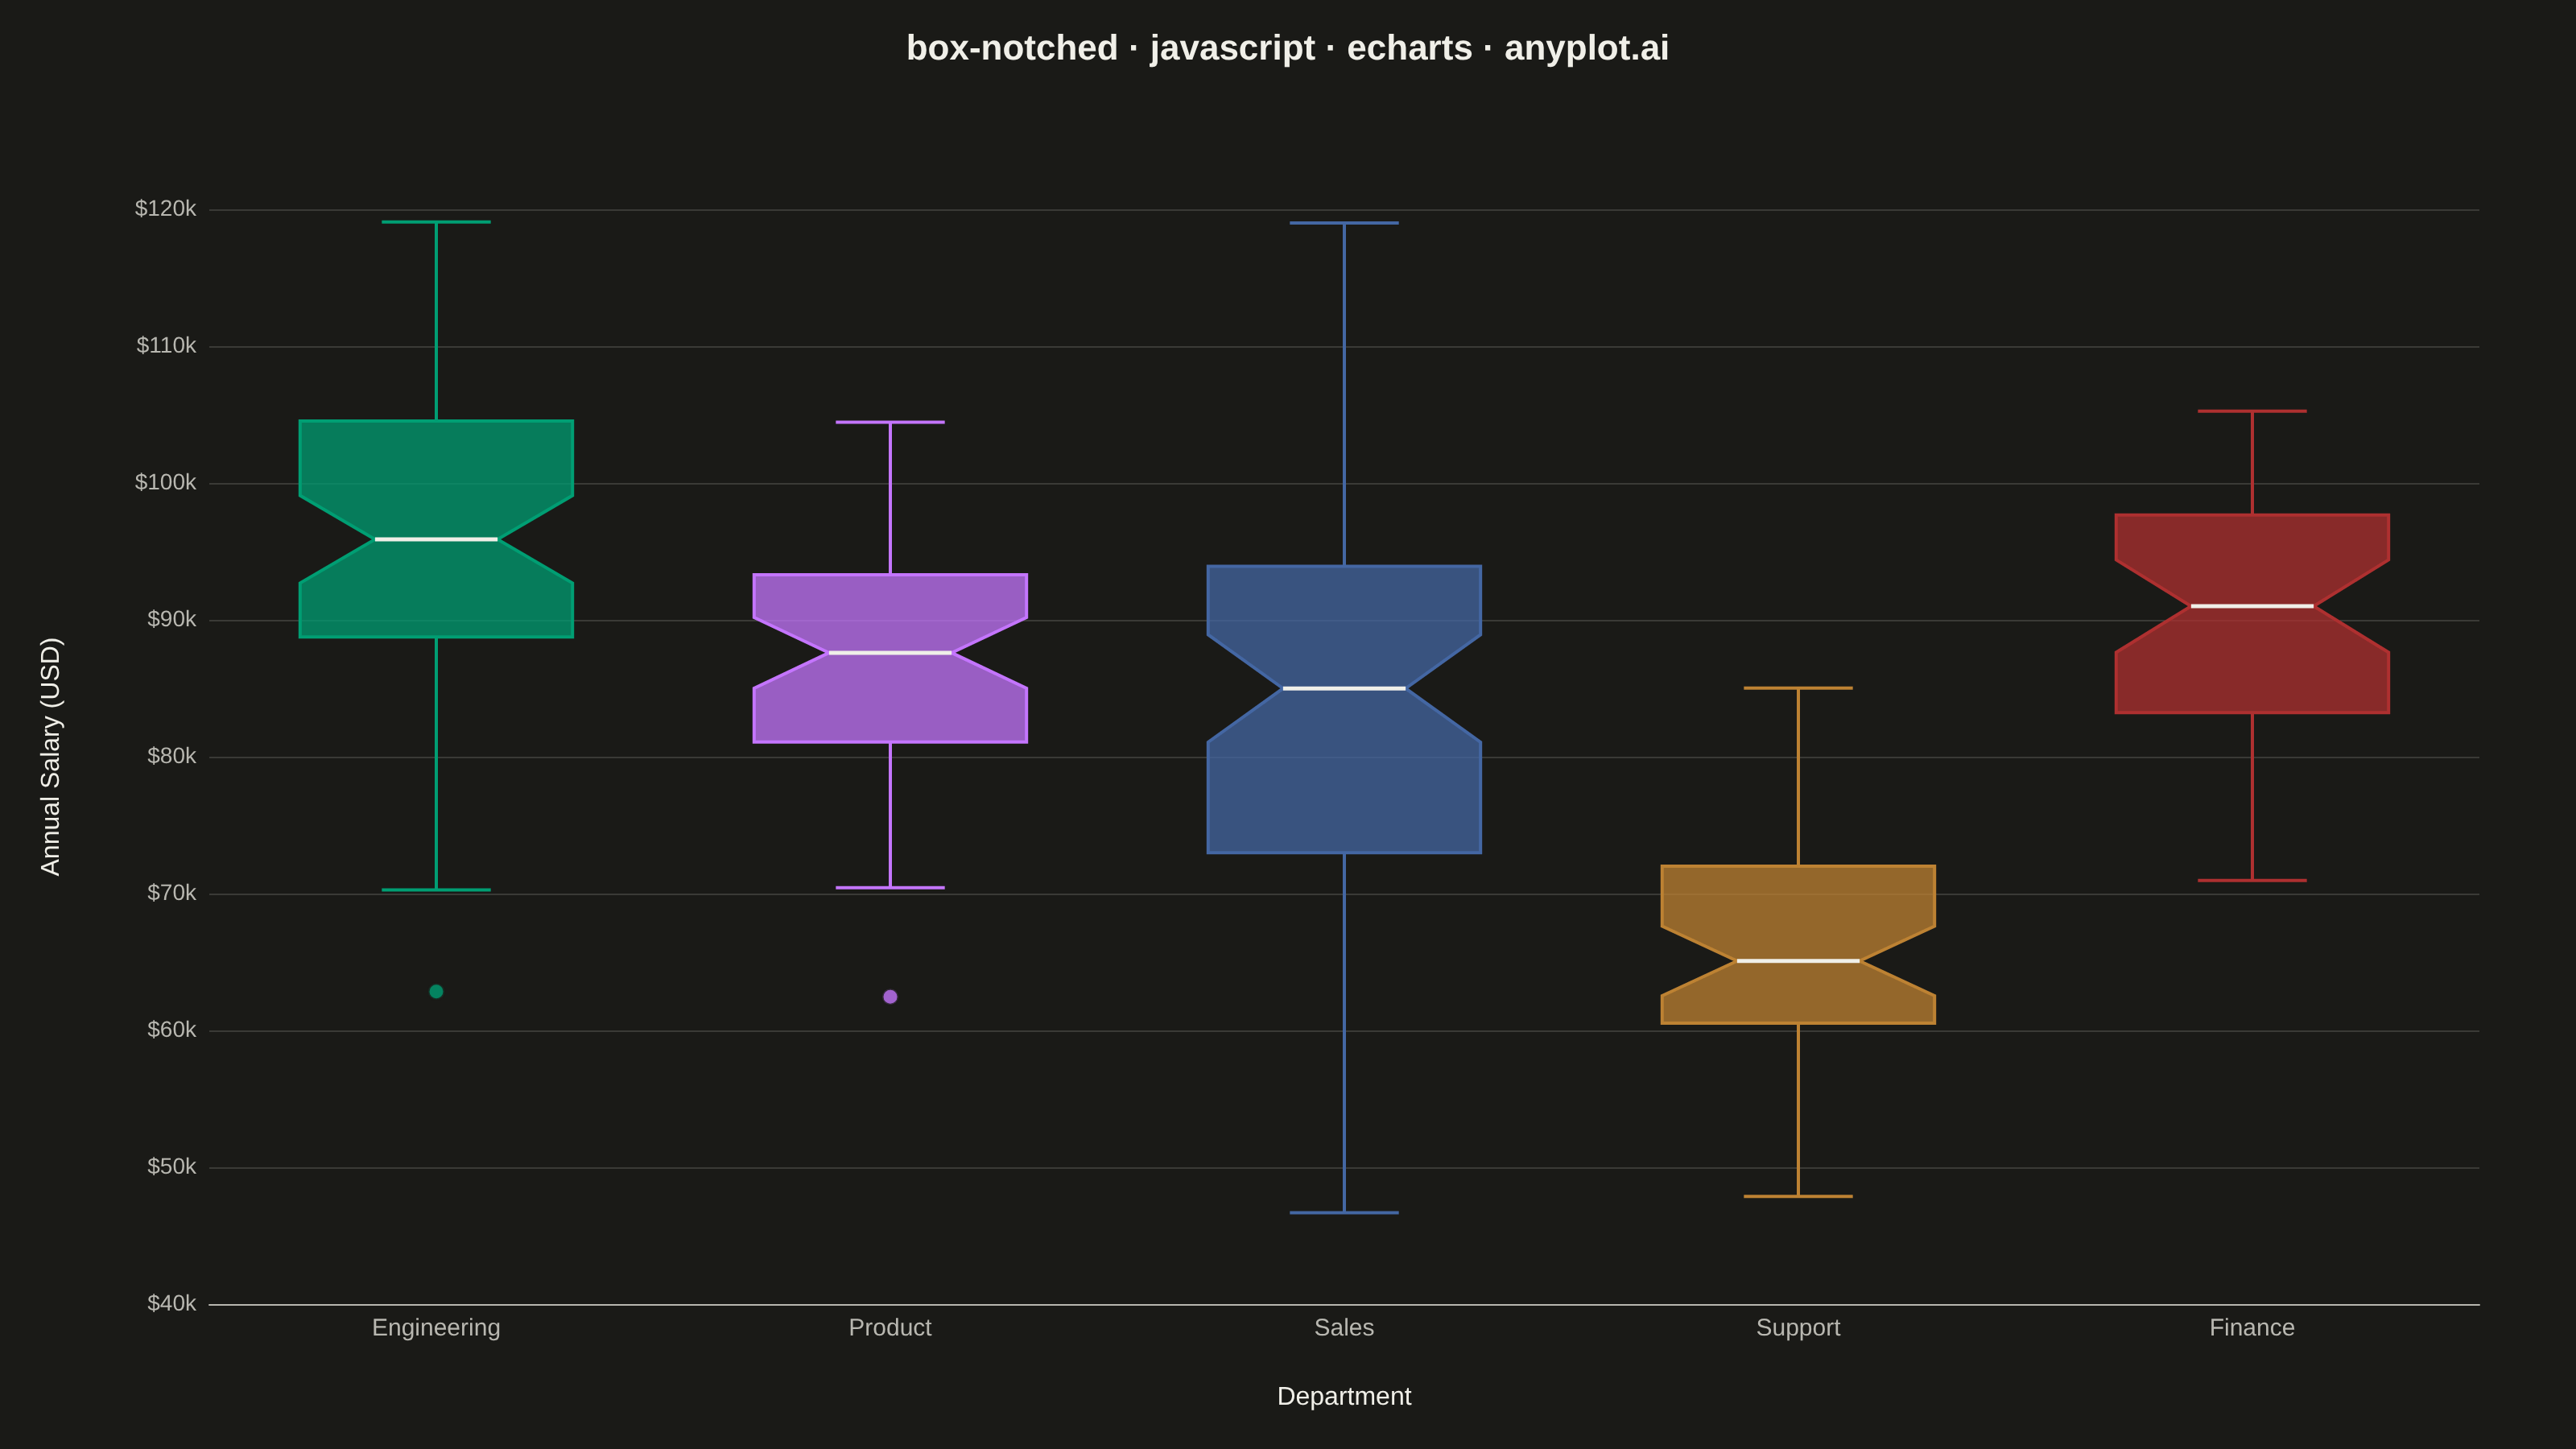
A notched box plot extends the standard box plot by adding notches around the median that represent a confidence interval. If the notches of two boxes do not overlap, this provides visual evidence that the medians differ significantly. This variant is particularly valuable for quick visual hypothesis testing and comparing group medians in statistical analysis.
// anyplot.ai
// box-notched: Notched Box Plot
// Library: echarts 6.1.0 | JavaScript 22.23.2
// Quality: 92/100 | Created: 2026-08-18

const t = window.ANYPLOT_TOKENS;

// --- Data (in-memory, deterministic) ----------------------------------------
// Tiny LCG so the browser (no seeded Math.random) still reproduces the same
// salary samples on every render.
function makeLcg(seed) {
  let state = seed >>> 0;
  return function lcg() {
    state = (state * 1664525 + 1013904223) >>> 0;
    return state / 4294967296;
  };
}

function randomNormal(rng, mean, std) {
  const u1 = Math.max(rng(), 1e-9);
  const u2 = rng();
  const z = Math.sqrt(-2 * Math.log(u1)) * Math.cos(2 * Math.PI * u2);
  return mean + z * std;
}

function quantile(sortedValues, p) {
  const pos = (sortedValues.length - 1) * p;
  const base = Math.floor(pos);
  const rest = pos - base;
  return sortedValues[base + 1] !== undefined
    ? sortedValues[base] + rest * (sortedValues[base + 1] - sortedValues[base])
    : sortedValues[base];
}

function computeBoxStats(values) {
  const sorted = [...values].sort((a, b) => a - b);
  const n = sorted.length;
  const q1 = quantile(sorted, 0.25);
  const median = quantile(sorted, 0.5);
  const q3 = quantile(sorted, 0.75);
  const iqr = q3 - q1;
  const lowerFence = q1 - 1.5 * iqr;
  const upperFence = q3 + 1.5 * iqr;
  const inliers = sorted.filter((v) => v >= lowerFence && v <= upperFence);
  const outliers = sorted.filter((v) => v < lowerFence || v > upperFence);
  const notchHalfWidth = (1.57 * iqr) / Math.sqrt(n);
  return {
    n,
    q1,
    median,
    q3,
    whiskerLow: inliers.length ? inliers[0] : sorted[0],
    whiskerHigh: inliers.length ? inliers[inliers.length - 1] : sorted[n - 1],
    notchLow: median - notchHalfWidth,
    notchHigh: median + notchHalfWidth,
    outliers,
  };
}

const departments = [
  { name: "Engineering", n: 60, mean: 95000, std: 12000 },
  { name: "Product", n: 55, mean: 88000, std: 11000 },
  { name: "Sales", n: 70, mean: 82000, std: 15000 },
  { name: "Support", n: 50, mean: 65000, std: 9000 },
  { name: "Finance", n: 45, mean: 91000, std: 10000 },
];

const rng = makeLcg(42);
const boxStats = departments.map((dept, idx) => {
  const salaries = Array.from({ length: dept.n }, () => randomNormal(rng, dept.mean, dept.std));
  return { idx, name: dept.name, ...computeBoxStats(salaries) };
});

const boxSeriesData = boxStats.map((s) => [
  s.idx,
  s.whiskerLow,
  s.q1,
  s.notchLow,
  s.median,
  s.notchHigh,
  s.q3,
  s.whiskerHigh,
]);

const outlierData = boxStats.flatMap((s) =>
  s.outliers.map((value) => ({
    value: [s.name, value],
    itemStyle: { color: t.palette[s.idx % t.palette.length] },
  })),
);

// --- Custom renderer: notched box + whiskers --------------------------------
// ECharts' built-in "boxplot" series has no notch support, so the box +
// whiskers + notch geometry is drawn by hand with a "custom" series, following
// the pixel-space offset pattern from ECharts' own custom-boxplot example
// (offsets computed via api.size, not in data space, so the shape stays
// crisp regardless of axis scale).
function renderNotchedBox(params, api) {
  const category = api.value(0);
  const whiskerLow = api.value(1);
  const q1 = api.value(2);
  const notchLow = api.value(3);
  const median = api.value(4);
  const notchHigh = api.value(5);
  const q3 = api.value(6);
  const whiskerHigh = api.value(7);

  const categoryWidth = api.size([1, 0])[0];
  const halfWidth = categoryWidth * 0.3;
  const notchWidth = halfWidth * 0.45;
  const capWidth = halfWidth * 0.4;

  const coordAt = (value) => api.coord([category, value]);
  const cx = coordAt(median)[0];
  const yWhiskerLow = coordAt(whiskerLow)[1];
  const yQ1 = coordAt(q1)[1];
  const yNotchLow = coordAt(notchLow)[1];
  const yMedian = coordAt(median)[1];
  const yNotchHigh = coordAt(notchHigh)[1];
  const yQ3 = coordAt(q3)[1];
  const yWhiskerHigh = coordAt(whiskerHigh)[1];

  const x0 = cx - halfWidth;
  const x1 = cx + halfWidth;
  const xN0 = cx - notchWidth;
  const xN1 = cx + notchWidth;

  const color = t.palette[category % t.palette.length];
  const lineStyle = { stroke: color, lineWidth: 2 };

  return {
    type: "group",
    children: [
      { type: "line", shape: { x1: cx, y1: yQ3, x2: cx, y2: yWhiskerHigh }, style: lineStyle },
      {
        type: "line",
        shape: { x1: cx - capWidth, y1: yWhiskerHigh, x2: cx + capWidth, y2: yWhiskerHigh },
        style: lineStyle,
      },
      { type: "line", shape: { x1: cx, y1: yQ1, x2: cx, y2: yWhiskerLow }, style: lineStyle },
      {
        type: "line",
        shape: { x1: cx - capWidth, y1: yWhiskerLow, x2: cx + capWidth, y2: yWhiskerLow },
        style: lineStyle,
      },
      {
        type: "polygon",
        shape: {
          points: [
            [x0, yQ3],
            [x1, yQ3],
            [x1, yNotchHigh],
            [xN1, yMedian],
            [x1, yNotchLow],
            [x1, yQ1],
            [x0, yQ1],
            [x0, yNotchLow],
            [xN0, yMedian],
            [x0, yNotchHigh],
          ],
        },
        style: { fill: color, fillOpacity: 0.75, stroke: color, lineWidth: 2 },
      },
      {
        type: "line",
        shape: { x1: xN0, y1: yMedian, x2: xN1, y2: yMedian },
        style: { stroke: t.ink, lineWidth: 2.5 },
      },
    ],
  };
}

// --- Init ---------------------------------------------------------------------
const chart = echarts.init(document.getElementById("container"));

// --- Option ---------------------------------------------------------------------
chart.setOption({
  animation: false,
  backgroundColor: "transparent",
  title: {
    text: "box-notched · javascript · echarts · anyplot.ai",
    left: "center",
    textStyle: { color: t.ink, fontSize: 22 },
  },
  grid: { left: 130, right: 60, top: 130, bottom: 90 },
  tooltip: {
    trigger: "item",
    formatter: (p) =>
      Array.isArray(p.value) && p.value.length === 8
        ? `${departments[p.value[0]].name}<br/>Q3: $${Math.round(p.value[6]).toLocaleString()}<br/>Median: $${Math.round(p.value[4]).toLocaleString()}<br/>Q1: $${Math.round(p.value[2]).toLocaleString()}`
        : `Salary: $${Math.round(p.value[1]).toLocaleString()}`,
  },
  xAxis: {
    type: "category",
    data: departments.map((d) => d.name),
    name: "Department",
    nameLocation: "middle",
    nameGap: 50,
    nameTextStyle: { color: t.ink, fontSize: 16 },
    axisLabel: { color: t.inkSoft, fontSize: 15 },
    axisLine: { lineStyle: { color: t.inkSoft } },
    axisTick: { show: false },
    splitLine: { show: false },
  },
  yAxis: {
    type: "value",
    scale: true,
    name: "Annual Salary (USD)",
    nameLocation: "middle",
    nameGap: 90,
    nameTextStyle: { color: t.ink, fontSize: 16 },
    axisLabel: {
      color: t.inkSoft,
      fontSize: 14,
      formatter: (v) => `$${Math.round(v / 1000)}k`,
    },
    axisLine: { lineStyle: { color: t.inkSoft } },
    splitLine: { lineStyle: { color: t.grid } },
  },
  series: [
    {
      type: "custom",
      name: "Salary Distribution",
      renderItem: renderNotchedBox,
      data: boxSeriesData,
      encode: { x: 0, y: [1, 2, 3, 4, 5, 6, 7] },
      z: 10,
    },
    {
      type: "scatter",
      name: "Outliers",
      data: outlierData,
      symbolSize: 10,
      itemStyle: { borderColor: t.pageBg, borderWidth: 1.5 },
      z: 20,
    },
  ],
});
Runnable source as JSON, for any HTTP client: https://api.anyplot.ai/specs/box-notched/echarts/code. Any spec id and library id listed in llms-full.txt fit the same URL shape; every URL below is complete and callable.
{
  "spec_id": "box-notched",
  "language": "javascript",
  "library": "echarts",
  "page": "https://anyplot.ai/box-notched/javascript/echarts",
  "hub": "https://anyplot.ai/box-notched",
  "code_json": "https://api.anyplot.ai/specs/box-notched/echarts/code",
  "spec_json": "https://api.anyplot.ai/specs/box-notched",
  "render_light_png": "https://storage.googleapis.com/anyplot-images/plots/box-notched/javascript/echarts/plot-light.png",
  "render_dark_png": "https://storage.googleapis.com/anyplot-images/plots/box-notched/javascript/echarts/plot-dark.png",
  "interactive_light_html": "https://storage.googleapis.com/anyplot-images/plots/box-notched/javascript/echarts/plot-light.html",
  "interactive_dark_html": "https://storage.googleapis.com/anyplot-images/plots/box-notched/javascript/echarts/plot-dark.html",
  "quality_score": 92.0,
  "license": "MIT",
  "guide": "https://anyplot.ai/llms.txt"
}
Part of Notched Box Plot on anyplot.ai.