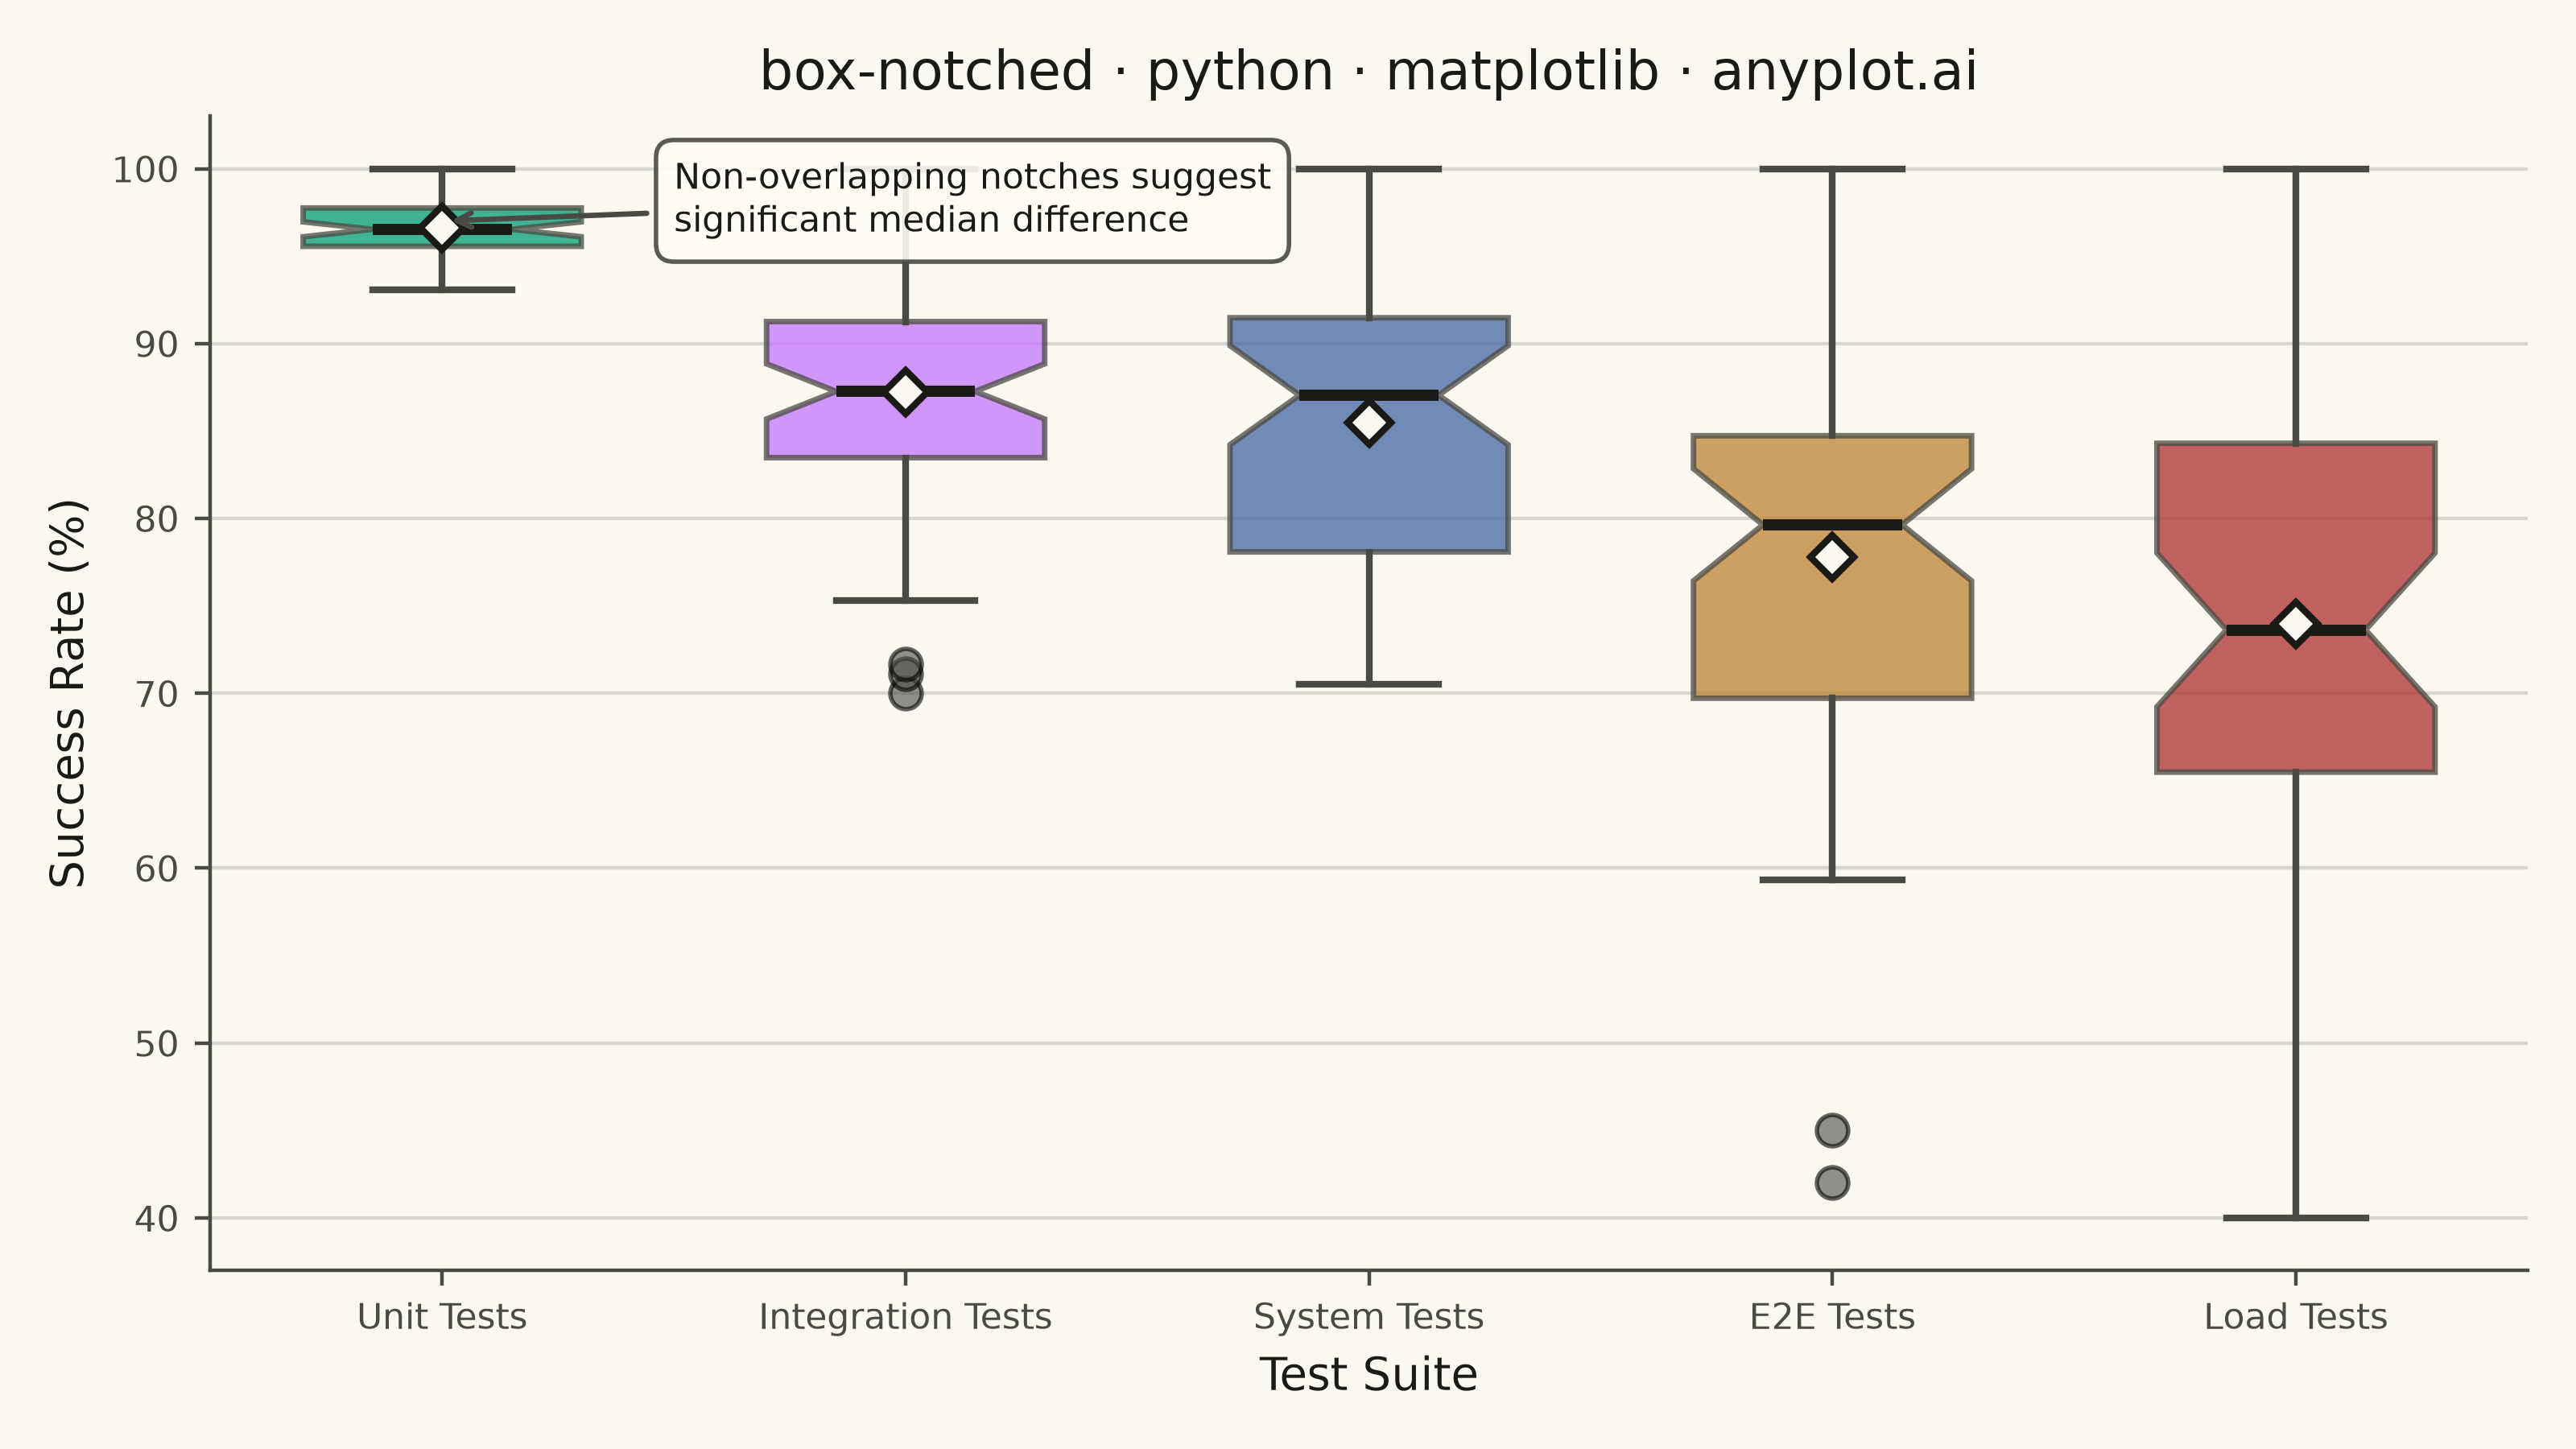
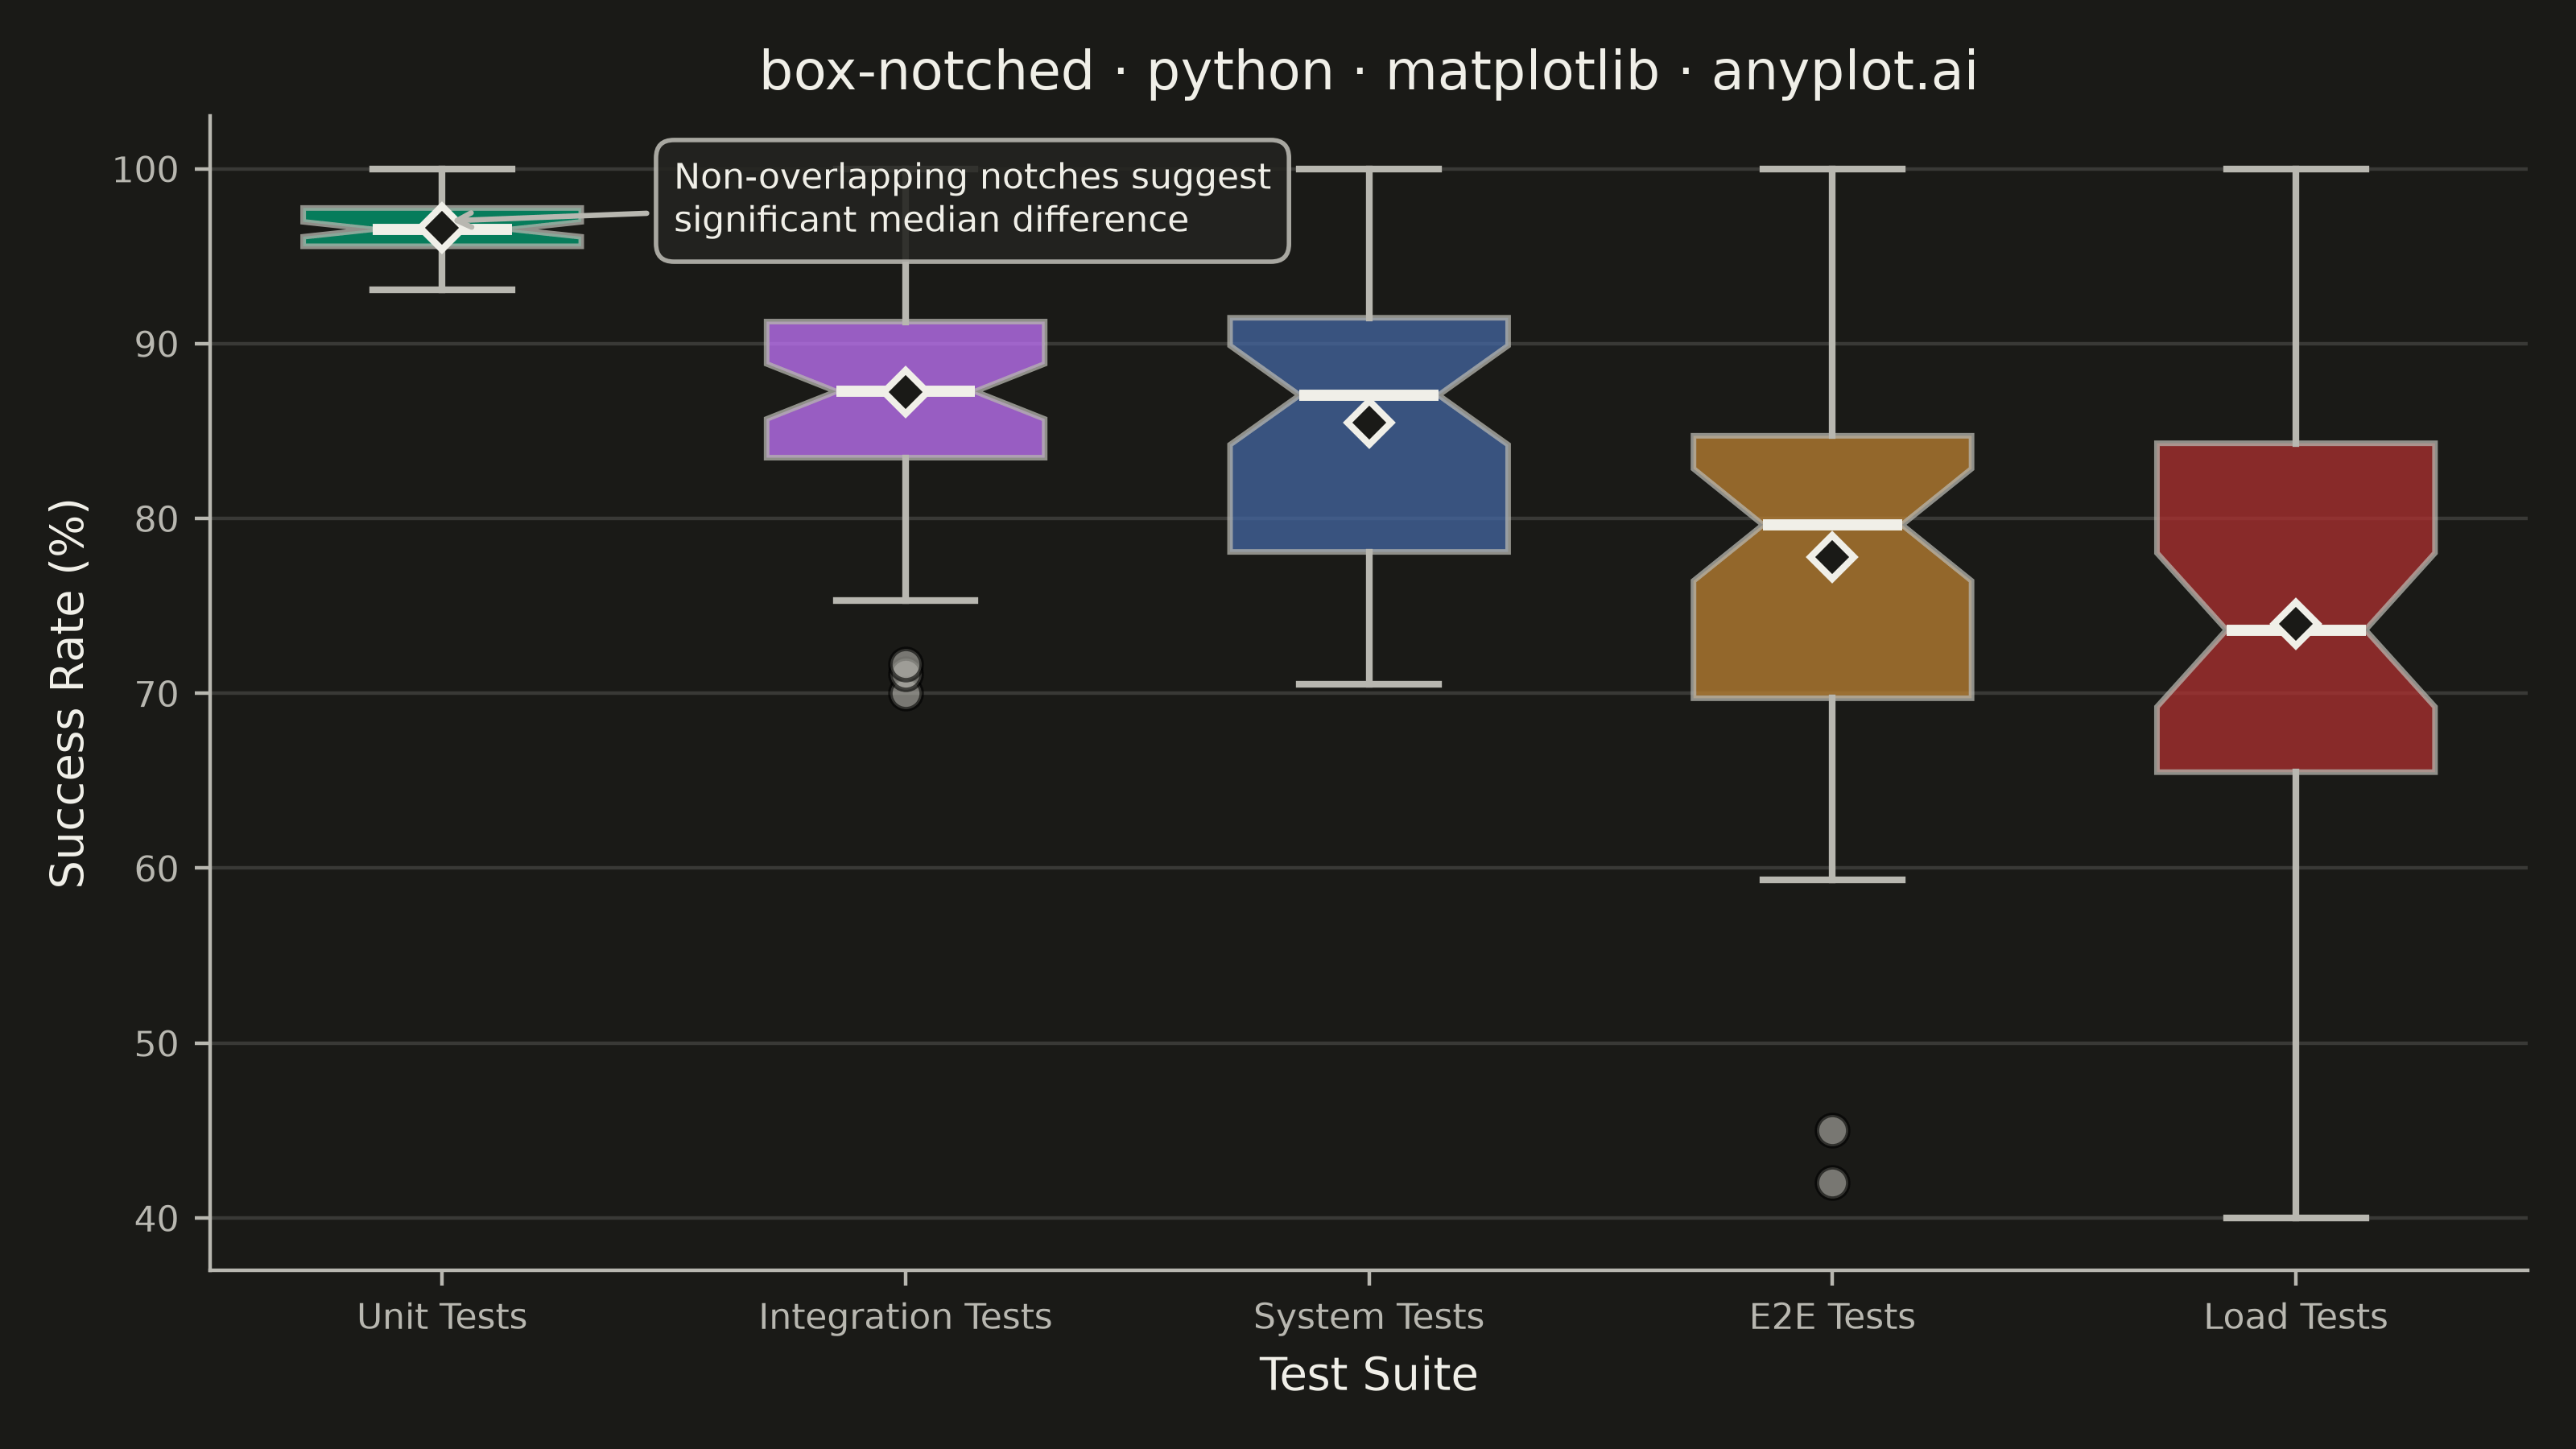
A notched box plot extends the standard box plot by adding notches around the median that represent a confidence interval. If the notches of two boxes do not overlap, this provides visual evidence that the medians differ significantly. This variant is particularly valuable for quick visual hypothesis testing and comparing group medians in statistical analysis.
""" anyplot.ai
box-notched: Notched Box Plot
Library: matplotlib 3.11.1 | Python 3.13.15
Quality: 90/100 | Updated: 2026-08-18
"""

import os

import matplotlib.pyplot as plt
import numpy as np


# Theme tokens
THEME = os.getenv("ANYPLOT_THEME", "light")
PAGE_BG = "#FAF8F1" if THEME == "light" else "#1A1A17"
ELEVATED_BG = "#FFFDF6" if THEME == "light" else "#242420"
INK = "#1A1A17" if THEME == "light" else "#F0EFE8"
INK_SOFT = "#4A4A44" if THEME == "light" else "#B8B7B0"

# Imprint palette - first series is always brand green
IMPRINT = ["#009E73", "#C475FD", "#4467A3", "#BD8233", "#AE3030"]

# Data - Test success rates across different test suites
np.random.seed(42)

# Unit Tests: High success rate, tight distribution
unit_tests = np.random.normal(loc=97, scale=2, size=65)
unit_tests = np.clip(unit_tests, 90, 100)

# Integration Tests: Medium-high success rate, wider spread
integration_tests = np.random.normal(loc=87, scale=8, size=60)
integration_tests = np.clip(integration_tests, 70, 100)

# System Tests: Medium success rate, similar to integration (overlapping notches expected)
system_tests = np.random.normal(loc=85, scale=9, size=55)
system_tests = np.clip(system_tests, 65, 100)

# E2E Tests: Lower success rate with some outliers
e2e_base = np.random.normal(loc=78, scale=10, size=50)
e2e_outliers = np.array([98, 99, 45, 42])
e2e_tests = np.concatenate([e2e_base, e2e_outliers])
e2e_tests = np.clip(e2e_tests, 30, 100)

# Load Tests: Variable success rate due to infrastructure variance
load_tests = np.random.normal(loc=75, scale=12, size=45)
load_tests = np.clip(load_tests, 40, 100)

data = [unit_tests, integration_tests, system_tests, e2e_tests, load_tests]
test_suites = ["Unit Tests", "Integration Tests", "System Tests", "E2E Tests", "Load Tests"]

# Create plot
fig, ax = plt.subplots(figsize=(8, 4.5), dpi=400, facecolor=PAGE_BG)
ax.set_facecolor(PAGE_BG)

# Create notched boxplot; showmeans overlays a mean marker so viewers can
# compare central tendency against the median line (useful for the
# right-skewed E2E/Load suites, where outliers pull the mean off the median)
bp = ax.boxplot(
    data,
    notch=True,
    patch_artist=True,
    tick_labels=test_suites,
    widths=0.6,
    showfliers=True,
    showmeans=True,
    flierprops={"marker": "o", "markerfacecolor": INK_SOFT, "markersize": 7, "alpha": 0.6},
    medianprops={"color": INK, "linewidth": 2.5},
    meanprops={
        "marker": "D",
        "markerfacecolor": PAGE_BG,
        "markeredgecolor": INK,
        "markeredgewidth": 1.5,
        "markersize": 7,
    },
    whiskerprops={"color": INK_SOFT, "linewidth": 1.5},
    capprops={"color": INK_SOFT, "linewidth": 1.5},
    boxprops={"color": INK_SOFT, "linewidth": 1.25},
)

# Apply colors to boxes
for patch, color in zip(bp["boxes"], IMPRINT, strict=True):
    patch.set_facecolor(color)
    patch.set_alpha(0.75)
    patch.set_edgecolor(INK_SOFT)
    patch.set_linewidth(1.25)

# Labels and styling
ax.set_xlabel("Test Suite", fontsize=10, color=INK)
ax.set_ylabel("Success Rate (%)", fontsize=10, color=INK)
ax.set_title("box-notched · python · matplotlib · anyplot.ai", fontsize=12, fontweight="medium", color=INK)
ax.tick_params(axis="both", labelsize=8, colors=INK_SOFT, labelcolor=INK_SOFT)
ax.spines["top"].set_visible(False)
ax.spines["right"].set_visible(False)
for s in ("left", "bottom"):
    ax.spines[s].set_color(INK_SOFT)
ax.yaxis.grid(True, alpha=0.15, linewidth=0.8, color=INK)

# Add annotation explaining notches; xytext uses axes-fraction coords so the
# callout stays clear of the title above the axes regardless of data range
ax.annotate(
    "Non-overlapping notches suggest\nsignificant median difference",
    xy=(1, 97),
    xycoords="data",
    xytext=(0.2, 0.9),
    textcoords="axes fraction",
    fontsize=8,
    color=INK,
    arrowprops={"arrowstyle": "->", "color": INK_SOFT, "lw": 1.2},
    bbox={"boxstyle": "round,pad=0.5", "facecolor": ELEVATED_BG, "edgecolor": INK_SOFT, "alpha": 0.9},
)

plt.tight_layout()
plt.savefig(f"plot-{THEME}.png", dpi=400, facecolor=PAGE_BG)  # bbox_inches MUST stay default (None)
Runnable source as JSON, for any HTTP client: https://api.anyplot.ai/specs/box-notched/matplotlib/code. Any spec id and library id listed in llms-full.txt fit the same URL shape; every URL below is complete and callable.
{
  "spec_id": "box-notched",
  "language": "python",
  "library": "matplotlib",
  "page": "https://anyplot.ai/box-notched/python/matplotlib",
  "hub": "https://anyplot.ai/box-notched",
  "code_json": "https://api.anyplot.ai/specs/box-notched/matplotlib/code",
  "spec_json": "https://api.anyplot.ai/specs/box-notched",
  "render_light_png": "https://storage.googleapis.com/anyplot-images/plots/box-notched/python/matplotlib/plot-light.png",
  "render_dark_png": "https://storage.googleapis.com/anyplot-images/plots/box-notched/python/matplotlib/plot-dark.png",
  "quality_score": 90.0,
  "license": "MIT",
  "guide": "https://anyplot.ai/llms.txt"
}
Part of Notched Box Plot on anyplot.ai.