The same plot in 14 other libraries — JavaScript: Chart.js, D3.js, Apache ECharts, MUI X Charts; Python: Altair, Bokeh, lets-plot, Matplotlib, Plotly, plotnine, Pygal, Seaborn; R: ggplot2; Julia: Makie.jl. Compare all 15 side by side: Notched Box Plot in Python, R, Julia and JavaScript.
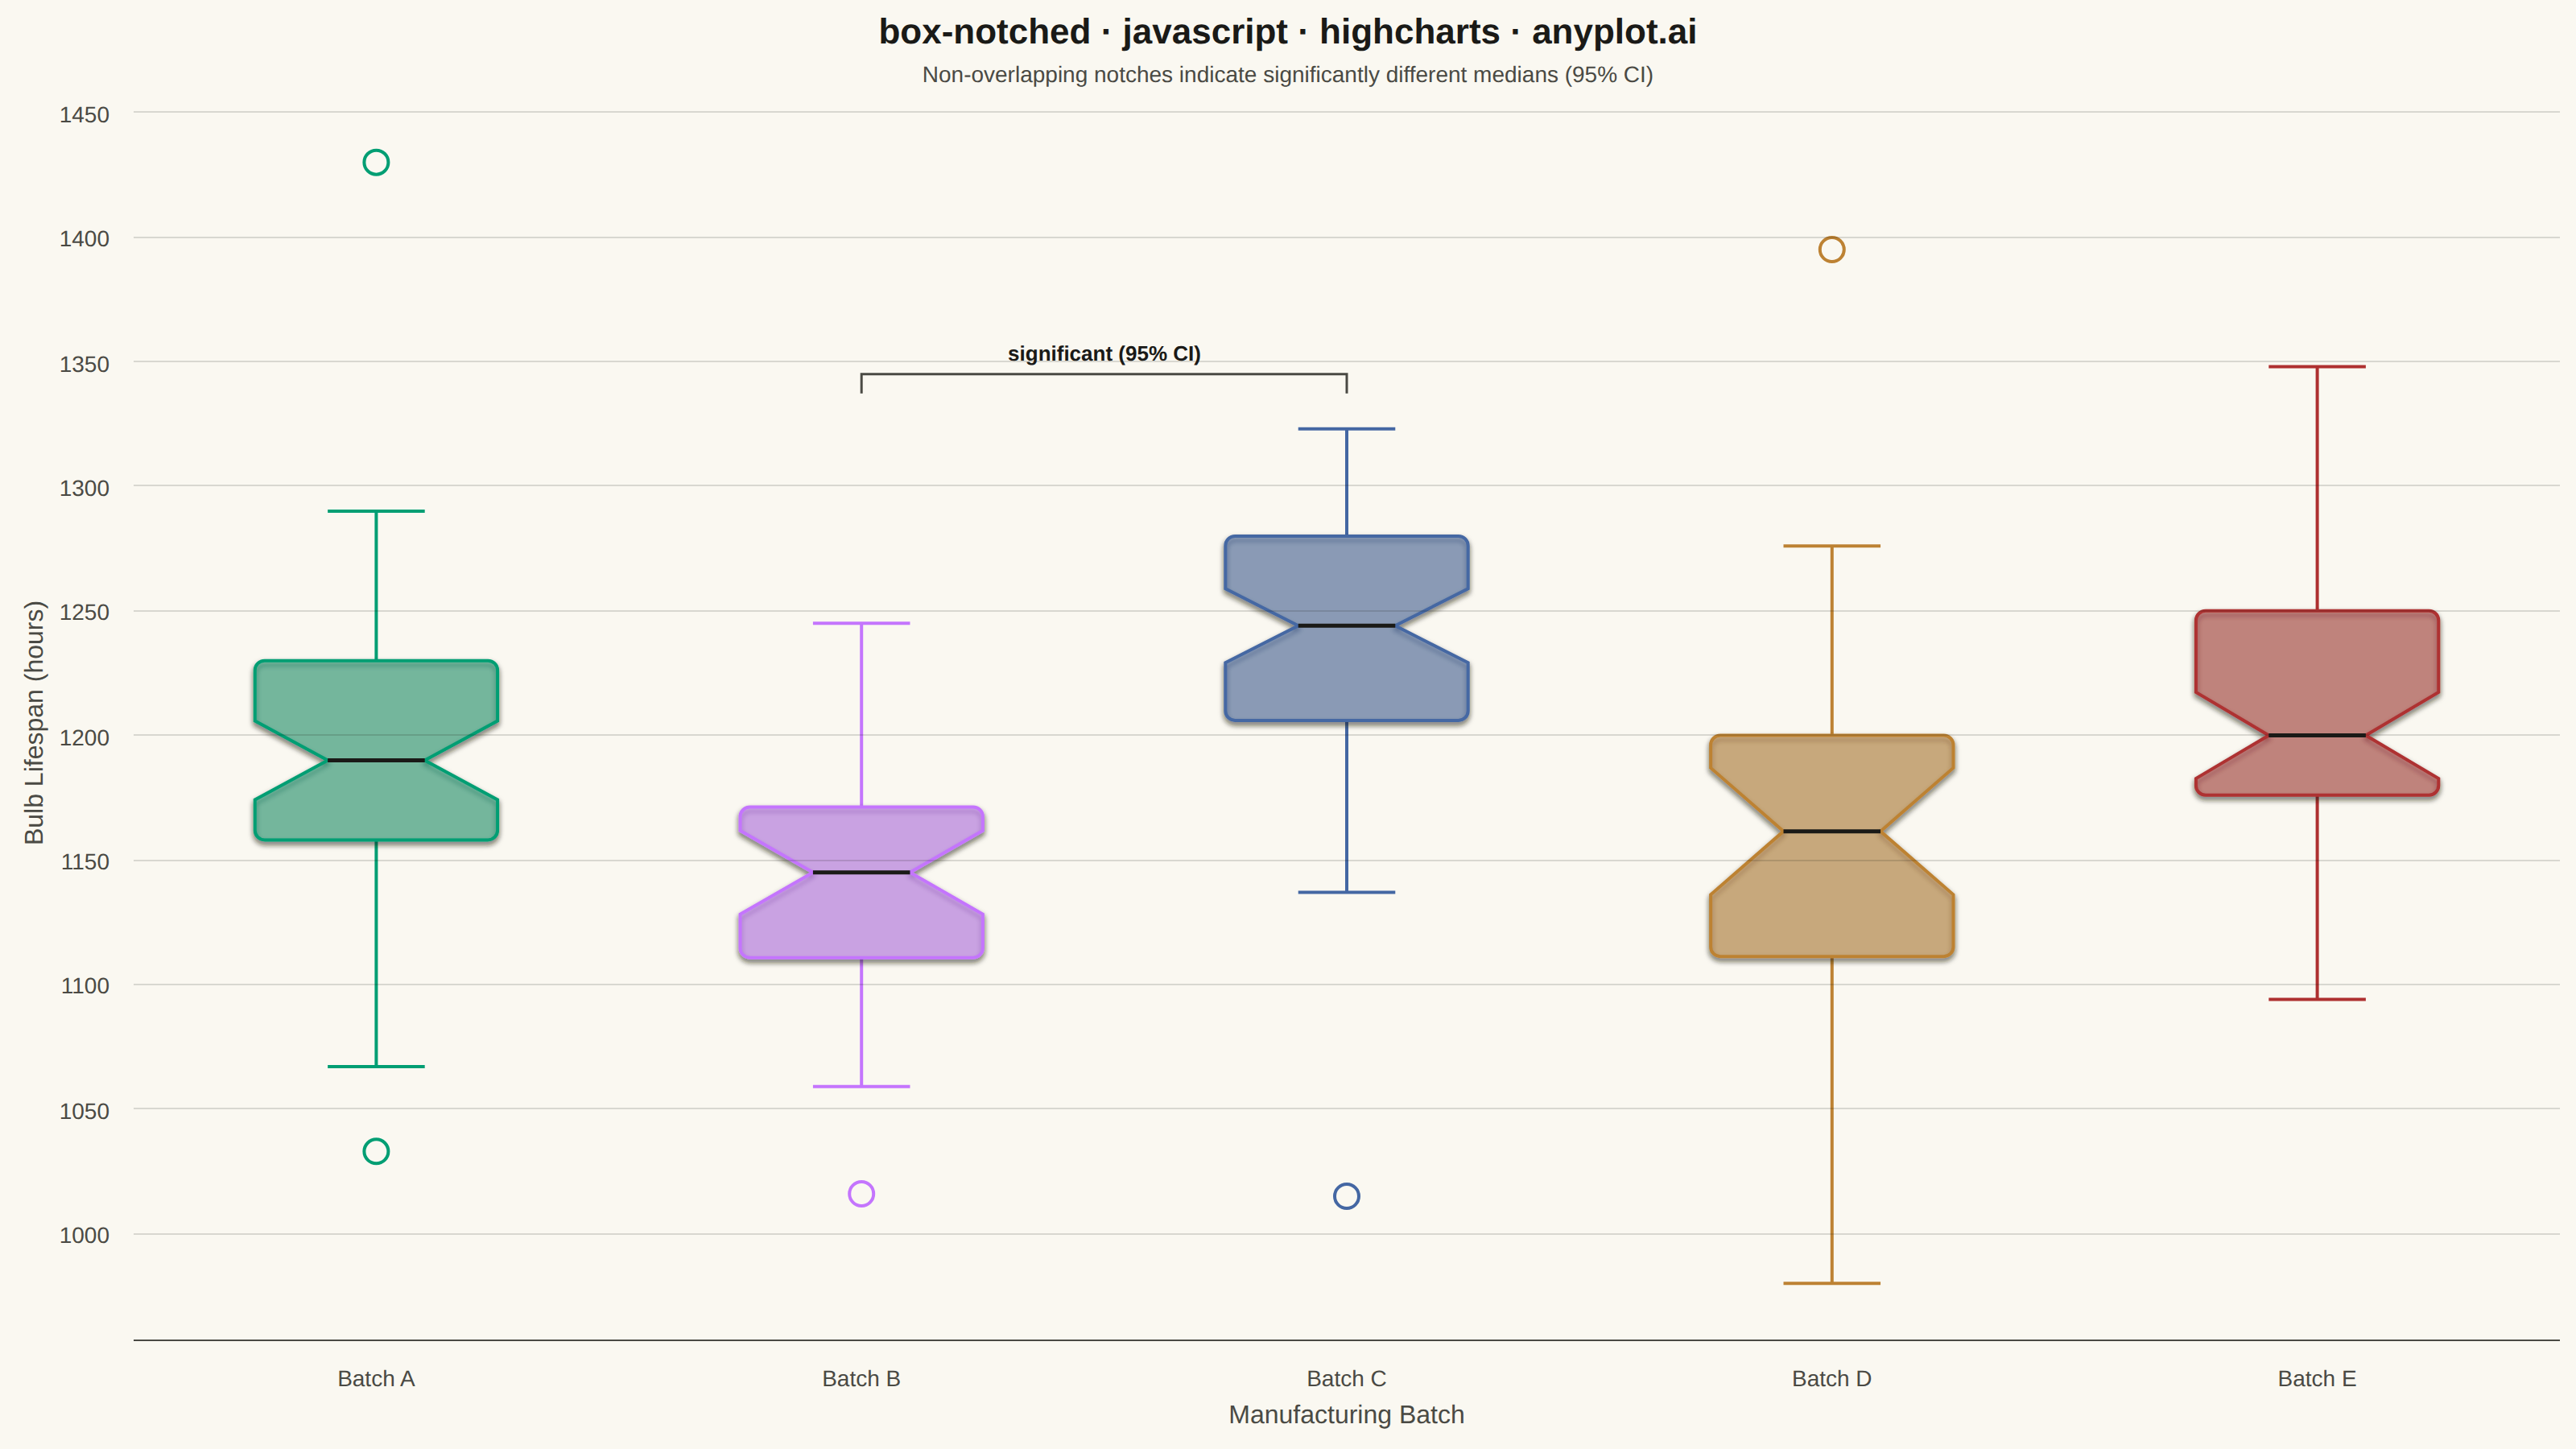
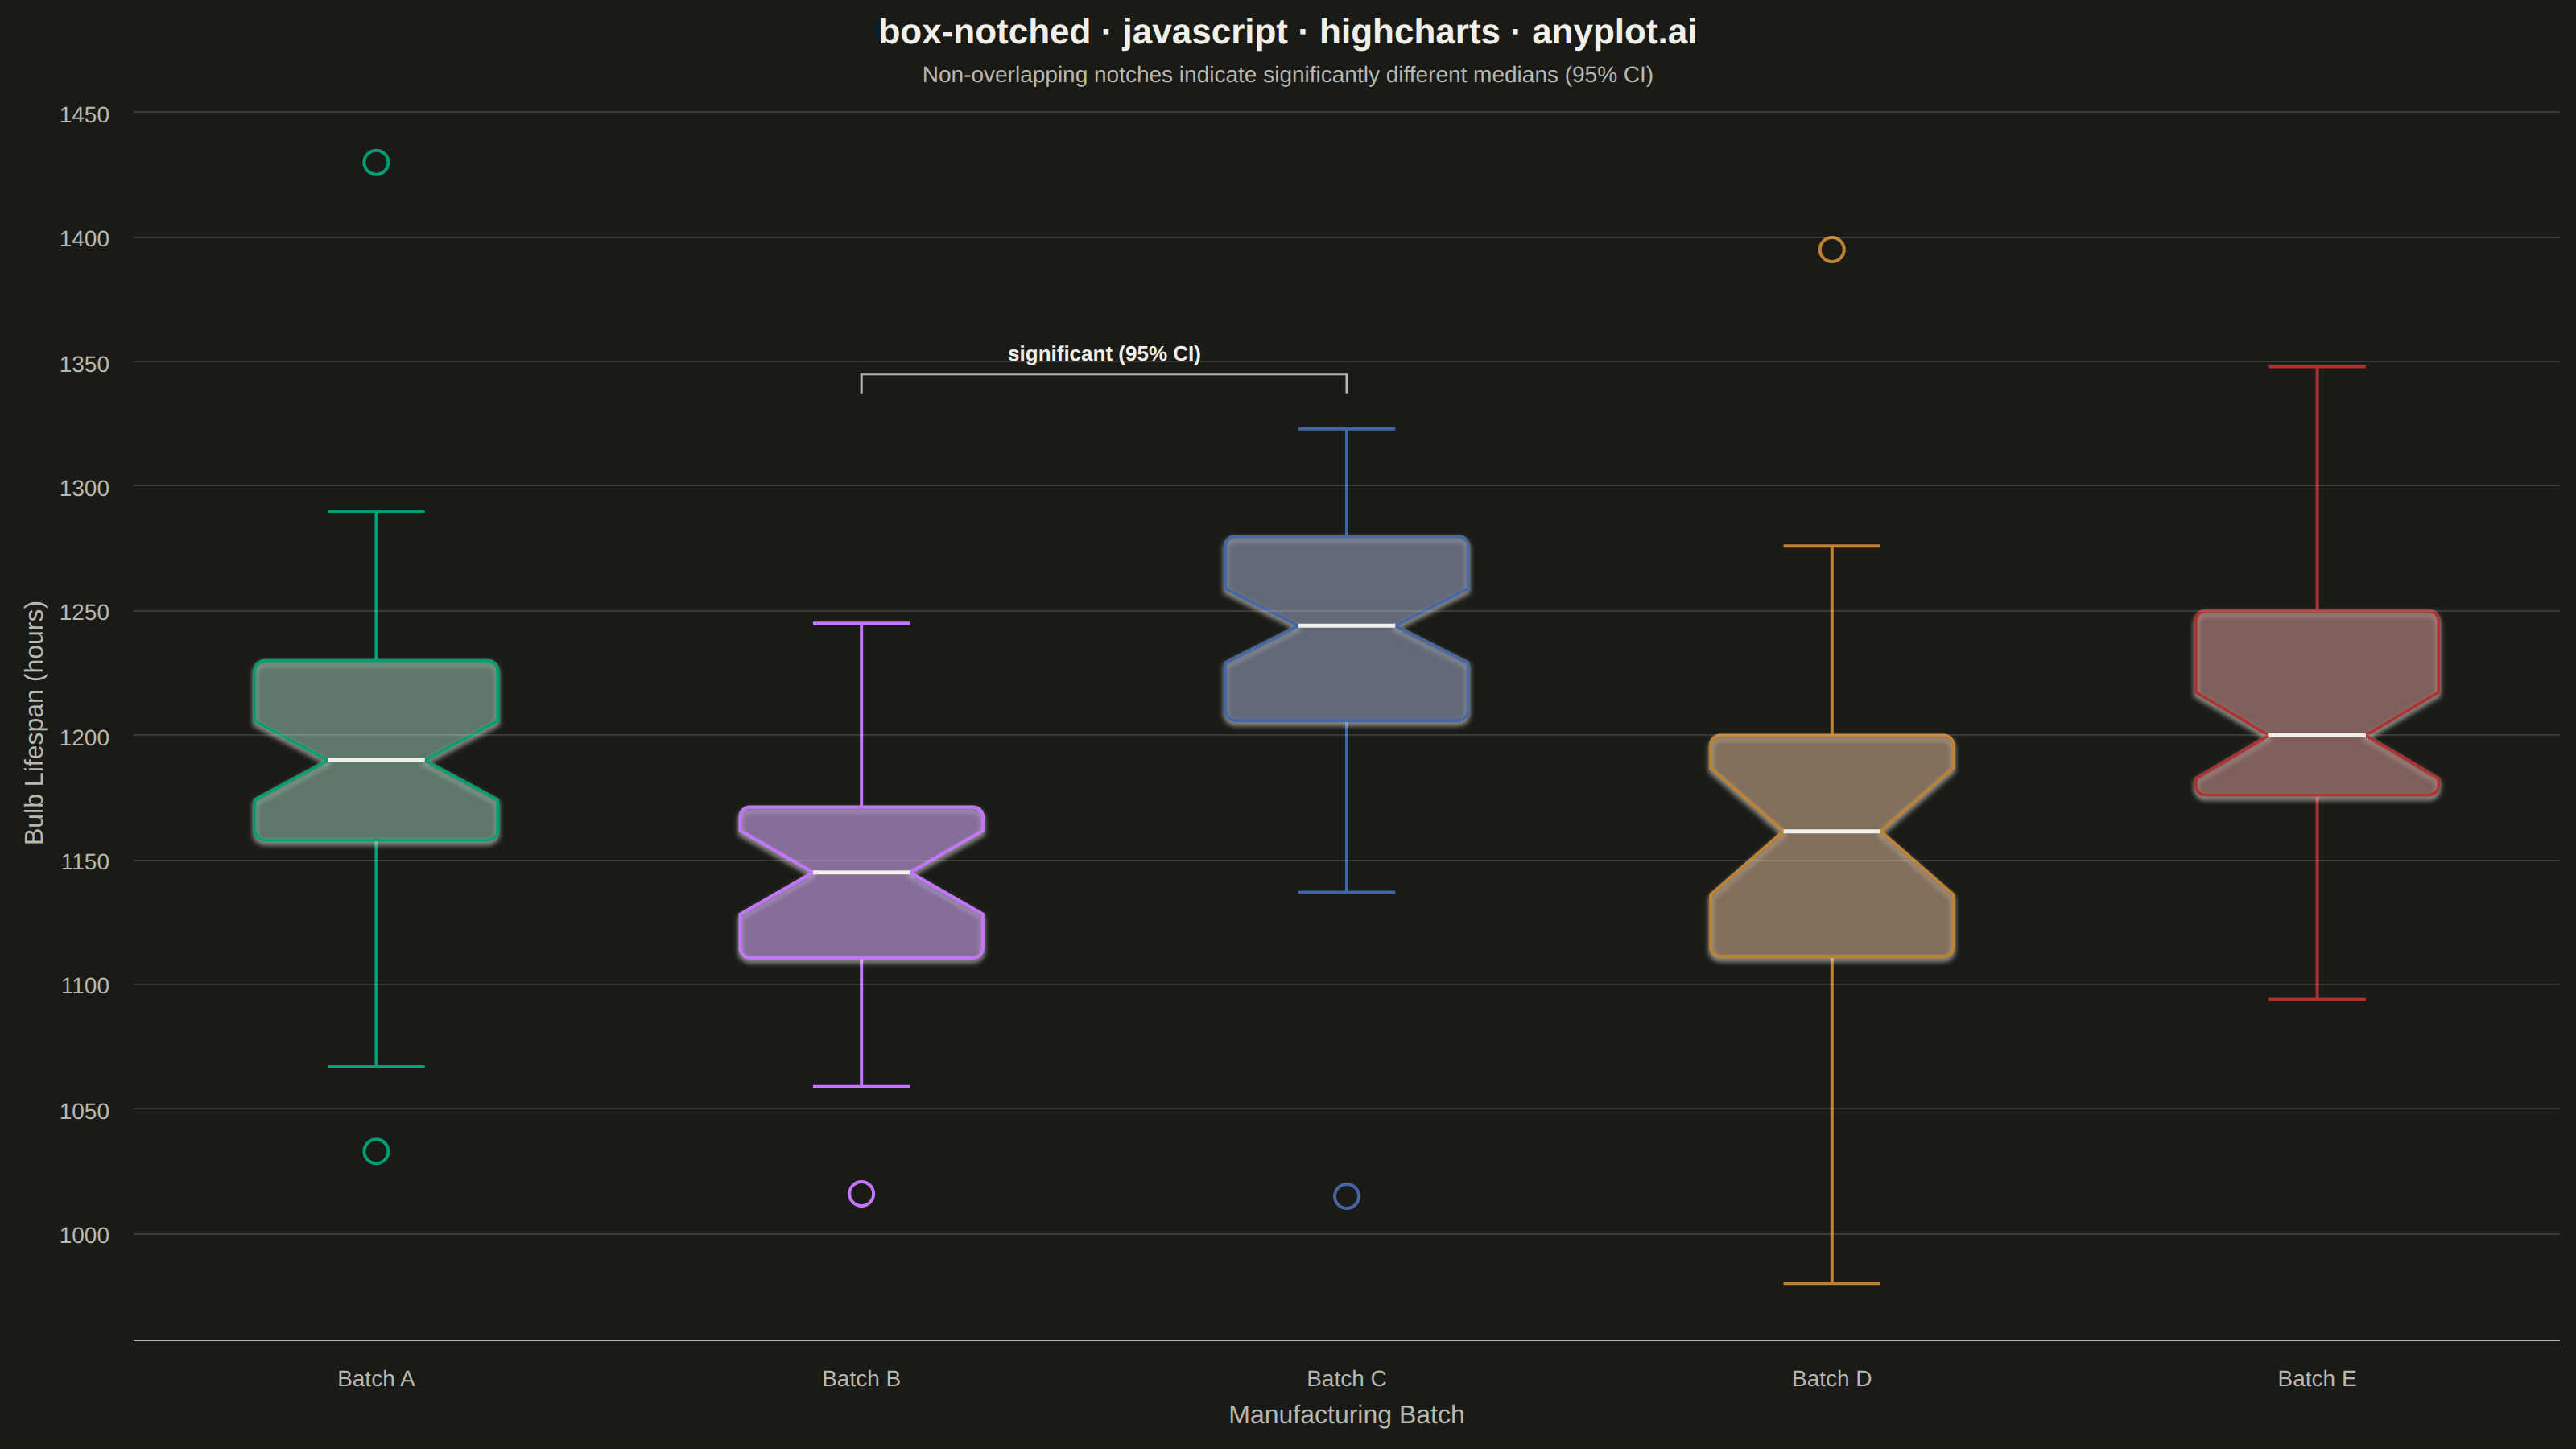
A notched box plot extends the standard box plot by adding notches around the median that represent a confidence interval. If the notches of two boxes do not overlap, this provides visual evidence that the medians differ significantly. This variant is particularly valuable for quick visual hypothesis testing and comparing group medians in statistical analysis.
// anyplot.ai
// box-notched: Notched Box Plot
// Library: highcharts 12.6.0 | JavaScript 22.23.2
// Quality: 94/100 | Created: 2026-08-18

const t = window.ANYPLOT_TOKENS;

// --- Data (in-memory, deterministic) ----------------------------------------
function makeLcg(seed) {
  let state = seed >>> 0;
  return function lcg() {
    state = (state * 1664525 + 1013904223) >>> 0;
    return state / 4294967296;
  };
}
const rand = makeLcg(42);

function randNormal(mean, std) {
  const u1 = Math.max(rand(), 1e-9);
  const u2 = rand();
  const z = Math.sqrt(-2 * Math.log(u1)) * Math.cos(2 * Math.PI * u2);
  return mean + z * std;
}

const categories = ["Batch A", "Batch B", "Batch C", "Batch D", "Batch E"];
const meanLifespans = [1180, 1155, 1240, 1150, 1205];
const stdLifespans = [55, 60, 50, 65, 58];
const sampleSizes = [50, 32, 60, 28, 45];

const rawSamples = categories.map((name, i) => {
  const values = [];
  for (let j = 0; j < sampleSizes[i]; j++) {
    values.push(Math.round(randNormal(meanLifespans[i], stdLifespans[i])));
  }
  return values;
});

// A handful of realistic outliers: an early failure and a long-lived unit
rawSamples[0].push(1430);
rawSamples[2].push(1015);
rawSamples[3].push(980, 1395);

function quantile(sorted, q) {
  const pos = (sorted.length - 1) * q;
  const base = Math.floor(pos);
  const rest = pos - base;
  return sorted[base + 1] !== undefined
    ? sorted[base] + rest * (sorted[base + 1] - sorted[base])
    : sorted[base];
}

const boxStats = rawSamples.map((values) => {
  const sorted = values.slice().sort((a, b) => a - b);
  const n = sorted.length;
  const q1 = quantile(sorted, 0.25);
  const median = quantile(sorted, 0.5);
  const q3 = quantile(sorted, 0.75);
  const iqr = q3 - q1;
  const lowFence = q1 - 1.5 * iqr;
  const highFence = q3 + 1.5 * iqr;
  const inFence = sorted.filter((v) => v >= lowFence && v <= highFence);
  const outliers = sorted.filter((v) => v < lowFence || v > highFence);
  const notch = (1.57 * iqr) / Math.sqrt(n);
  return {
    q1,
    median,
    q3,
    whiskerLow: Math.min(...inFence),
    whiskerHigh: Math.max(...inFence),
    outliers,
    notchTop: Math.min(median + notch, q3),
    notchBottom: Math.max(median - notch, q1),
  };
});

const allValues = rawSamples.flat();
const valueRange = Math.max(...allValues) - Math.min(...allValues);
const yPad = valueRange * 0.05;
const yMin = Math.min(...allValues) - yPad;
const yMax = Math.max(...allValues) + yPad;

// Pick the pair of batches with the widest non-overlapping notch gap - the
// clearest "significantly different medians" claim - to call out visually.
function findMostSignificantPair(stats) {
  let best = null;
  for (let i = 0; i < stats.length; i++) {
    for (let j = i + 1; j < stats.length; j++) {
      const a = stats[i], b = stats[j];
      let gap = null;
      if (a.notchTop < b.notchBottom) gap = b.notchBottom - a.notchTop;
      else if (b.notchTop < a.notchBottom) gap = a.notchBottom - b.notchTop;
      if (gap !== null && (!best || gap > best.gap)) best = { i, j, gap };
    }
  }
  return best;
}
const highlightPair = findMostSignificantPair(boxStats);

// --- Chart -------------------------------------------------------------------
let customGroup = null;

Highcharts.chart("container", {
  chart: {
    backgroundColor: "transparent",
    animation: false,
    style: { fontFamily: "inherit" },
    events: {
      render() {
        if (customGroup) customGroup.destroy();
        customGroup = this.renderer.g("notched-boxes").add();

        const xAxis = this.xAxis[0];
        const yAxis = this.yAxis[0];
        const slot = Math.abs(xAxis.toPixels(1, false) - xAxis.toPixels(0, false));
        const boxWidth = slot * 0.5;
        const notchInset = boxWidth * 0.3;
        const capWidth = boxWidth * 0.4;

        boxStats.forEach((s, i) => {
          const color = t.palette[i % t.palette.length];
          const xc = xAxis.toPixels(i, false);
          const left = xc - boxWidth / 2;
          const right = xc + boxWidth / 2;

          const yQ1 = yAxis.toPixels(s.q1, false);
          const yQ3 = yAxis.toPixels(s.q3, false);
          const yMed = yAxis.toPixels(s.median, false);
          const yNotchTop = yAxis.toPixels(s.notchTop, false);
          const yNotchBottom = yAxis.toPixels(s.notchBottom, false);
          const yWhiskerLow = yAxis.toPixels(s.whiskerLow, false);
          const yWhiskerHigh = yAxis.toPixels(s.whiskerHigh, false);

          // Whiskers + caps
          this.renderer
            .path(["M", xc, yQ3, "L", xc, yWhiskerHigh])
            .attr({ "stroke-width": 2, stroke: color, zIndex: 3 })
            .add(customGroup);
          this.renderer
            .path(["M", xc, yQ1, "L", xc, yWhiskerLow])
            .attr({ "stroke-width": 2, stroke: color, zIndex: 3 })
            .add(customGroup);
          this.renderer
            .path(["M", xc - capWidth / 2, yWhiskerHigh, "L", xc + capWidth / 2, yWhiskerHigh])
            .attr({ "stroke-width": 2, stroke: color, zIndex: 3 })
            .add(customGroup);
          this.renderer
            .path(["M", xc - capWidth / 2, yWhiskerLow, "L", xc + capWidth / 2, yWhiskerLow])
            .attr({ "stroke-width": 2, stroke: color, zIndex: 3 })
            .add(customGroup);

          // Notched box body — hourglass waist marks the median CI, with
          // gently rounded outer corners for a more polished, less "default"
          // silhouette.
          const r = Math.min(6, boxWidth * 0.15, notchInset * 0.6);
          this.renderer
            .path([
              "M", left + r, yQ3,
              "L", right - r, yQ3,
              "A", r, r, 0, 0, 1, right, yQ3 + r,
              "L", right, yNotchTop,
              "L", right - notchInset, yMed,
              "L", right, yNotchBottom,
              "L", right, yQ1 - r,
              "A", r, r, 0, 0, 1, right - r, yQ1,
              "L", left + r, yQ1,
              "A", r, r, 0, 0, 1, left, yQ1 - r,
              "L", left, yNotchBottom,
              "L", left + notchInset, yMed,
              "L", left, yNotchTop,
              "L", left, yQ3 + r,
              "A", r, r, 0, 0, 1, left + r, yQ3,
              "Z",
            ])
            .attr({
              fill: Highcharts.color(color).setOpacity(0.4).get(),
              stroke: color,
              "stroke-width": 2,
              zIndex: 4,
            })
            .shadow({ color: t.ink, offsetX: 0, offsetY: 2, opacity: 0.15, width: 3 })
            .add(customGroup);

          // Median line through the notch waist
          this.renderer
            .path(["M", left + notchInset, yMed, "L", right - notchInset, yMed])
            .attr({ "stroke-width": 2.5, stroke: t.ink, zIndex: 5 })
            .add(customGroup);

          // Outliers
          s.outliers.forEach((v) => {
            this.renderer
              .circle(xc, yAxis.toPixels(v, false), 7.5)
              .attr({ fill: t.pageBg, stroke: color, "stroke-width": 2, zIndex: 6 })
              .add(customGroup);
          });
        });

        // Significance bracket: make the "non-overlapping notches" claim
        // visible directly on the chart for the most clearly separated pair.
        if (highlightPair) {
          const { i, j } = highlightPair;
          const x1 = xAxis.toPixels(i, false);
          const x2 = xAxis.toPixels(j, false);
          const topPixel = Math.min(
            yAxis.toPixels(boxStats[i].whiskerHigh, false),
            yAxis.toPixels(boxStats[j].whiskerHigh, false)
          );
          const barY = topPixel - 34;
          const tick = 12;

          this.renderer
            .path(["M", x1, barY + tick, "L", x1, barY, "L", x2, barY, "L", x2, barY + tick])
            .attr({ "stroke-width": 1.5, stroke: t.inkSoft, zIndex: 7, fill: "none" })
            .add(customGroup);
          this.renderer
            .text("significant (95% CI)", (x1 + x2) / 2, barY - 8)
            .attr({ align: "center", zIndex: 7 })
            .css({ color: t.ink, fontSize: "13px", fontWeight: "600" })
            .add(customGroup);
        }
      },
    },
  },
  credits: { enabled: false },
  colors: t.palette,
  title: {
    text: "box-notched · javascript · highcharts · anyplot.ai",
    style: { color: t.ink, fontSize: "22px", fontWeight: "600" },
  },
  subtitle: {
    text: "Non-overlapping notches indicate significantly different medians (95% CI)",
    style: { color: t.inkSoft, fontSize: "14px" },
  },
  xAxis: {
    categories,
    title: { text: "Manufacturing Batch", style: { color: t.inkSoft, fontSize: "16px" } },
    lineColor: t.inkSoft,
    tickColor: t.inkSoft,
    labels: { style: { color: t.inkSoft, fontSize: "14px" } },
  },
  yAxis: {
    min: yMin,
    max: yMax,
    startOnTick: false,
    endOnTick: false,
    title: { text: "Bulb Lifespan (hours)", style: { color: t.inkSoft, fontSize: "16px" } },
    gridLineColor: t.grid,
    labels: { style: { color: t.inkSoft, fontSize: "14px" } },
  },
  legend: { enabled: false },
  tooltip: { enabled: false },
  plotOptions: { series: { animation: false } },
  series: [
    {
      type: "scatter",
      name: "Median",
      data: boxStats.map((s, i) => ({ x: i, y: s.median })),
      marker: { enabled: false },
      enableMouseTracking: false,
      showInLegend: false,
    },
  ],
});
Runnable source as JSON, for any HTTP client: https://api.anyplot.ai/specs/box-notched/highcharts/code. Any spec id and library id listed in llms-full.txt fit the same URL shape; every URL below is complete and callable.
{
  "spec_id": "box-notched",
  "language": "javascript",
  "library": "highcharts",
  "page": "https://anyplot.ai/box-notched/javascript/highcharts",
  "hub": "https://anyplot.ai/box-notched",
  "code_json": "https://api.anyplot.ai/specs/box-notched/highcharts/code",
  "spec_json": "https://api.anyplot.ai/specs/box-notched",
  "render_light_png": "https://storage.googleapis.com/anyplot-images/plots/box-notched/javascript/highcharts/plot-light.png",
  "render_dark_png": "https://storage.googleapis.com/anyplot-images/plots/box-notched/javascript/highcharts/plot-dark.png",
  "interactive_light_html": "https://storage.googleapis.com/anyplot-images/plots/box-notched/javascript/highcharts/plot-light.html",
  "interactive_dark_html": "https://storage.googleapis.com/anyplot-images/plots/box-notched/javascript/highcharts/plot-dark.html",
  "quality_score": 94.0,
  "license": "MIT",
  "guide": "https://anyplot.ai/llms.txt"
}
Part of Notched Box Plot on anyplot.ai.