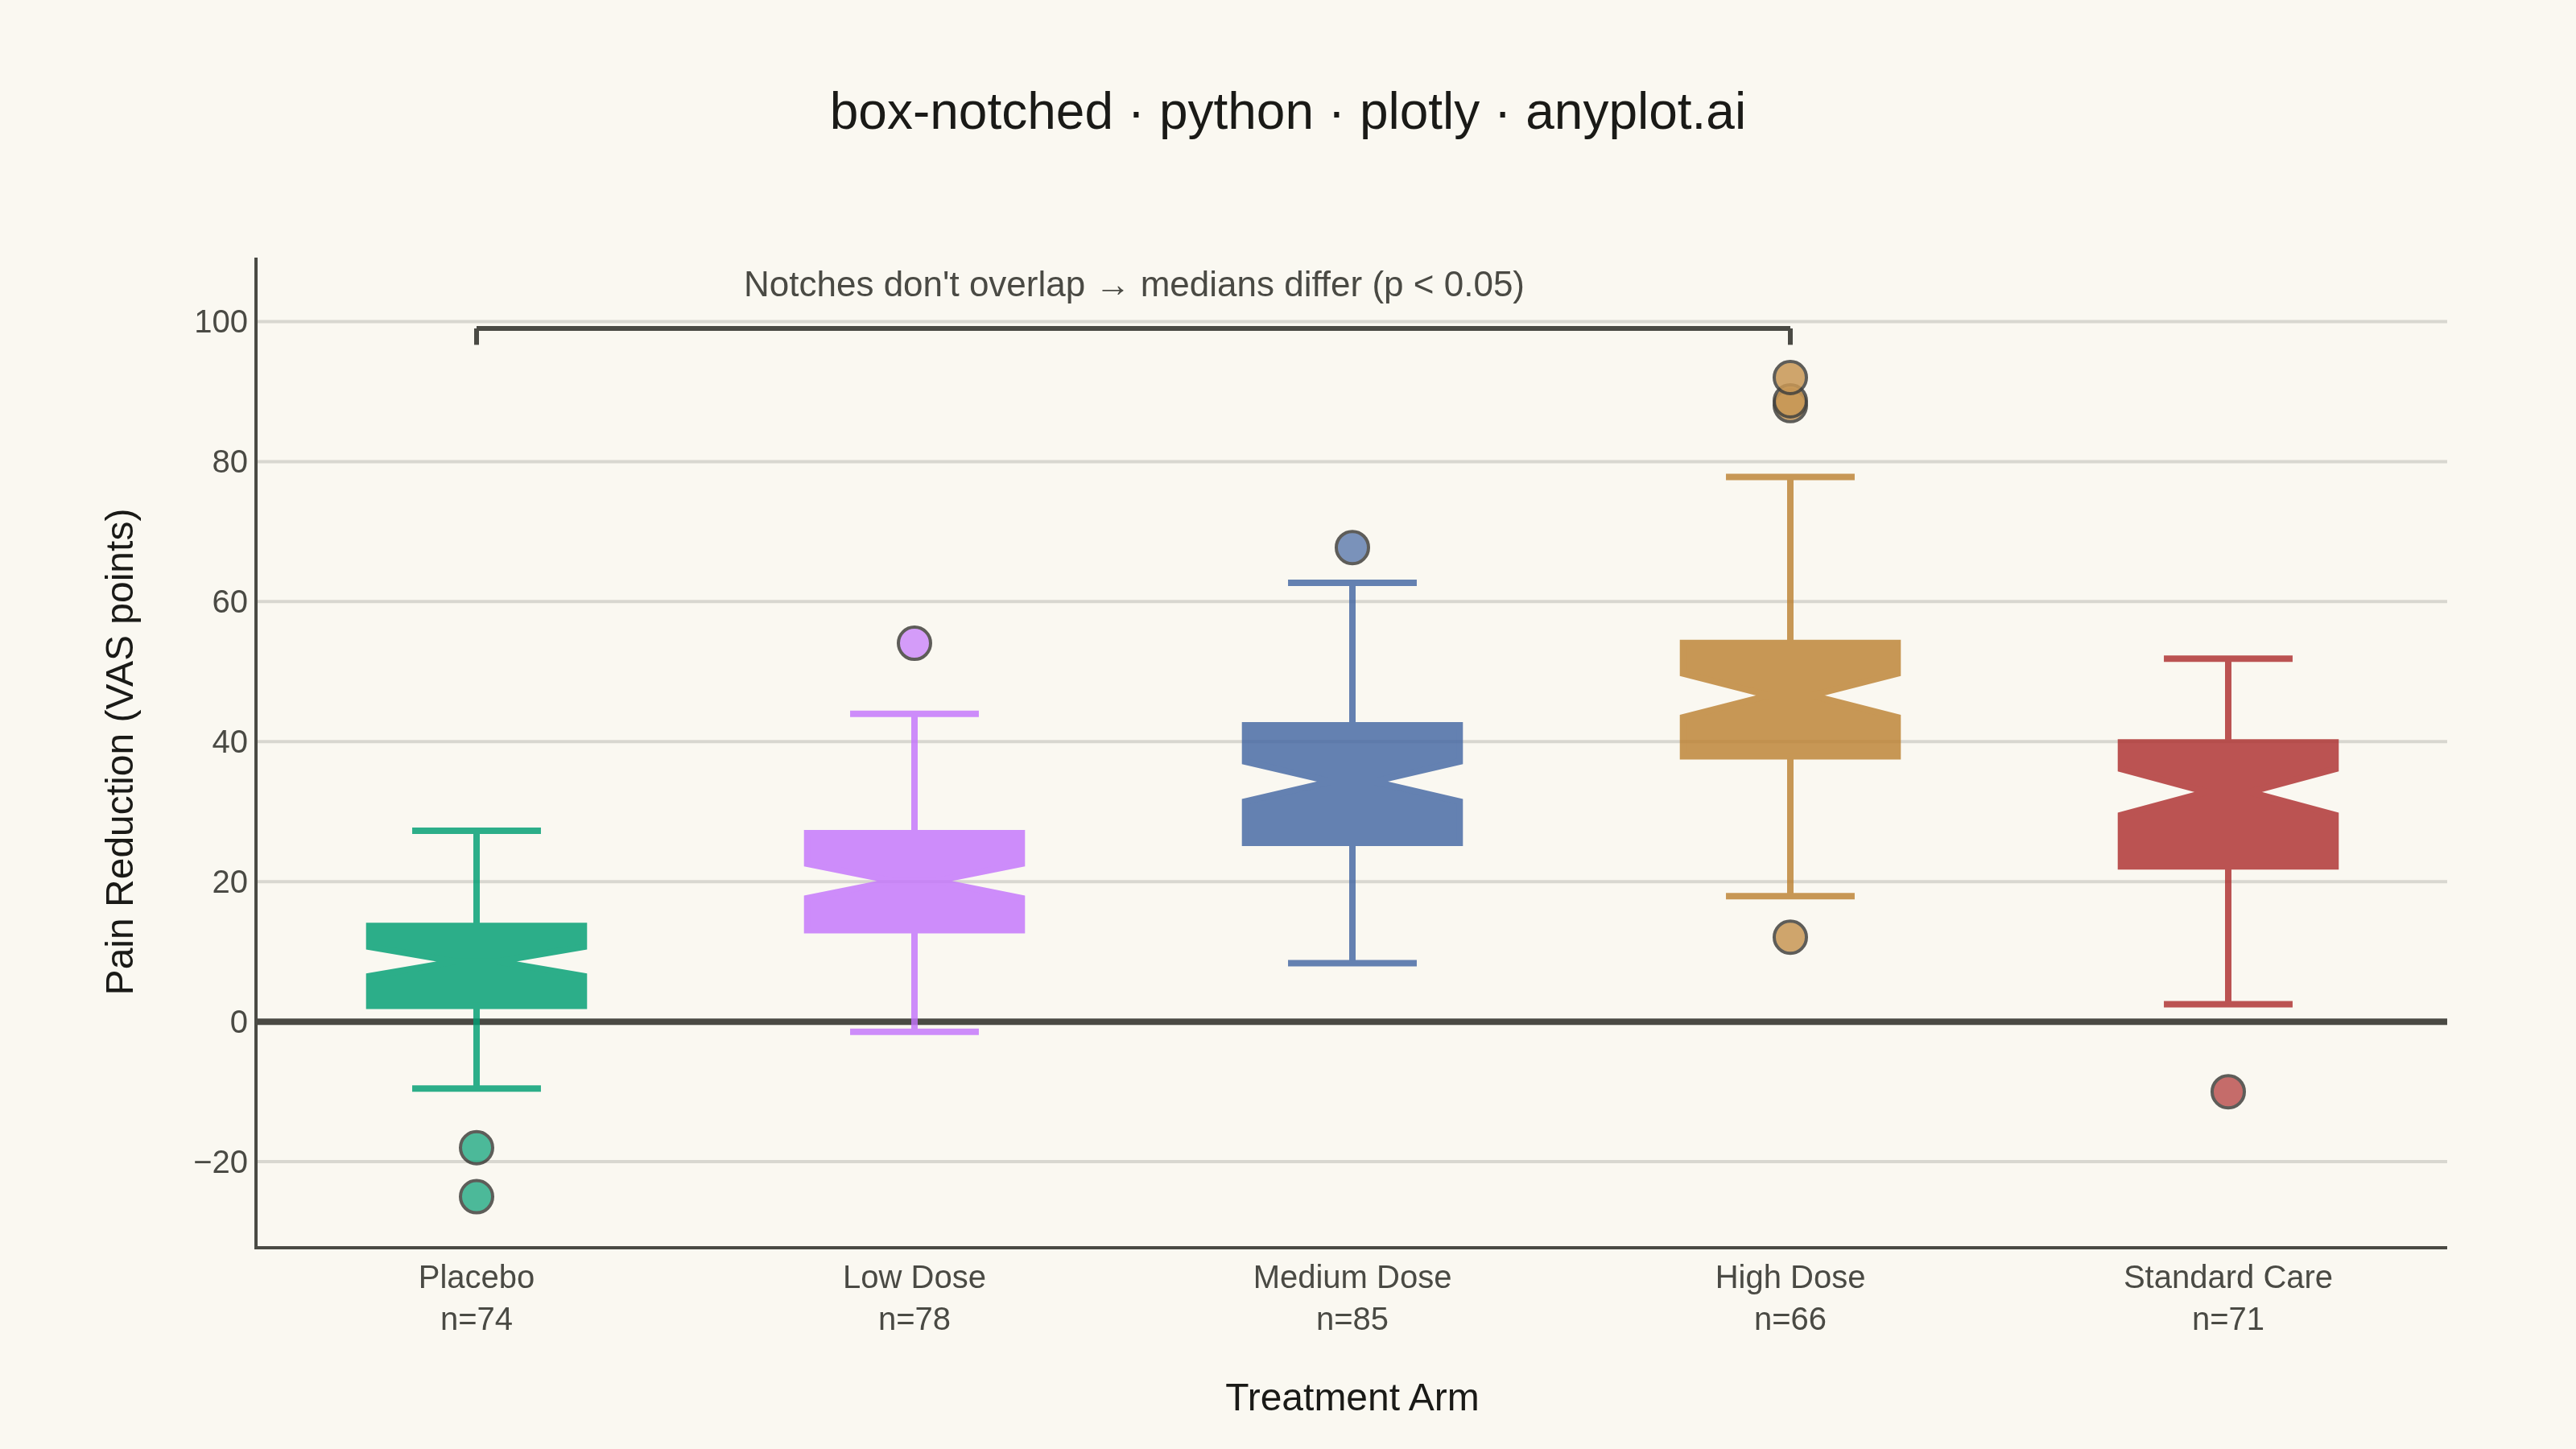
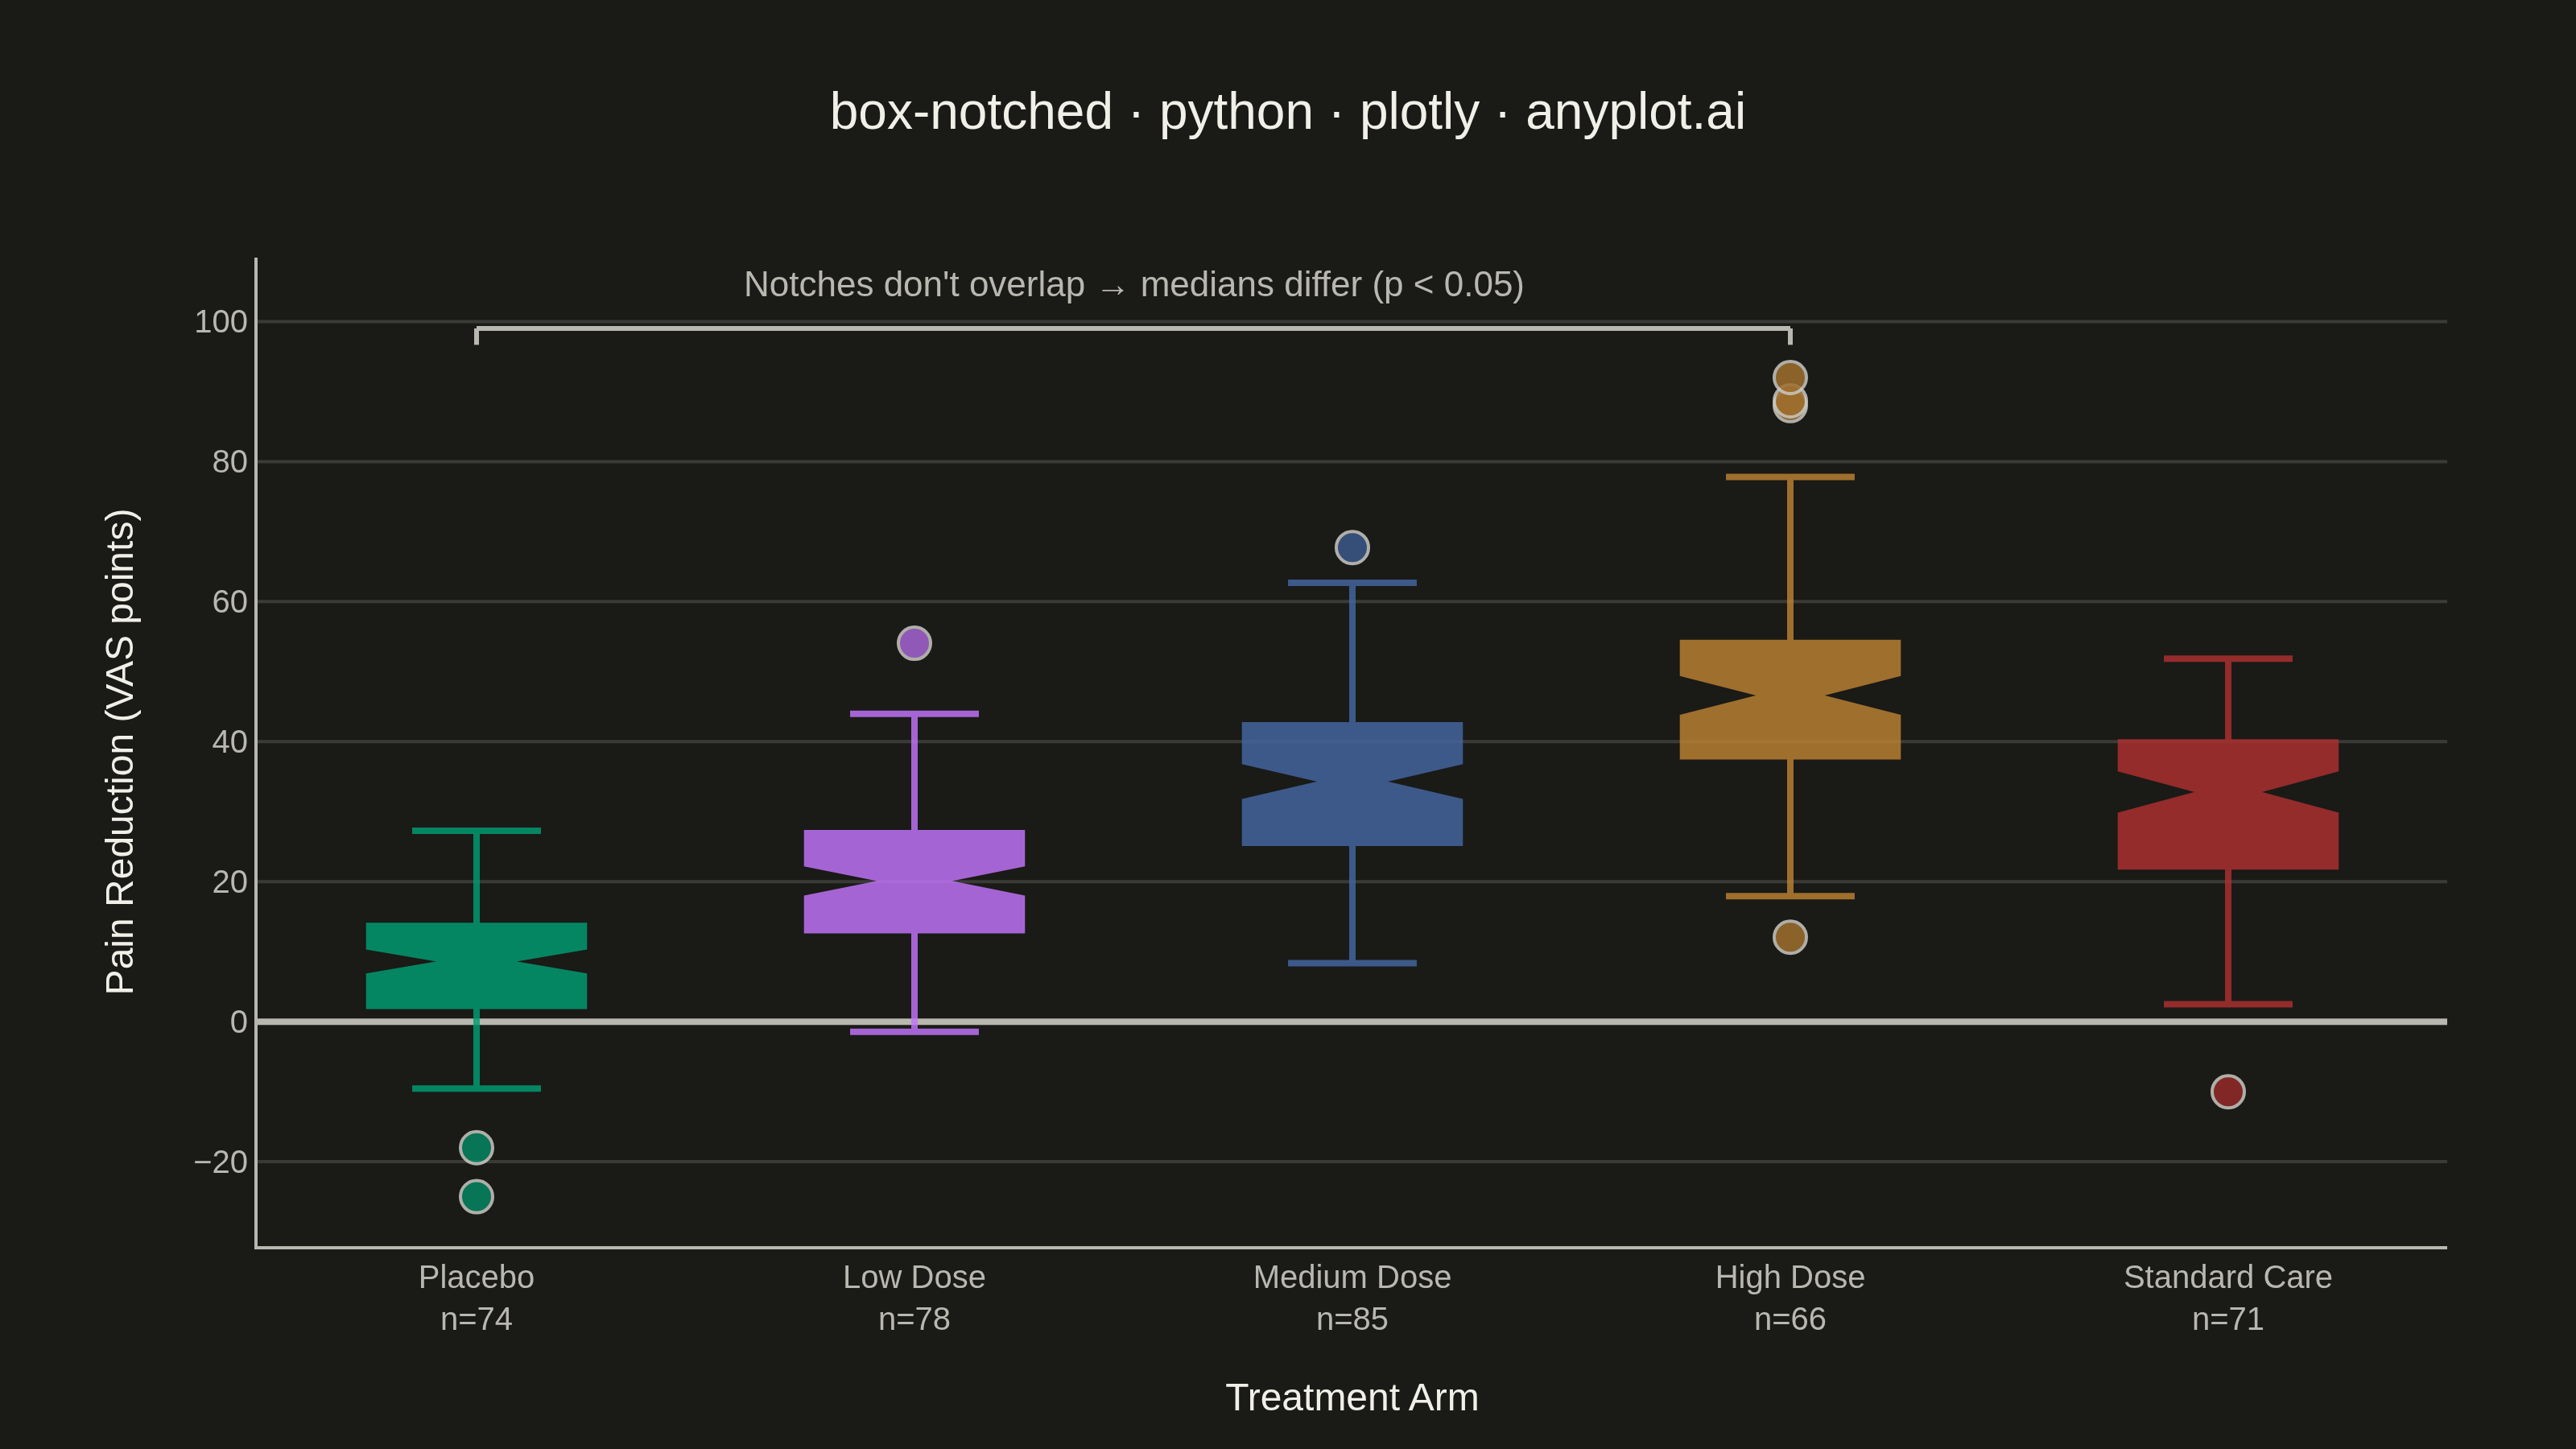
A notched box plot extends the standard box plot by adding notches around the median that represent a confidence interval. If the notches of two boxes do not overlap, this provides visual evidence that the medians differ significantly. This variant is particularly valuable for quick visual hypothesis testing and comparing group medians in statistical analysis.
""" anyplot.ai
box-notched: Notched Box Plot
Library: plotly 6.9.0 | Python 3.13.15
Quality: 95/100 | Updated: 2026-08-18
"""

import os

import numpy as np
import plotly.graph_objects as go


# Theme tokens (Imprint style guide — theme-adaptive chrome)
THEME = os.getenv("ANYPLOT_THEME", "light")
PAGE_BG = "#FAF8F1" if THEME == "light" else "#1A1A17"
INK = "#1A1A17" if THEME == "light" else "#F0EFE8"
INK_SOFT = "#4A4A44" if THEME == "light" else "#B8B7B0"
GRID = "rgba(26,26,23,0.15)" if THEME == "light" else "rgba(240,239,232,0.15)"

# Imprint categorical palette (first series always #009E73)
IMPRINT_PALETTE = ["#009E73", "#C475FD", "#4467A3", "#BD8233", "#AE3030"]

# Data - clinical trial pain-reduction scores (VAS points) across a
# placebo-controlled dose-escalation study with a standard-care comparator arm.
rng = np.random.default_rng(42)

arms = ["Placebo", "Low Dose", "Medium Dose", "High Dose", "Standard Care"]
arm_params = {
    "Placebo": (72, 8, 9),
    "Low Dose": (78, 22, 11),
    "Medium Dose": (85, 35, 13),
    "High Dose": (64, 48, 14),
    "Standard Care": (70, 30, 12),
}
outcome_data = {arm: rng.normal(mean, sd, n) for arm, (n, mean, sd) in arm_params.items()}

# Add outliers - placebo non-responders (pain worsened) and dose super-responders
outcome_data["Placebo"] = np.append(outcome_data["Placebo"], [-25, -18])
outcome_data["High Dose"] = np.append(outcome_data["High Dose"], [92, 88])
outcome_data["Standard Care"] = np.append(outcome_data["Standard Care"], [-10])


# Plot
fig = go.Figure()

for i, arm in enumerate(arms):
    values = outcome_data[arm]
    fig.add_trace(
        go.Box(
            y=values,
            x=[arm] * len(values),
            name=arm,
            boxpoints="outliers",
            notched=True,
            notchwidth=0.4,
            whiskerwidth=0.6,
            quartilemethod="linear",
            marker=dict(color=IMPRINT_PALETTE[i], size=10, opacity=0.85, line=dict(color=INK, width=1)),
            line=dict(width=2),
            fillcolor=IMPRINT_PALETTE[i],
            opacity=0.82,
            hovertemplate=f"<b>{arm}</b><br>Pain reduction: %{{y:.1f}} pts<extra></extra>",
        )
    )

# Visual hypothesis test: annotate the Placebo vs. High Dose comparison with a
# significance bracket whenever the notches (95% CI around the median) don't
# overlap - the core reason a notched box plot exists.
placebo_q1, placebo_median, placebo_q3 = np.percentile(outcome_data["Placebo"], [25, 50, 75])
placebo_half = 1.57 * (placebo_q3 - placebo_q1) / np.sqrt(len(outcome_data["Placebo"]))
high_dose_q1, high_dose_median, high_dose_q3 = np.percentile(outcome_data["High Dose"], [25, 50, 75])
high_dose_half = 1.57 * (high_dose_q3 - high_dose_q1) / np.sqrt(len(outcome_data["High Dose"]))
notches_overlap = (placebo_median + placebo_half) >= (high_dose_median - high_dose_half)

if not notches_overlap:
    data_span = max(v.max() for v in outcome_data.values()) - min(v.min() for v in outcome_data.values())
    bracket_y = max(outcome_data["Placebo"].max(), outcome_data["High Dose"].max()) + 0.06 * data_span
    tick = 0.02 * data_span
    placebo_x, high_dose_x = arms.index("Placebo"), arms.index("High Dose")
    for x0, x1 in [(placebo_x, placebo_x), (high_dose_x, high_dose_x), (placebo_x, high_dose_x)]:
        fig.add_shape(
            type="line",
            xref="x",
            yref="y",
            x0=x0,
            x1=x1,
            y0=bracket_y - tick if x0 == x1 else bracket_y,
            y1=bracket_y,
            line=dict(color=INK_SOFT, width=1.5),
        )
    fig.add_annotation(
        x=(placebo_x + high_dose_x) / 2,
        y=bracket_y,
        xref="x",
        yref="y",
        yshift=14,
        text="Notches don't overlap → medians differ (p < 0.05)",
        showarrow=False,
        font=dict(size=11, color=INK_SOFT),
    )

# Two-line tick labels surface sample size per arm, tying the chart back to the
# spec's "notch reliability improves with n > 20" note.
tick_text = [f"{arm}<br>n={len(outcome_data[arm])}" for arm in arms]

# Style
fig.update_layout(
    autosize=False,
    width=800,
    height=450,
    title=dict(
        text="box-notched · python · plotly · anyplot.ai", font=dict(size=16, color=INK), x=0.5, xanchor="center"
    ),
    xaxis=dict(
        title=dict(text="Treatment Arm", font=dict(size=12, color=INK)),
        tickmode="array",
        tickvals=list(range(len(arms))),
        ticktext=tick_text,
        tickfont=dict(size=10, color=INK_SOFT),
        showgrid=False,
        linecolor=INK_SOFT,
    ),
    yaxis=dict(
        title=dict(text="Pain Reduction (VAS points)", font=dict(size=12, color=INK)),
        tickfont=dict(size=10, color=INK_SOFT),
        gridcolor=GRID,
        linecolor=INK_SOFT,
        zerolinecolor=INK_SOFT,
    ),
    paper_bgcolor=PAGE_BG,
    plot_bgcolor=PAGE_BG,
    showlegend=False,
    margin=dict(l=80, r=40, t=80, b=60),
)

# Save - hard target 3200x1800 (landscape)
fig.write_image(f"plot-{THEME}.png", width=800, height=450, scale=4)
fig.write_html(f"plot-{THEME}.html", include_plotlyjs="cdn")
Runnable source as JSON, for any HTTP client: https://api.anyplot.ai/specs/box-notched/plotly/code. Any spec id and library id listed in llms-full.txt fit the same URL shape; every URL below is complete and callable.
{
  "spec_id": "box-notched",
  "language": "python",
  "library": "plotly",
  "page": "https://anyplot.ai/box-notched/python/plotly",
  "hub": "https://anyplot.ai/box-notched",
  "code_json": "https://api.anyplot.ai/specs/box-notched/plotly/code",
  "spec_json": "https://api.anyplot.ai/specs/box-notched",
  "render_light_png": "https://storage.googleapis.com/anyplot-images/plots/box-notched/python/plotly/plot-light.png",
  "render_dark_png": "https://storage.googleapis.com/anyplot-images/plots/box-notched/python/plotly/plot-dark.png",
  "interactive_light_html": "https://storage.googleapis.com/anyplot-images/plots/box-notched/python/plotly/plot-light.html",
  "interactive_dark_html": "https://storage.googleapis.com/anyplot-images/plots/box-notched/python/plotly/plot-dark.html",
  "quality_score": 95.0,
  "license": "MIT",
  "guide": "https://anyplot.ai/llms.txt"
}
Part of Notched Box Plot on anyplot.ai.