The same plot in 14 other libraries — Python: Altair, Bokeh, lets-plot, Matplotlib, Plotly, plotnine, Pygal, Seaborn; Julia: Makie.jl; JavaScript: Chart.js, D3.js, Apache ECharts, Highcharts, MUI X Charts. Compare all 15 side by side: Notched Box Plot in Python, R, Julia and JavaScript.
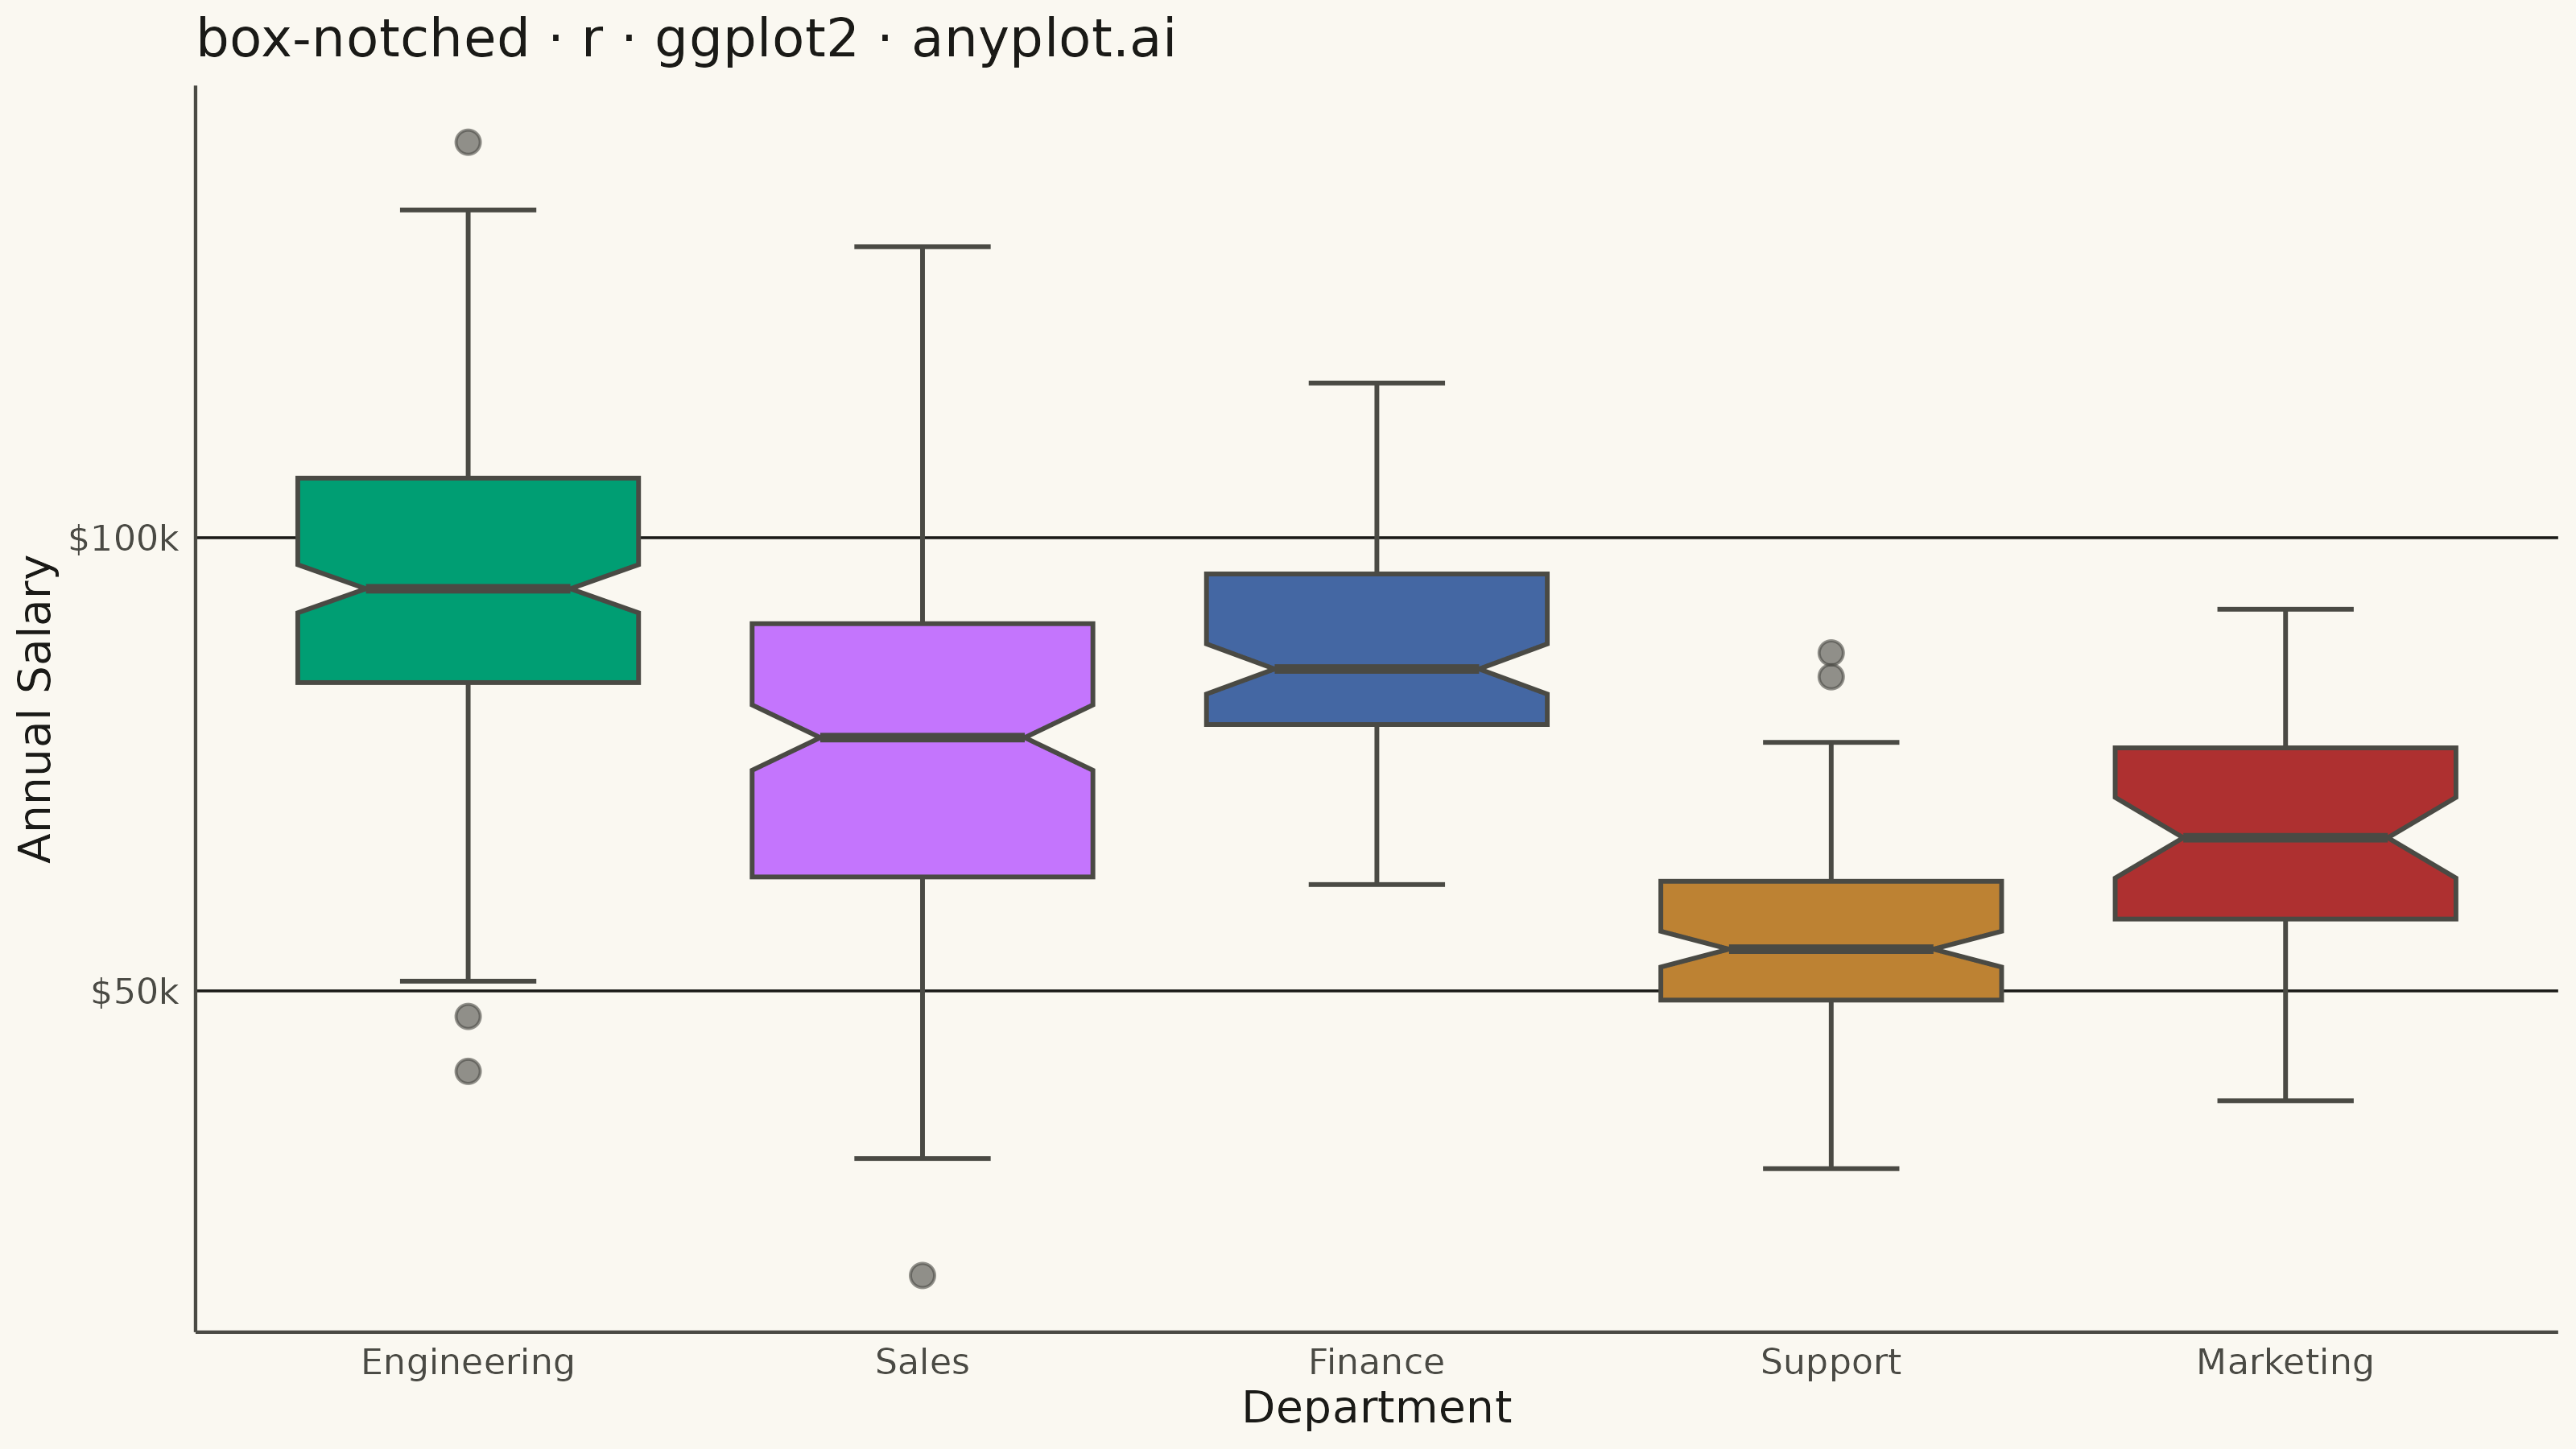
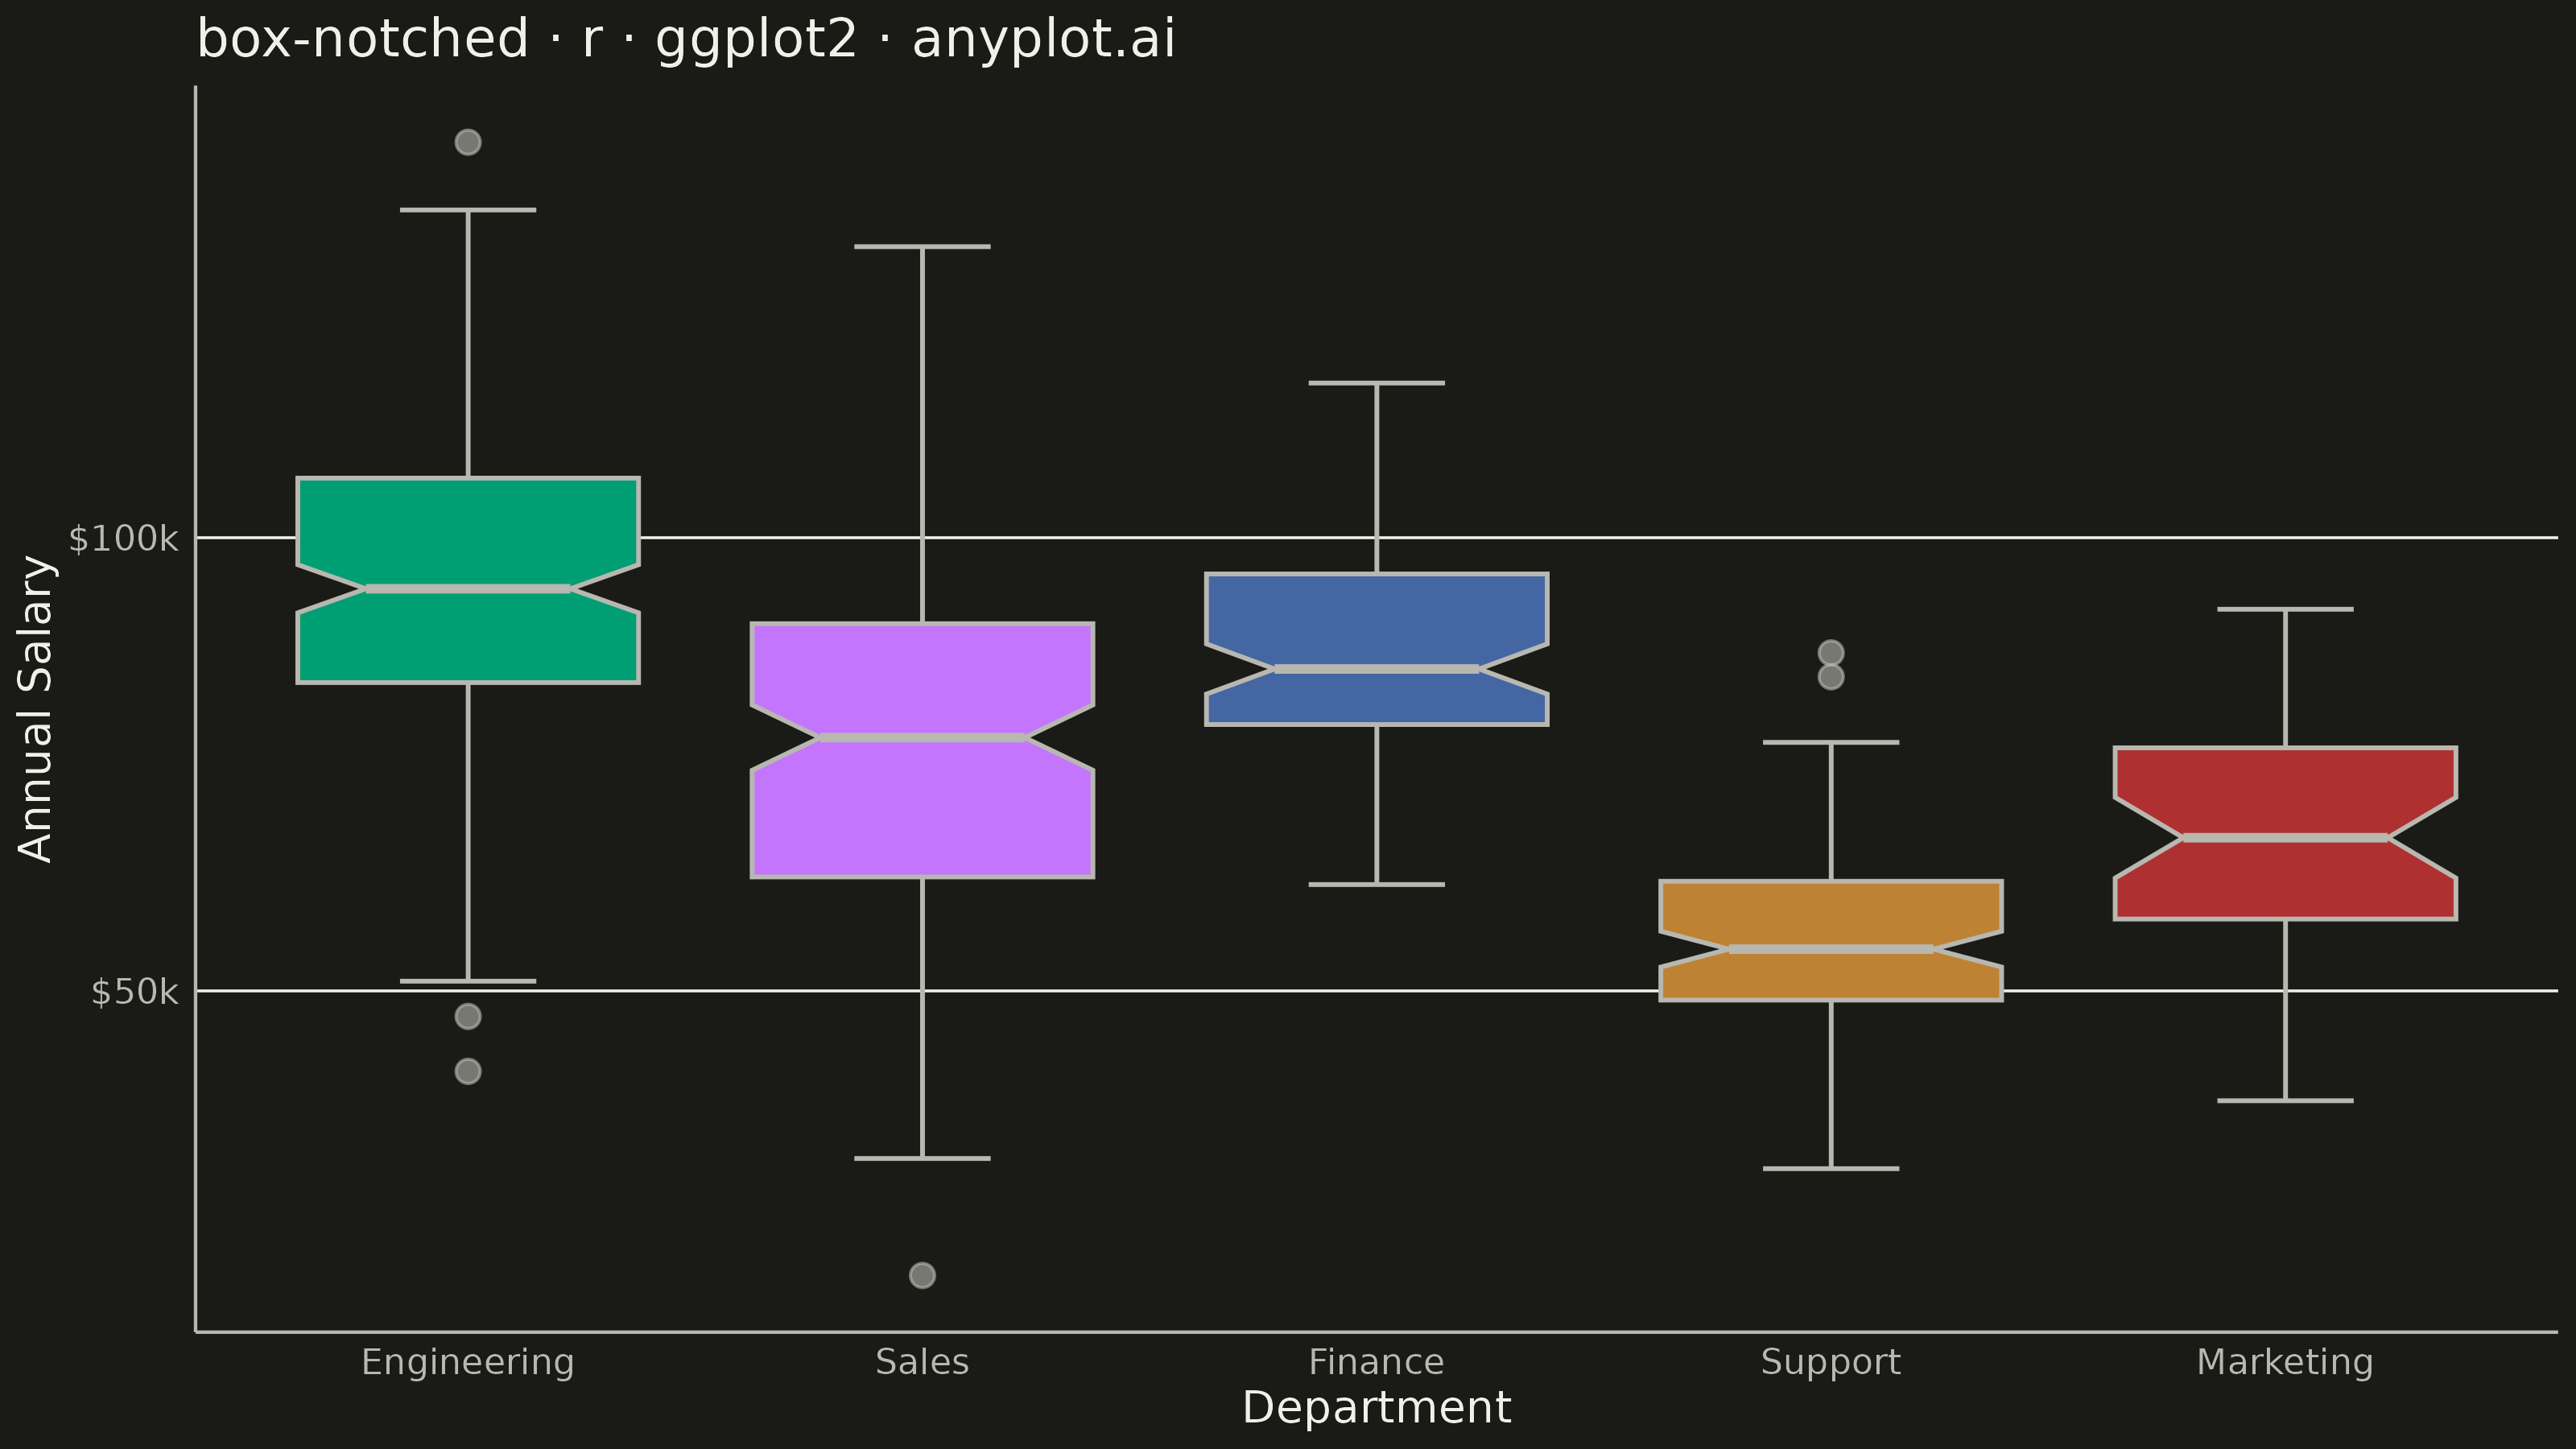
A notched box plot extends the standard box plot by adding notches around the median that represent a confidence interval. If the notches of two boxes do not overlap, this provides visual evidence that the medians differ significantly. This variant is particularly valuable for quick visual hypothesis testing and comparing group medians in statistical analysis.
#' anyplot.ai
#' box-notched: Notched Box Plot
#' Library: ggplot2 3.5.1 | R 4.4.1
#' Quality: 87/100 | Created: 2026-08-18

library(ggplot2)
library(ragg)

set.seed(42)

# --- Theme tokens -------------------------------------------------------
THEME    <- Sys.getenv("ANYPLOT_THEME", "light")
PAGE_BG  <- if (THEME == "light") "#FAF8F1" else "#1A1A17"
INK      <- if (THEME == "light") "#1A1A17" else "#F0EFE8"
INK_SOFT <- if (THEME == "light") "#4A4A44" else "#B8B7B0"

IMPRINT_PALETTE <- c(
  "#009E73",  # 1 — brand green
  "#C475FD",  # 2 — lavender
  "#4467A3",  # 3 — blue
  "#BD8233",  # 4 — ochre
  "#AE3030"   # 5 — matte red
)

# --- Data -----------------------------------------------------------------
# Annual base salary (USD) by department. Sample sizes vary on purpose — the
# smaller Marketing team (n = 45) shows a visibly wider notch than the larger
# departments, illustrating the spec's "notch reliability improves with
# n > 20" note directly in the chart.
departments <- tibble::tibble(
  department = factor(
    rep(c("Engineering", "Sales", "Finance", "Support", "Marketing"),
        times = c(180, 150, 90, 110, 45)),
    levels = c("Engineering", "Sales", "Finance", "Support", "Marketing")
  ),
  salary = c(
    rnorm(180, mean = 95000, sd = 18000),
    rnorm(150, mean = 78000, sd = 22000),
    rnorm(90, mean = 88000, sd = 12000),
    rnorm(110, mean = 55000, sd = 10000),
    rnorm(45, mean = 68000, sd = 15000)
  )
)

# Reorder departments by descending median salary so adjacent notches are
# easier to compare visually — the core point of a notched box plot.
departments$department <- reorder(departments$department, -departments$salary, FUN = median)

# --- Plot -------------------------------------------------------------------
p <- ggplot(departments, aes(x = department, y = salary, fill = department)) +
  geom_boxplot(
    notch = TRUE,
    notchwidth = 0.6,
    color = INK_SOFT,
    linewidth = 0.5,
    staplewidth = 0.4,
    outlier.size = 2.2,
    outlier.alpha = 0.6
  ) +
  scale_fill_manual(values = IMPRINT_PALETTE) +
  scale_y_continuous(
    breaks = scales::breaks_width(25000),
    labels = scales::dollar_format(scale = 1e-3, suffix = "k")
  ) +
  labs(
    title = "box-notched · r · ggplot2 · anyplot.ai",
    x = "Department",
    y = "Annual Salary (USD)"
  ) +
  theme_minimal(base_size = 8) +
  theme(
    plot.background     = element_rect(fill = PAGE_BG, color = PAGE_BG),
    panel.background    = element_rect(fill = PAGE_BG, color = NA),
    panel.grid.major.x  = element_blank(),
    panel.grid.minor    = element_blank(),
    panel.grid.major.y  = element_line(color = INK, linewidth = 0.3),
    axis.title          = element_text(color = INK, size = 10),
    axis.text           = element_text(color = INK_SOFT, size = 8),
    axis.line           = element_line(color = INK_SOFT),
    plot.title          = element_text(color = INK, size = 12),
    legend.position      = "none"
  )

# --- Save -------------------------------------------------------------------
ggsave(
  filename = sprintf("plot-%s.png", THEME),
  plot     = p,
  device   = ragg::agg_png,
  width    = 8,
  height   = 4.5,
  units    = "in",
  dpi      = 400
)
Runnable source as JSON, for any HTTP client: https://api.anyplot.ai/specs/box-notched/ggplot2/code. Any spec id and library id listed in llms-full.txt fit the same URL shape; every URL below is complete and callable.
{
  "spec_id": "box-notched",
  "language": "r",
  "library": "ggplot2",
  "page": "https://anyplot.ai/box-notched/r/ggplot2",
  "hub": "https://anyplot.ai/box-notched",
  "code_json": "https://api.anyplot.ai/specs/box-notched/ggplot2/code",
  "spec_json": "https://api.anyplot.ai/specs/box-notched",
  "render_light_png": "https://storage.googleapis.com/anyplot-images/plots/box-notched/r/ggplot2/plot-light.png",
  "render_dark_png": "https://storage.googleapis.com/anyplot-images/plots/box-notched/r/ggplot2/plot-dark.png",
  "quality_score": 87.0,
  "license": "MIT",
  "guide": "https://anyplot.ai/llms.txt"
}
Part of Notched Box Plot on anyplot.ai.