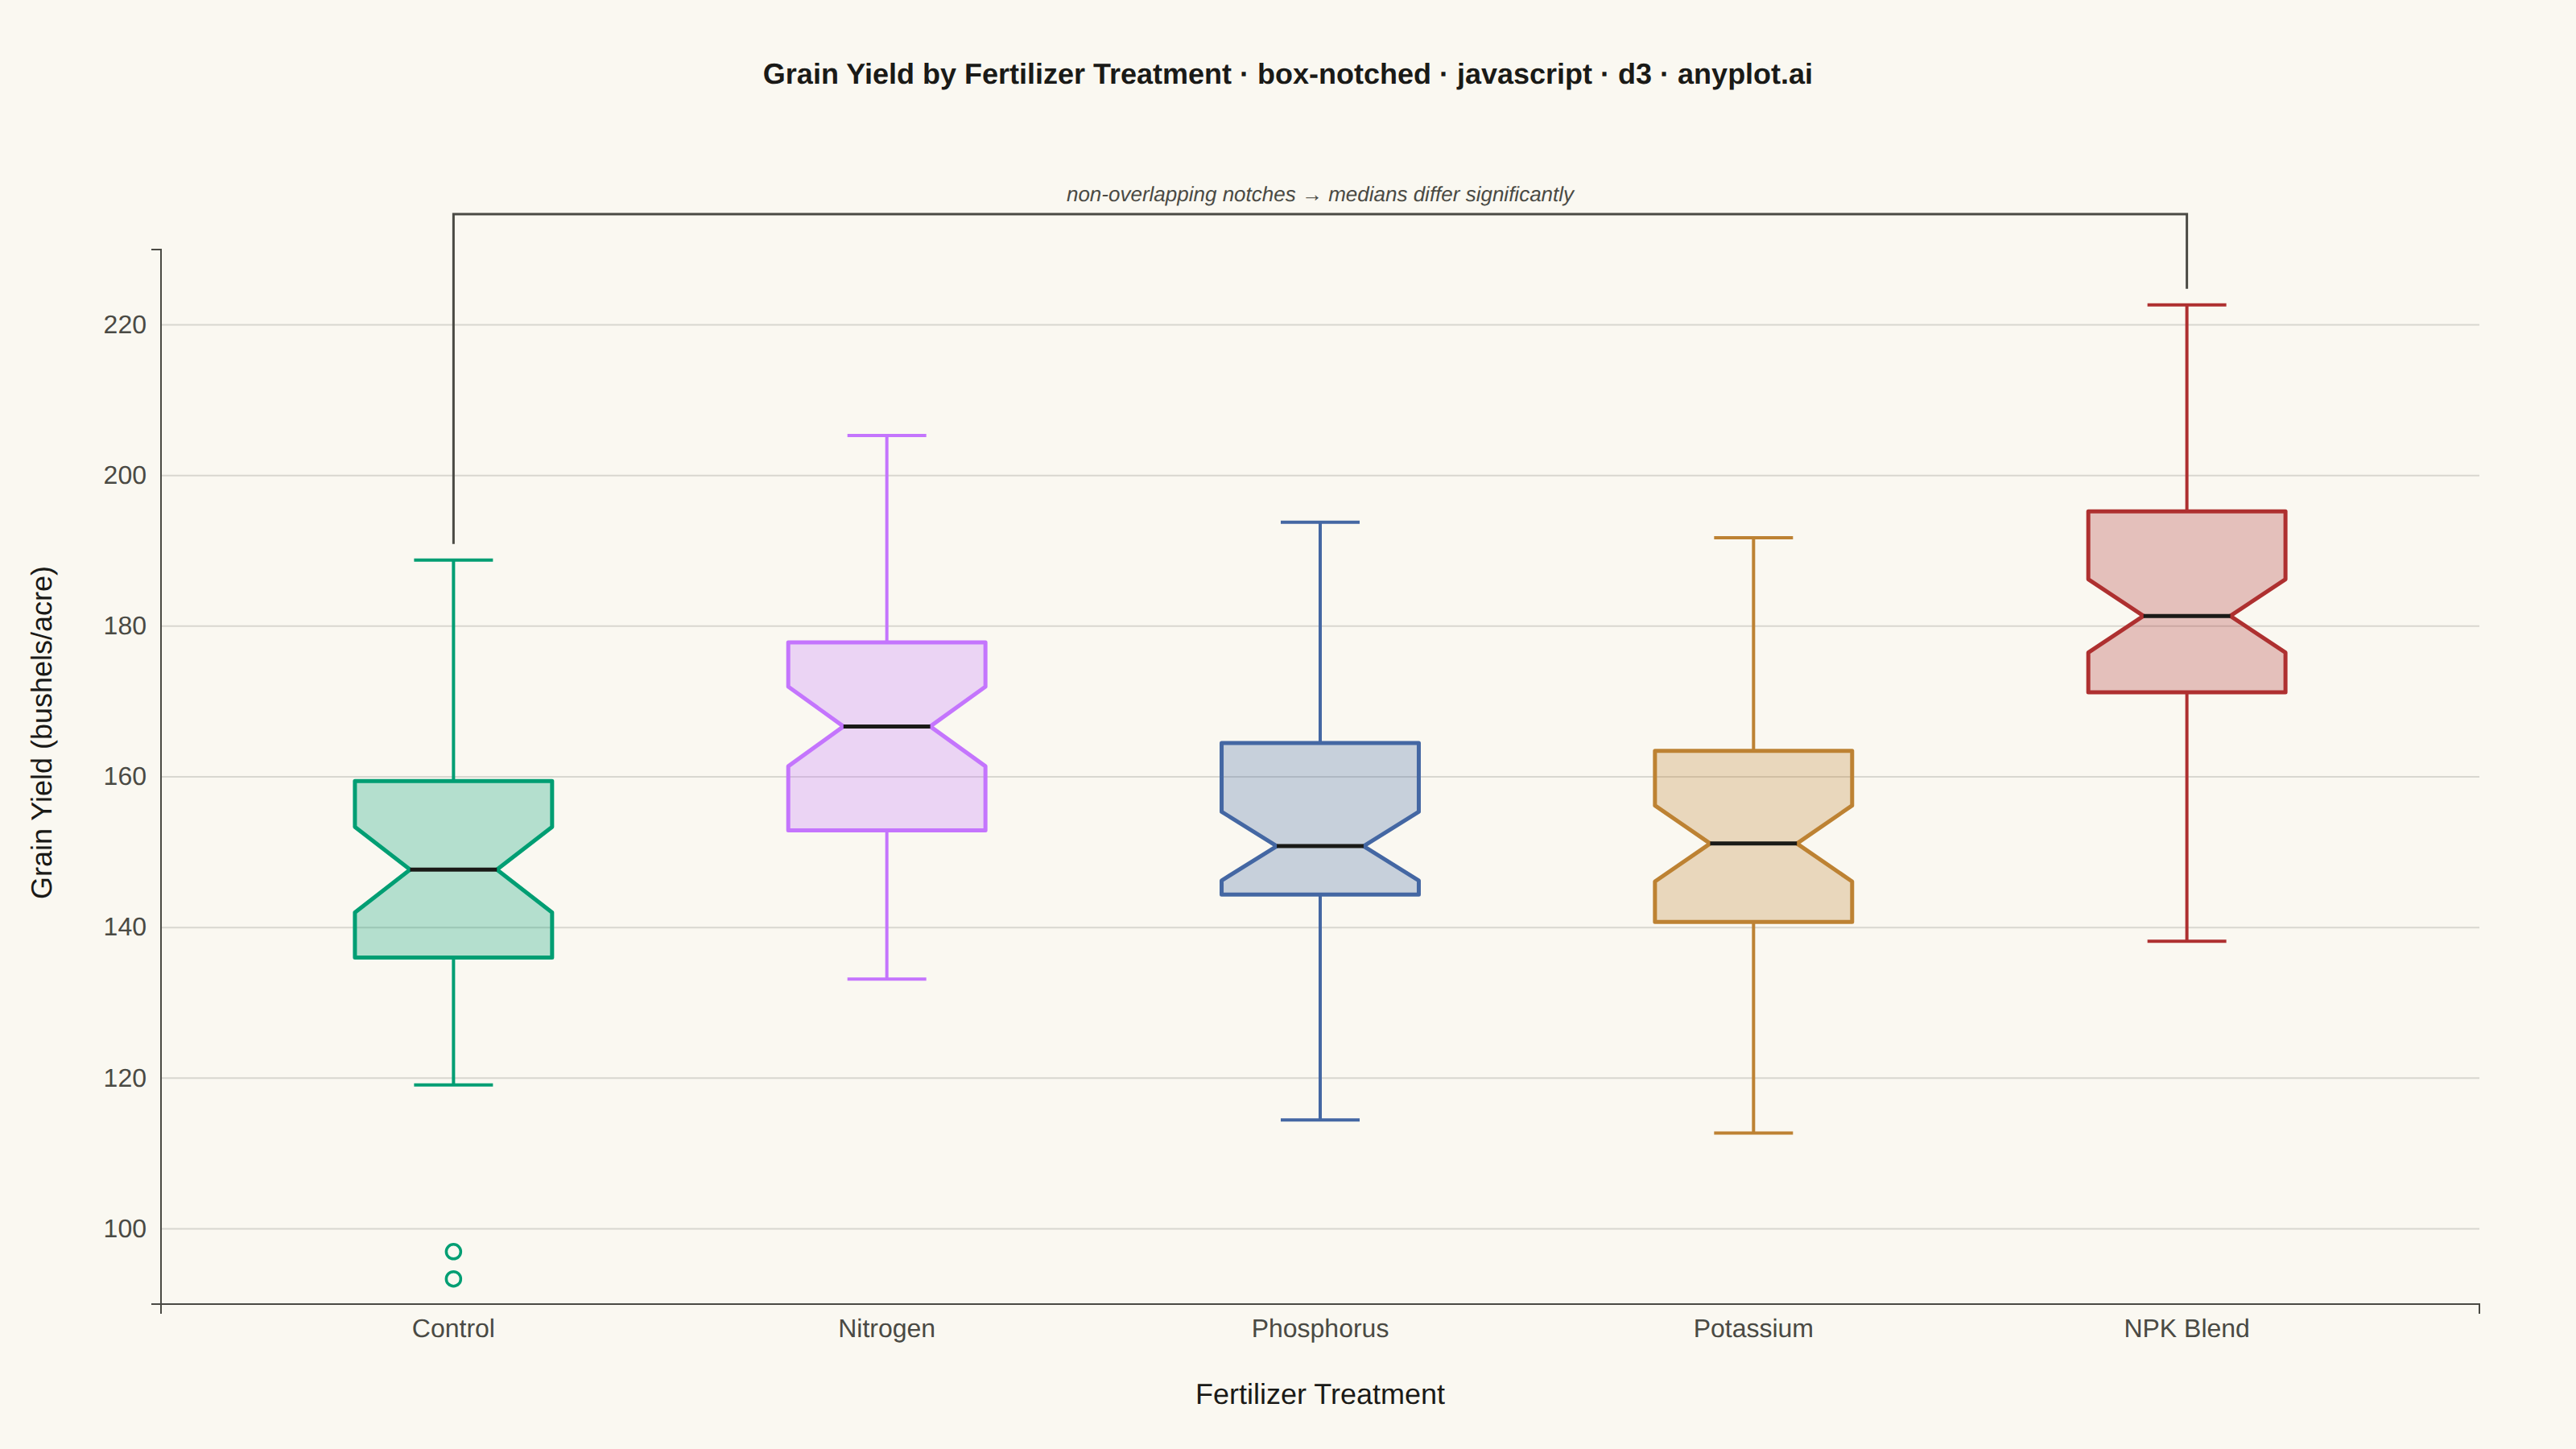
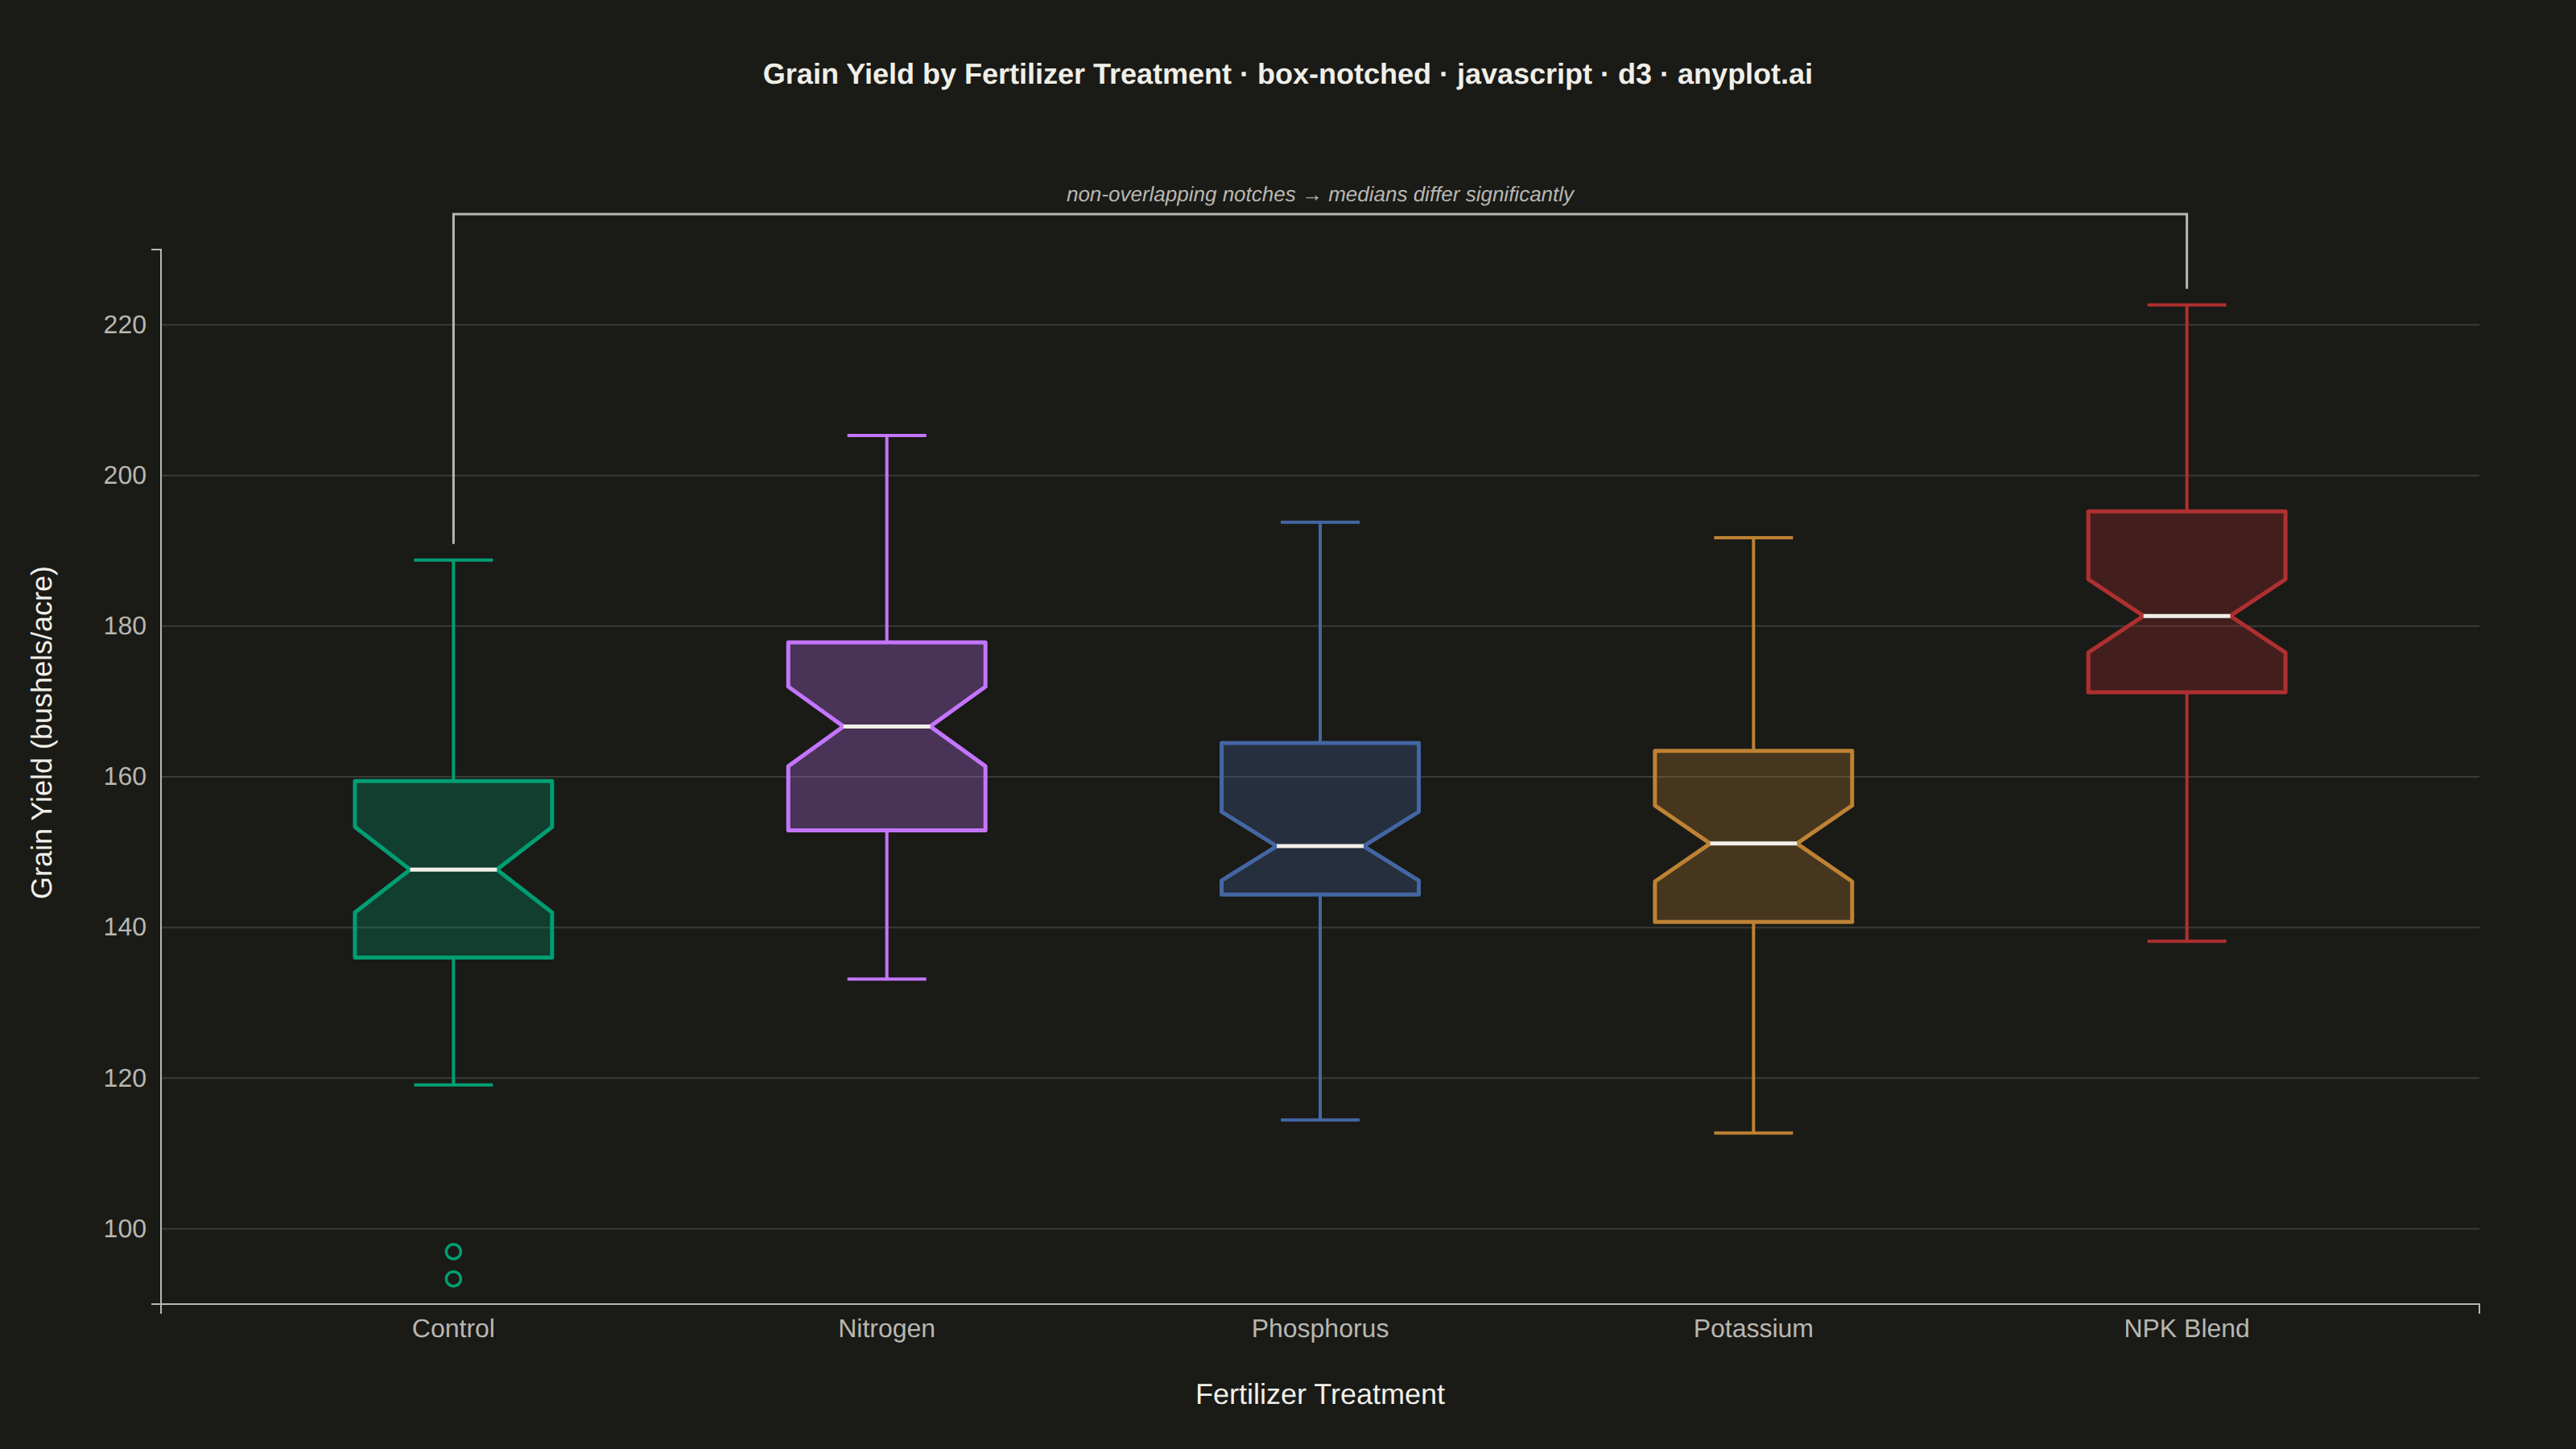
The same plot in 14 other libraries — JavaScript: Chart.js, Apache ECharts, Highcharts, MUI X Charts; Python: Altair, Bokeh, lets-plot, Matplotlib, Plotly, plotnine, Pygal, Seaborn; R: ggplot2; Julia: Makie.jl. Compare all 15 side by side: Notched Box Plot in Python, R, Julia and JavaScript.
A notched box plot extends the standard box plot by adding notches around the median that represent a confidence interval. If the notches of two boxes do not overlap, this provides visual evidence that the medians differ significantly. This variant is particularly valuable for quick visual hypothesis testing and comparing group medians in statistical analysis.
// anyplot.ai
// box-notched: Notched Box Plot
// Library: d3 7.9.0 | JavaScript 22.23.2
// Quality: 92/100 | Created: 2026-08-18

const t = window.ANYPLOT_TOKENS;
const { width, height } = window.ANYPLOT_SIZE;
const margin = { top: 100, right: 60, bottom: 90, left: 100 };
const iw = width - margin.left - margin.right;
const ih = height - margin.top - margin.bottom;

// --- Deterministic PRNG (LCG + Box-Muller) — browser has no seeded RNG ------
let seed = 42;
function uniform() {
  seed = (seed * 1103515245 + 12345) & 0x7fffffff;
  return seed / 0x7fffffff;
}
function normal(mean, std) {
  const u1 = Math.max(uniform(), 1e-9);
  const u2 = uniform();
  const z = Math.sqrt(-2 * Math.log(u1)) * Math.cos(2 * Math.PI * u2);
  return mean + z * std;
}

// --- Data: grain yield (bushels/acre) across fertilizer treatments ---------
const groups = [
  { label: "Control", mean: 148, std: 18, n: 42 },
  { label: "Nitrogen", mean: 162, std: 20, n: 55 },
  { label: "Phosphorus", mean: 155, std: 16, n: 48 },
  { label: "Potassium", mean: 151, std: 19, n: 50 },
  { label: "NPK Blend", mean: 179, std: 22, n: 60 },
];

const stats = groups.map((group) => {
  const values = Array.from({ length: group.n }, () => normal(group.mean, group.std));
  const sorted = values.slice().sort(d3.ascending);
  const q1 = d3.quantileSorted(sorted, 0.25);
  const median = d3.quantileSorted(sorted, 0.5);
  const q3 = d3.quantileSorted(sorted, 0.75);
  const iqr = q3 - q1;
  const lowFence = q1 - 1.5 * iqr;
  const highFence = q3 + 1.5 * iqr;
  const inFence = sorted.filter((v) => v >= lowFence && v <= highFence);
  const outliers = sorted.filter((v) => v < lowFence || v > highFence);
  const notchHalf = (1.57 * iqr) / Math.sqrt(group.n);
  return {
    label: group.label,
    q1,
    median,
    q3,
    whiskerLow: d3.min(inFence),
    whiskerHigh: d3.max(inFence),
    outliers,
    notchTop: Math.min(median + notchHalf, q3),
    notchBottom: Math.max(median - notchHalf, q1),
  };
});

// --- Notch-overlap check — the entire point of a notched box plot: when two
// notches don't overlap, the medians differ significantly (95% CI). Find the
// most extreme non-overlapping pair to call out with a bracket annotation.
const notchOverlaps = (a, b) => a.notchBottom <= b.notchTop && b.notchBottom <= a.notchTop;
const nonOverlappingPairs = d3
  .cross(stats, stats)
  .filter(([a, b]) => a.label < b.label && !notchOverlaps(a, b));
const sigPair = d3.greatest(nonOverlappingPairs, ([a, b]) => Math.abs(a.median - b.median));

// --- Scales -------------------------------------------------------------
const x = d3.scaleBand().domain(stats.map((d) => d.label)).range([0, iw]).padding(0.35);
const allValues = stats.flatMap((d) => [d.whiskerLow, d.whiskerHigh, ...d.outliers]);
const annotationPad = sigPair ? 55 : 0;
const y = d3.scaleLinear().domain(d3.extent(allValues)).nice().range([ih, annotationPad]);
const color = d3.scaleOrdinal().domain(stats.map((d) => d.label)).range(t.palette);
const boxWidth = x.bandwidth() * 0.7;
const notchInset = boxWidth * 0.28;
const capWidth = boxWidth * 0.4;

// --- SVG mount ------------------------------------------------------------
const svg = d3.select("#container").append("svg").attr("width", width).attr("height", height);
const g = svg.append("g").attr("transform", `translate(${margin.left},${margin.top})`);

// --- Gridlines (y-axis only, behind the boxes) -----------------------------
g.append("g")
  .selectAll("line")
  .data(y.ticks(6))
  .join("line")
  .attr("x1", 0)
  .attr("x2", iw)
  .attr("y1", (d) => y(d))
  .attr("y2", (d) => y(d))
  .attr("stroke", t.grid)
  .attr("stroke-width", 1);

// --- Axes -------------------------------------------------------------------
const xAxis = g.append("g").attr("transform", `translate(0,${ih})`).call(d3.axisBottom(x));
const yAxis = g.append("g").call(d3.axisLeft(y).ticks(6));
for (const axis of [xAxis, yAxis]) {
  axis.selectAll("text").attr("fill", t.inkSoft).style("font-size", "16px");
  axis.selectAll(".tick line").remove();
  axis.select(".domain").attr("stroke", t.inkSoft);
}

// --- Box groups ---------------------------------------------------------
const boxGroups = g
  .selectAll(".box-group")
  .data(stats)
  .join("g")
  .attr("class", "box-group")
  .attr("transform", (d) => `translate(${x(d.label) + x.bandwidth() / 2},0)`);

// Whiskers
boxGroups
  .append("line")
  .attr("x1", 0)
  .attr("x2", 0)
  .attr("y1", (d) => y(d.q3))
  .attr("y2", (d) => y(d.whiskerHigh))
  .attr("stroke", (d) => color(d.label))
  .attr("stroke-width", 2);
boxGroups
  .append("line")
  .attr("x1", 0)
  .attr("x2", 0)
  .attr("y1", (d) => y(d.q1))
  .attr("y2", (d) => y(d.whiskerLow))
  .attr("stroke", (d) => color(d.label))
  .attr("stroke-width", 2);

// Whisker caps
boxGroups
  .append("line")
  .attr("x1", -capWidth / 2)
  .attr("x2", capWidth / 2)
  .attr("y1", (d) => y(d.whiskerHigh))
  .attr("y2", (d) => y(d.whiskerHigh))
  .attr("stroke", (d) => color(d.label))
  .attr("stroke-width", 2);
boxGroups
  .append("line")
  .attr("x1", -capWidth / 2)
  .attr("x2", capWidth / 2)
  .attr("y1", (d) => y(d.whiskerLow))
  .attr("y2", (d) => y(d.whiskerLow))
  .attr("stroke", (d) => color(d.label))
  .attr("stroke-width", 2);

// Notched box — pinched inward at the median to show the 95% CI
function boxPath(d) {
  const x0 = -boxWidth / 2;
  const x1 = boxWidth / 2;
  const yQ3 = y(d.q3);
  const yQ1 = y(d.q1);
  const yNTop = y(d.notchTop);
  const yNBot = y(d.notchBottom);
  const yMed = y(d.median);
  return `M${x0},${yQ3}
    L${x1},${yQ3}
    L${x1},${yNTop}
    L${x1 - notchInset},${yMed}
    L${x1},${yNBot}
    L${x1},${yQ1}
    L${x0},${yQ1}
    L${x0},${yNBot}
    L${x0 + notchInset},${yMed}
    L${x0},${yNTop}
    Z`;
}

boxGroups
  .append("path")
  .attr("d", boxPath)
  .attr("fill", (d) => color(d.label))
  .attr("fill-opacity", 0.28)
  .attr("stroke", (d) => color(d.label))
  .attr("stroke-width", 2.5)
  .attr("stroke-linejoin", "round");

// Median line across the notch waist
boxGroups
  .append("line")
  .attr("x1", -boxWidth / 2 + notchInset)
  .attr("x2", boxWidth / 2 - notchInset)
  .attr("y1", (d) => y(d.median))
  .attr("y2", (d) => y(d.median))
  .attr("stroke", t.ink)
  .attr("stroke-width", 2.5);

// Outliers — hollow markers beyond the whiskers
boxGroups.each(function (d) {
  d3.select(this)
    .selectAll(".outlier")
    .data(d.outliers)
    .join("circle")
    .attr("class", "outlier")
    .attr("cx", 0)
    .attr("cy", (v) => y(v))
    .attr("r", 4.5)
    .attr("fill", t.pageBg)
    .attr("stroke", color(d.label))
    .attr("stroke-width", 1.75);
});

// --- Significance bracket — makes the "non-overlapping notches = significant
// difference" insight explicit instead of relying on the reader to spot it ---
if (sigPair) {
  const [a, b] = sigPair;
  const cx = (d) => x(d.label) + x.bandwidth() / 2;
  const topExtent = (d) => d3.max([d.whiskerHigh, ...d.outliers]);
  const bracketY = annotationPad - 22;
  const xa = cx(a);
  const xb = cx(b);

  const bracket = d3.line().curve(d3.curveLinear);
  g.append("path")
    .datum([
      [xa, y(topExtent(a)) - 10],
      [xa, bracketY],
      [xb, bracketY],
      [xb, y(topExtent(b)) - 10],
    ])
    .attr("d", bracket)
    .attr("fill", "none")
    .attr("stroke", t.inkSoft)
    .attr("stroke-width", 1.5);

  g.append("text")
    .attr("x", (xa + xb) / 2)
    .attr("y", bracketY - 8)
    .attr("text-anchor", "middle")
    .attr("fill", t.inkSoft)
    .style("font-size", "13px")
    .style("font-style", "italic")
    .text("non-overlapping notches → medians differ significantly");
}

// --- Axis titles --------------------------------------------------------
g.append("text")
  .attr("x", iw / 2)
  .attr("y", ih + 62)
  .attr("text-anchor", "middle")
  .attr("fill", t.ink)
  .style("font-size", "18px")
  .text("Fertilizer Treatment");

g.append("text")
  .attr("transform", "rotate(-90)")
  .attr("x", -ih / 2)
  .attr("y", -68)
  .attr("text-anchor", "middle")
  .attr("fill", t.ink)
  .style("font-size", "18px")
  .text("Grain Yield (bushels/acre)");

// --- Title — fontsize scales linearly off the 67-char mandated baseline ----
const title = "Grain Yield by Fertilizer Treatment · box-notched · javascript · d3 · anyplot.ai";
const titleRatio = title.length > 67 ? 67 / title.length : 1;
const titleFontSize = Math.max(14, Math.round(22 * titleRatio));

svg
  .append("text")
  .attr("x", width / 2)
  .attr("y", 52)
  .attr("text-anchor", "middle")
  .attr("fill", t.ink)
  .style("font-size", `${titleFontSize}px`)
  .style("font-weight", "600")
  .text(title);
Runnable source as JSON, for any HTTP client: https://api.anyplot.ai/specs/box-notched/d3/code. Any spec id and library id listed in llms-full.txt fit the same URL shape; every URL below is complete and callable.
{
  "spec_id": "box-notched",
  "language": "javascript",
  "library": "d3",
  "page": "https://anyplot.ai/box-notched/javascript/d3",
  "hub": "https://anyplot.ai/box-notched",
  "code_json": "https://api.anyplot.ai/specs/box-notched/d3/code",
  "spec_json": "https://api.anyplot.ai/specs/box-notched",
  "render_light_png": "https://storage.googleapis.com/anyplot-images/plots/box-notched/javascript/d3/plot-light.png",
  "render_dark_png": "https://storage.googleapis.com/anyplot-images/plots/box-notched/javascript/d3/plot-dark.png",
  "interactive_light_html": "https://storage.googleapis.com/anyplot-images/plots/box-notched/javascript/d3/plot-light.html",
  "interactive_dark_html": "https://storage.googleapis.com/anyplot-images/plots/box-notched/javascript/d3/plot-dark.html",
  "quality_score": 92.0,
  "license": "MIT",
  "guide": "https://anyplot.ai/llms.txt"
}
Part of Notched Box Plot on anyplot.ai.