The same plot in 14 other libraries — JavaScript: Chart.js, D3.js, Apache ECharts, Highcharts; Python: Altair, Bokeh, lets-plot, Matplotlib, Plotly, plotnine, Pygal, Seaborn; R: ggplot2; Julia: Makie.jl. Compare all 15 side by side: Notched Box Plot in Python, R, Julia and JavaScript.
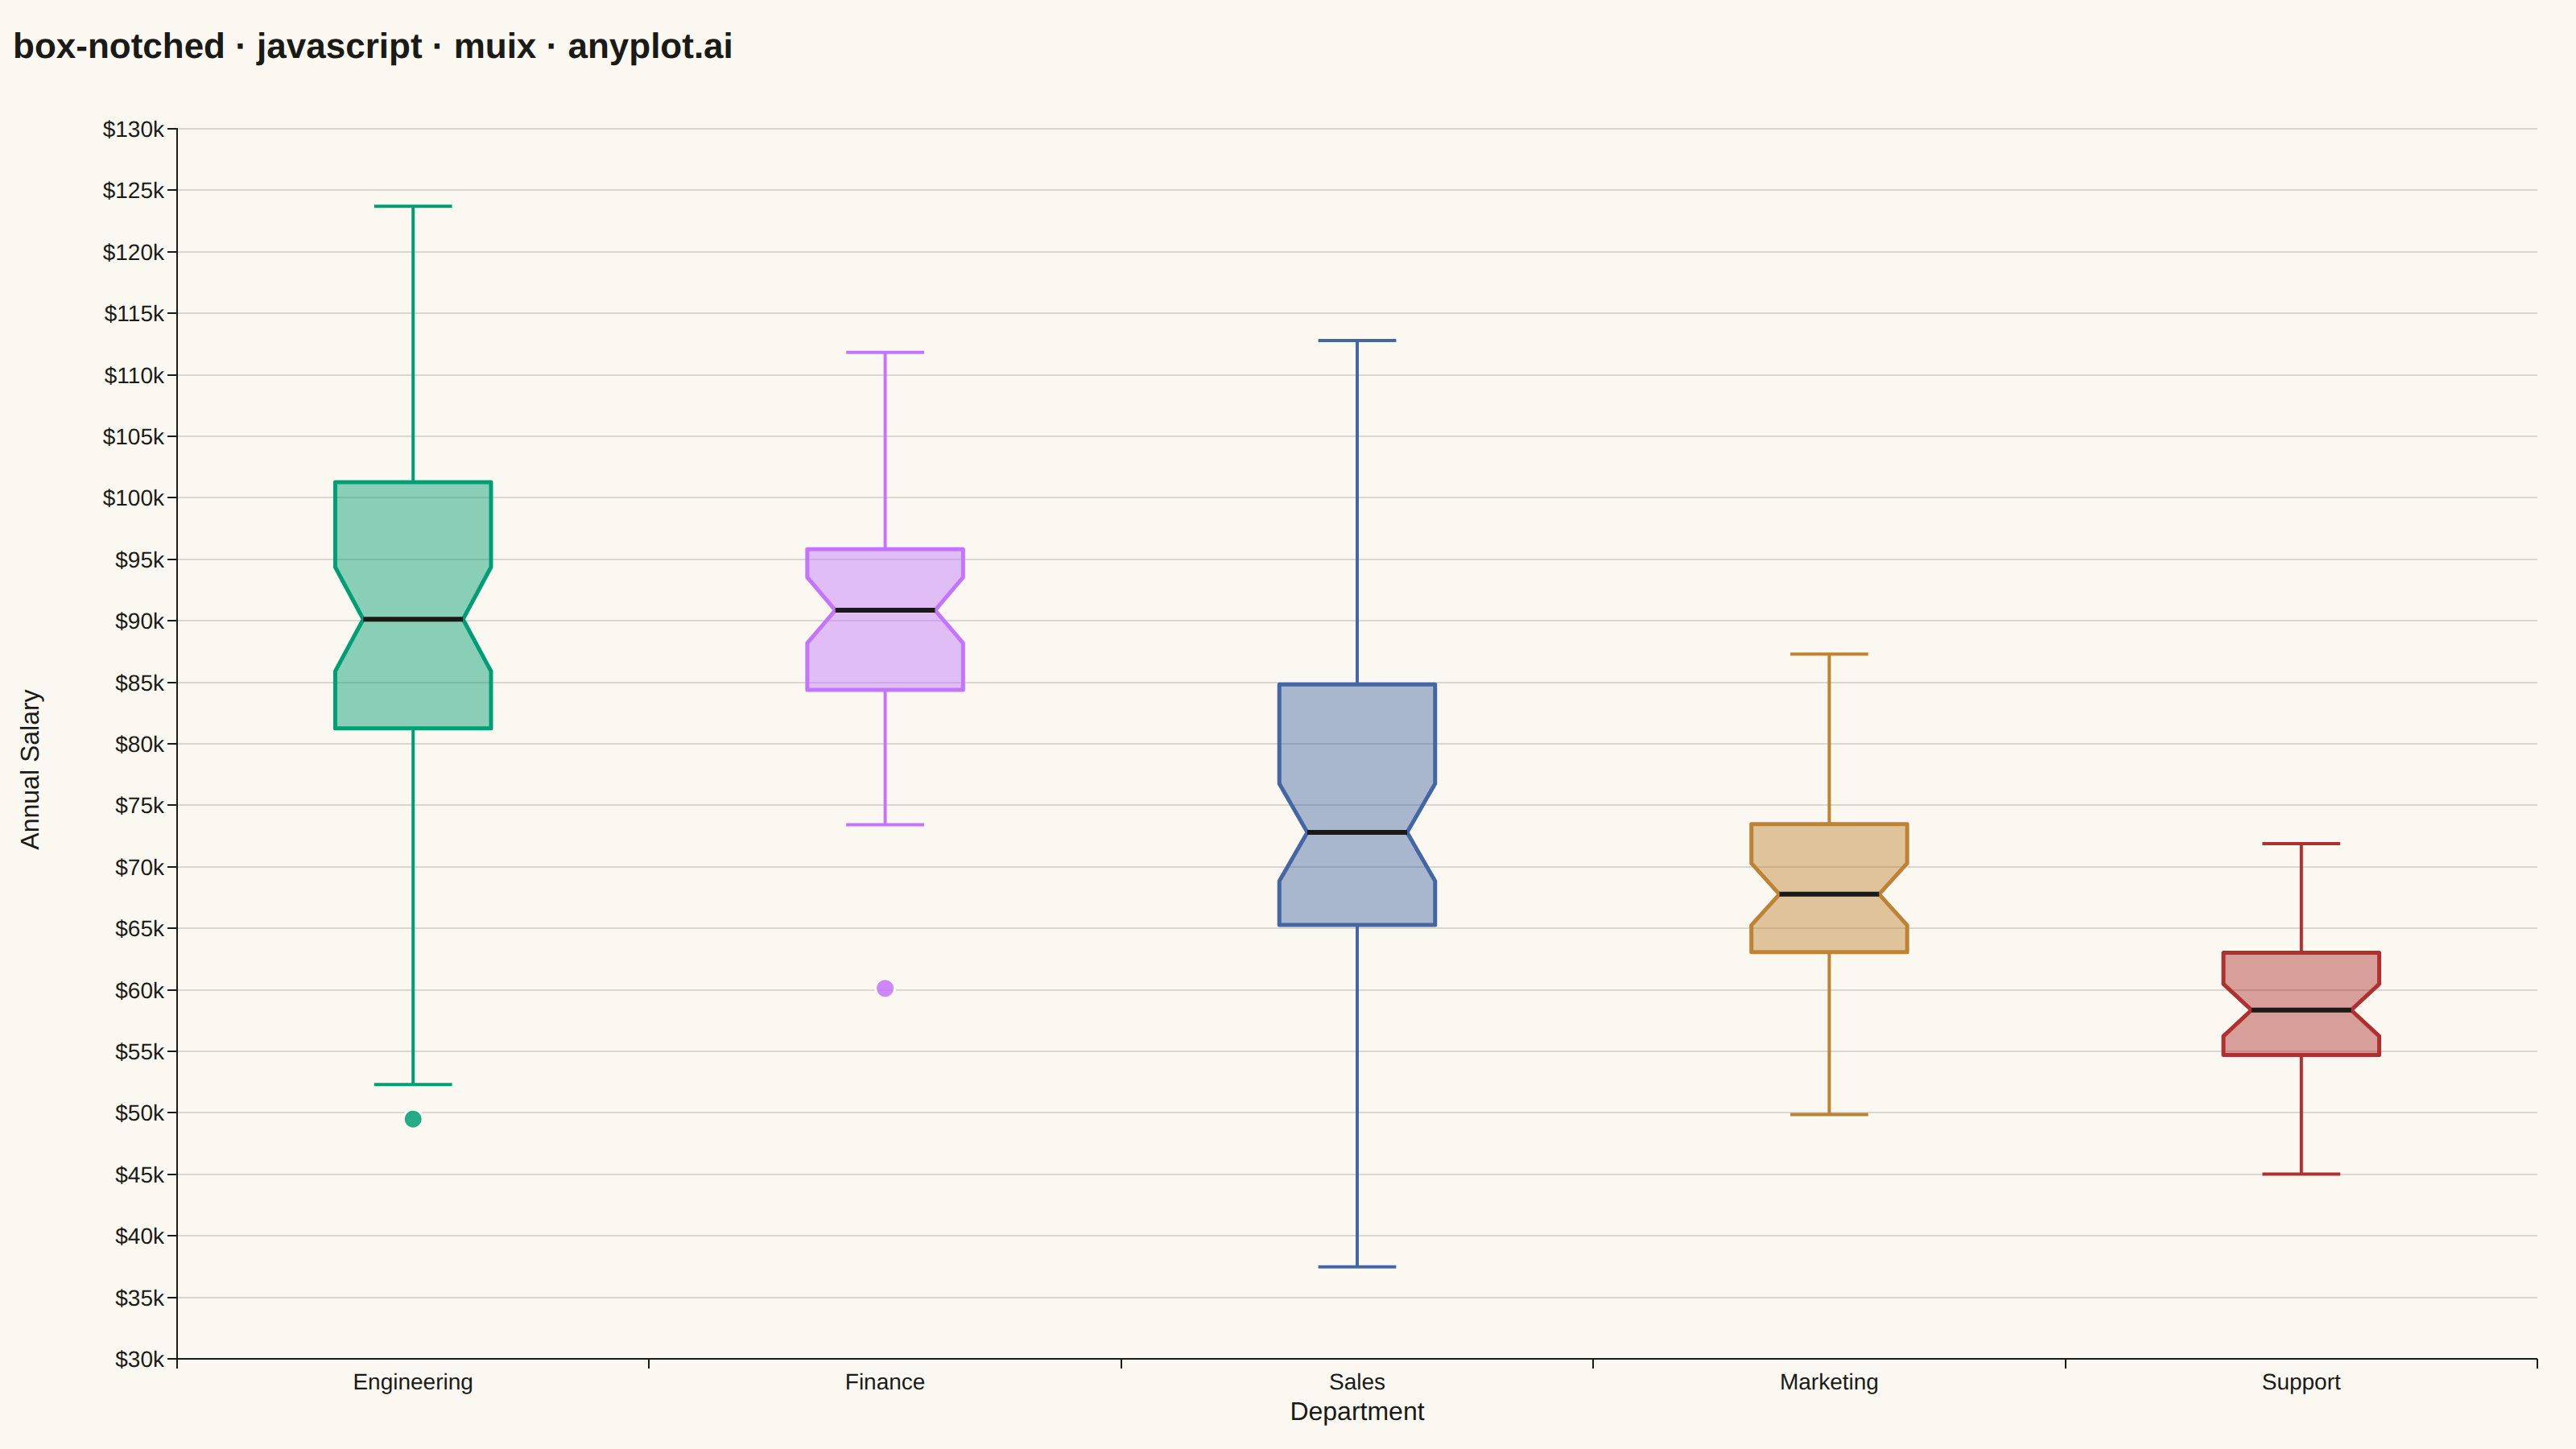
A notched box plot extends the standard box plot by adding notches around the median that represent a confidence interval. If the notches of two boxes do not overlap, this provides visual evidence that the medians differ significantly. This variant is particularly valuable for quick visual hypothesis testing and comparing group medians in statistical analysis.
// anyplot.ai
// box-notched: Notched Box Plot
// Library: muix 7.29.1 | JavaScript 22.23.2
// Quality: 90/100 | Created: 2026-08-18
import * as React from "react";
import { ChartContainer } from "@mui/x-charts/ChartContainer";
import { ChartsXAxis } from "@mui/x-charts/ChartsXAxis";
import { ChartsYAxis } from "@mui/x-charts/ChartsYAxis";
import { ChartsGrid } from "@mui/x-charts/ChartsGrid";
import { useXScale, useYScale } from "@mui/x-charts/hooks";
import Typography from "@mui/material/Typography";

// @mui/x-charts (community, v7) has no built-in box-plot component — the
// notched box is composed from the library's own low-level primitives
// (ChartContainer + useXScale/useYScale) rather than any other charting lib.
const t = window.ANYPLOT_TOKENS;

// --- Deterministic PRNG (LCG + Box-Muller, no seeded RNG in the browser) ----
let seed = 42;
function nextUniform() {
  seed = (seed * 1103515245 + 12345) & 0x7fffffff;
  return seed / 0x7fffffff;
}
function nextGaussian() {
  const u1 = Math.max(nextUniform(), 1e-9);
  const u2 = nextUniform();
  return Math.sqrt(-2 * Math.log(u1)) * Math.cos(2 * Math.PI * u2);
}

// --- Data: annual salary distributions across departments -------------------
const departmentSpecs = [
  { name: "Engineering", n: 55, mean: 92000, sd: 14000 },
  { name: "Finance", n: 45, mean: 88000, sd: 11000 },
  { name: "Sales", n: 60, mean: 74000, sd: 16000 },
  { name: "Marketing", n: 42, mean: 68000, sd: 9000 },
  { name: "Support", n: 38, mean: 58000, sd: 7000 },
];

function quantile(sorted, q) {
  const pos = (sorted.length - 1) * q;
  const base = Math.floor(pos);
  const rest = pos - base;
  return sorted[base + 1] !== undefined
    ? sorted[base] + rest * (sorted[base + 1] - sorted[base])
    : sorted[base];
}

function computeBoxStats(values) {
  const sorted = [...values].sort((a, b) => a - b);
  const n = sorted.length;
  const q1 = quantile(sorted, 0.25);
  const median = quantile(sorted, 0.5);
  const q3 = quantile(sorted, 0.75);
  const iqr = q3 - q1;
  const lowerFence = q1 - 1.5 * iqr;
  const upperFence = q3 + 1.5 * iqr;
  const inliers = sorted.filter((v) => v >= lowerFence && v <= upperFence);
  const outliers = sorted.filter((v) => v < lowerFence || v > upperFence);
  const notch = (1.57 * iqr) / Math.sqrt(n);
  return {
    n,
    q1,
    median,
    q3,
    whiskerLow: inliers[0],
    whiskerHigh: inliers[inliers.length - 1],
    outliers,
    notch,
  };
}

const salaryGroups = departmentSpecs.map((spec) => {
  const values = Array.from({ length: spec.n }, () =>
    Math.max(28000, Math.round(spec.mean + spec.sd * nextGaussian()))
  );
  return { name: spec.name, values, stats: computeBoxStats(values) };
});

const allValues = salaryGroups.flatMap((g) => g.values);
const yMin = Math.floor(Math.min(...allValues) / 5000) * 5000 - 5000;
const yMax = Math.ceil(Math.max(...allValues) / 5000) * 5000 + 5000;

// --- Notched box glyphs, drawn from the axis scales into the chart's <svg> --
function NotchedBoxes({ groups, colors, pageBg }) {
  const xScale = useXScale();
  const yScale = useYScale();
  const bandwidth = xScale.bandwidth ? xScale.bandwidth() : 0;
  const boxWidth = bandwidth * 0.55;
  const notchInset = boxWidth * 0.32;

  return (
    <g>
      {groups.map((g, i) => {
        const color = colors[i % colors.length];
        const cx = xScale(g.name) + bandwidth / 2;
        const xLeft = cx - boxWidth / 2;
        const xRight = cx + boxWidth / 2;
        const xNotchLeft = cx - notchInset;
        const xNotchRight = cx + notchInset;
        const yQ3 = yScale(g.stats.q3);
        const yQ1 = yScale(g.stats.q1);
        const yMed = yScale(g.stats.median);
        const yMedTop = yScale(g.stats.median + g.stats.notch);
        const yMedBot = yScale(g.stats.median - g.stats.notch);
        const yWhiskerHigh = yScale(g.stats.whiskerHigh);
        const yWhiskerLow = yScale(g.stats.whiskerLow);
        const capHalf = boxWidth * 0.25;
        const boxPath = [
          `M ${xLeft} ${yQ3}`,
          `L ${xRight} ${yQ3}`,
          `L ${xRight} ${yMedTop}`,
          `L ${xNotchRight} ${yMed}`,
          `L ${xRight} ${yMedBot}`,
          `L ${xRight} ${yQ1}`,
          `L ${xLeft} ${yQ1}`,
          `L ${xLeft} ${yMedBot}`,
          `L ${xNotchLeft} ${yMed}`,
          `L ${xLeft} ${yMedTop}`,
          "Z",
        ].join(" ");

        return (
          <g key={g.name}>
            <line x1={cx} y1={yWhiskerHigh} x2={cx} y2={yQ3} stroke={color} strokeWidth={2} />
            <line x1={cx} y1={yQ1} x2={cx} y2={yWhiskerLow} stroke={color} strokeWidth={2} />
            <line
              x1={cx - capHalf}
              y1={yWhiskerHigh}
              x2={cx + capHalf}
              y2={yWhiskerHigh}
              stroke={color}
              strokeWidth={2}
            />
            <line
              x1={cx - capHalf}
              y1={yWhiskerLow}
              x2={cx + capHalf}
              y2={yWhiskerLow}
              stroke={color}
              strokeWidth={2}
            />
            <path
              d={boxPath}
              fill={color}
              fillOpacity={0.45}
              stroke={color}
              strokeWidth={2.5}
              strokeLinejoin="round"
            />
            <line
              x1={xNotchLeft}
              y1={yMed}
              x2={xNotchRight}
              y2={yMed}
              stroke={t.ink}
              strokeWidth={3}
            />
            {g.stats.outliers.map((v, j) => (
              <circle
                key={j}
                cx={cx}
                cy={yScale(v)}
                r={6}
                fill={color}
                fillOpacity={0.85}
                stroke={pageBg}
                strokeWidth={1.5}
              />
            ))}
          </g>
        );
      })}
    </g>
  );
}

// --- Chart (default-exported component — the harness mounts it) ------------
export default function Chart() {
  const { width, height } = window.ANYPLOT_SIZE;
  const titleHeight = 56;
  const chartHeight = height - titleHeight;

  return (
    <div style={{ width, height, display: "flex", flexDirection: "column" }}>
      <div style={{ height: titleHeight, display: "flex", alignItems: "center", paddingLeft: 8 }}>
        <Typography sx={{ fontSize: 22, fontWeight: 600, color: t.ink }}>
          box-notched · javascript · muix · anyplot.ai
        </Typography>
      </div>
      <div style={{ position: "relative", width, height: chartHeight }}>
        {/* Rendered outside ChartsYAxis: its built-in label offset is a fixed
            pixel constant, not aware of the wider tick labels ("$130k") here,
            and would overlap them. */}
        <div
          style={{
            position: "absolute",
            left: 20,
            top: "50%",
            transform: "translate(-50%, -50%) rotate(-90deg)",
            fontSize: 16,
            fontWeight: 500,
            color: t.ink,
            whiteSpace: "nowrap",
          }}
        >
          Annual Salary
        </div>
        <ChartContainer
          width={width}
          height={chartHeight}
          series={[]}
          skipAnimation
          margin={{ left: 110, right: 24, top: 24, bottom: 56 }}
          xAxis={[
            {
              scaleType: "band",
              data: salaryGroups.map((g) => g.name),
              categoryGapRatio: 0.4,
            },
          ]}
          yAxis={[
            {
              min: yMin,
              max: yMax,
              valueFormatter: (v) => `$${Math.round(v / 1000)}k`,
            },
          ]}
        >
          <ChartsGrid horizontal />
          <NotchedBoxes groups={salaryGroups} colors={t.palette} pageBg={t.pageBg} />
          <ChartsXAxis label="Department" tickLabelStyle={{ fontSize: 14 }} labelStyle={{ fontSize: 16 }} />
          <ChartsYAxis tickLabelStyle={{ fontSize: 14 }} />
        </ChartContainer>
      </div>
    </div>
  );
}
Runnable source as JSON, for any HTTP client: https://api.anyplot.ai/specs/box-notched/muix/code. Any spec id and library id listed in llms-full.txt fit the same URL shape; every URL below is complete and callable.
{
  "spec_id": "box-notched",
  "language": "javascript",
  "library": "muix",
  "page": "https://anyplot.ai/box-notched/javascript/muix",
  "hub": "https://anyplot.ai/box-notched",
  "code_json": "https://api.anyplot.ai/specs/box-notched/muix/code",
  "spec_json": "https://api.anyplot.ai/specs/box-notched",
  "render_light_png": "https://storage.googleapis.com/anyplot-images/plots/box-notched/javascript/muix/plot-light.png",
  "render_dark_png": "https://storage.googleapis.com/anyplot-images/plots/box-notched/javascript/muix/plot-dark.png",
  "interactive_light_html": "https://storage.googleapis.com/anyplot-images/plots/box-notched/javascript/muix/plot-light.html",
  "interactive_dark_html": "https://storage.googleapis.com/anyplot-images/plots/box-notched/javascript/muix/plot-dark.html",
  "quality_score": 90.0,
  "license": "MIT",
  "guide": "https://anyplot.ai/llms.txt"
}
Part of Notched Box Plot on anyplot.ai.