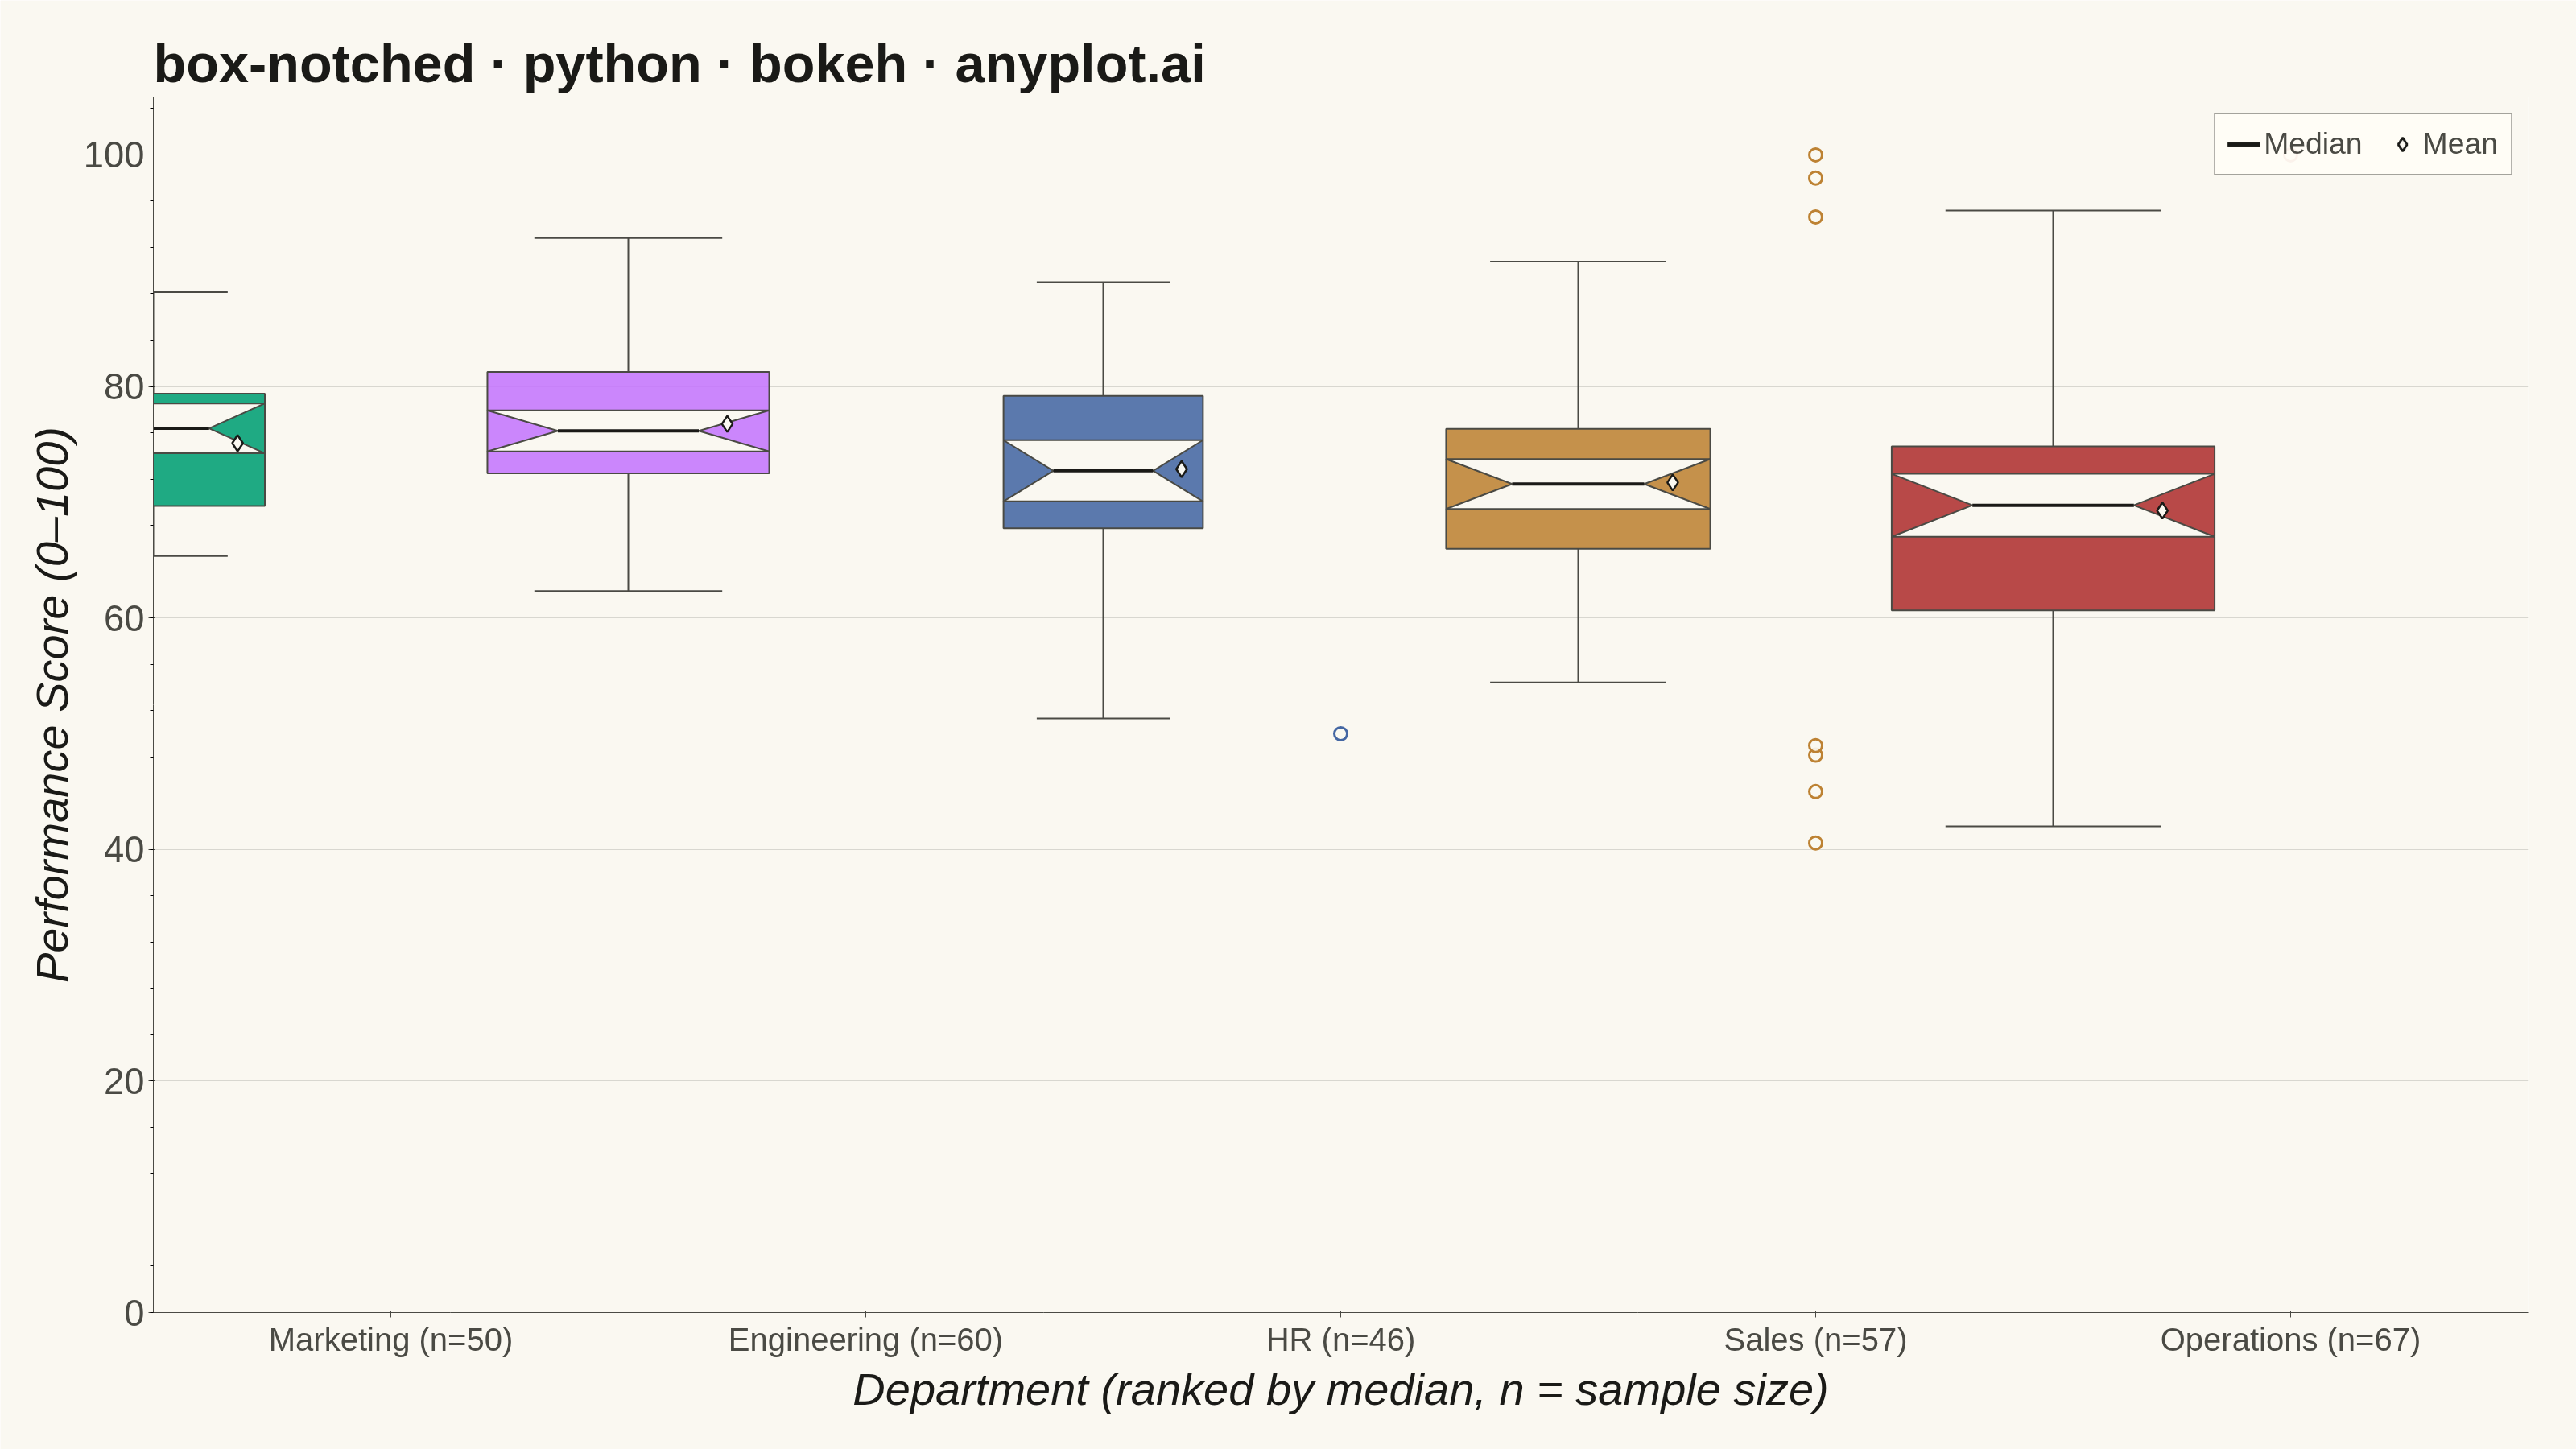
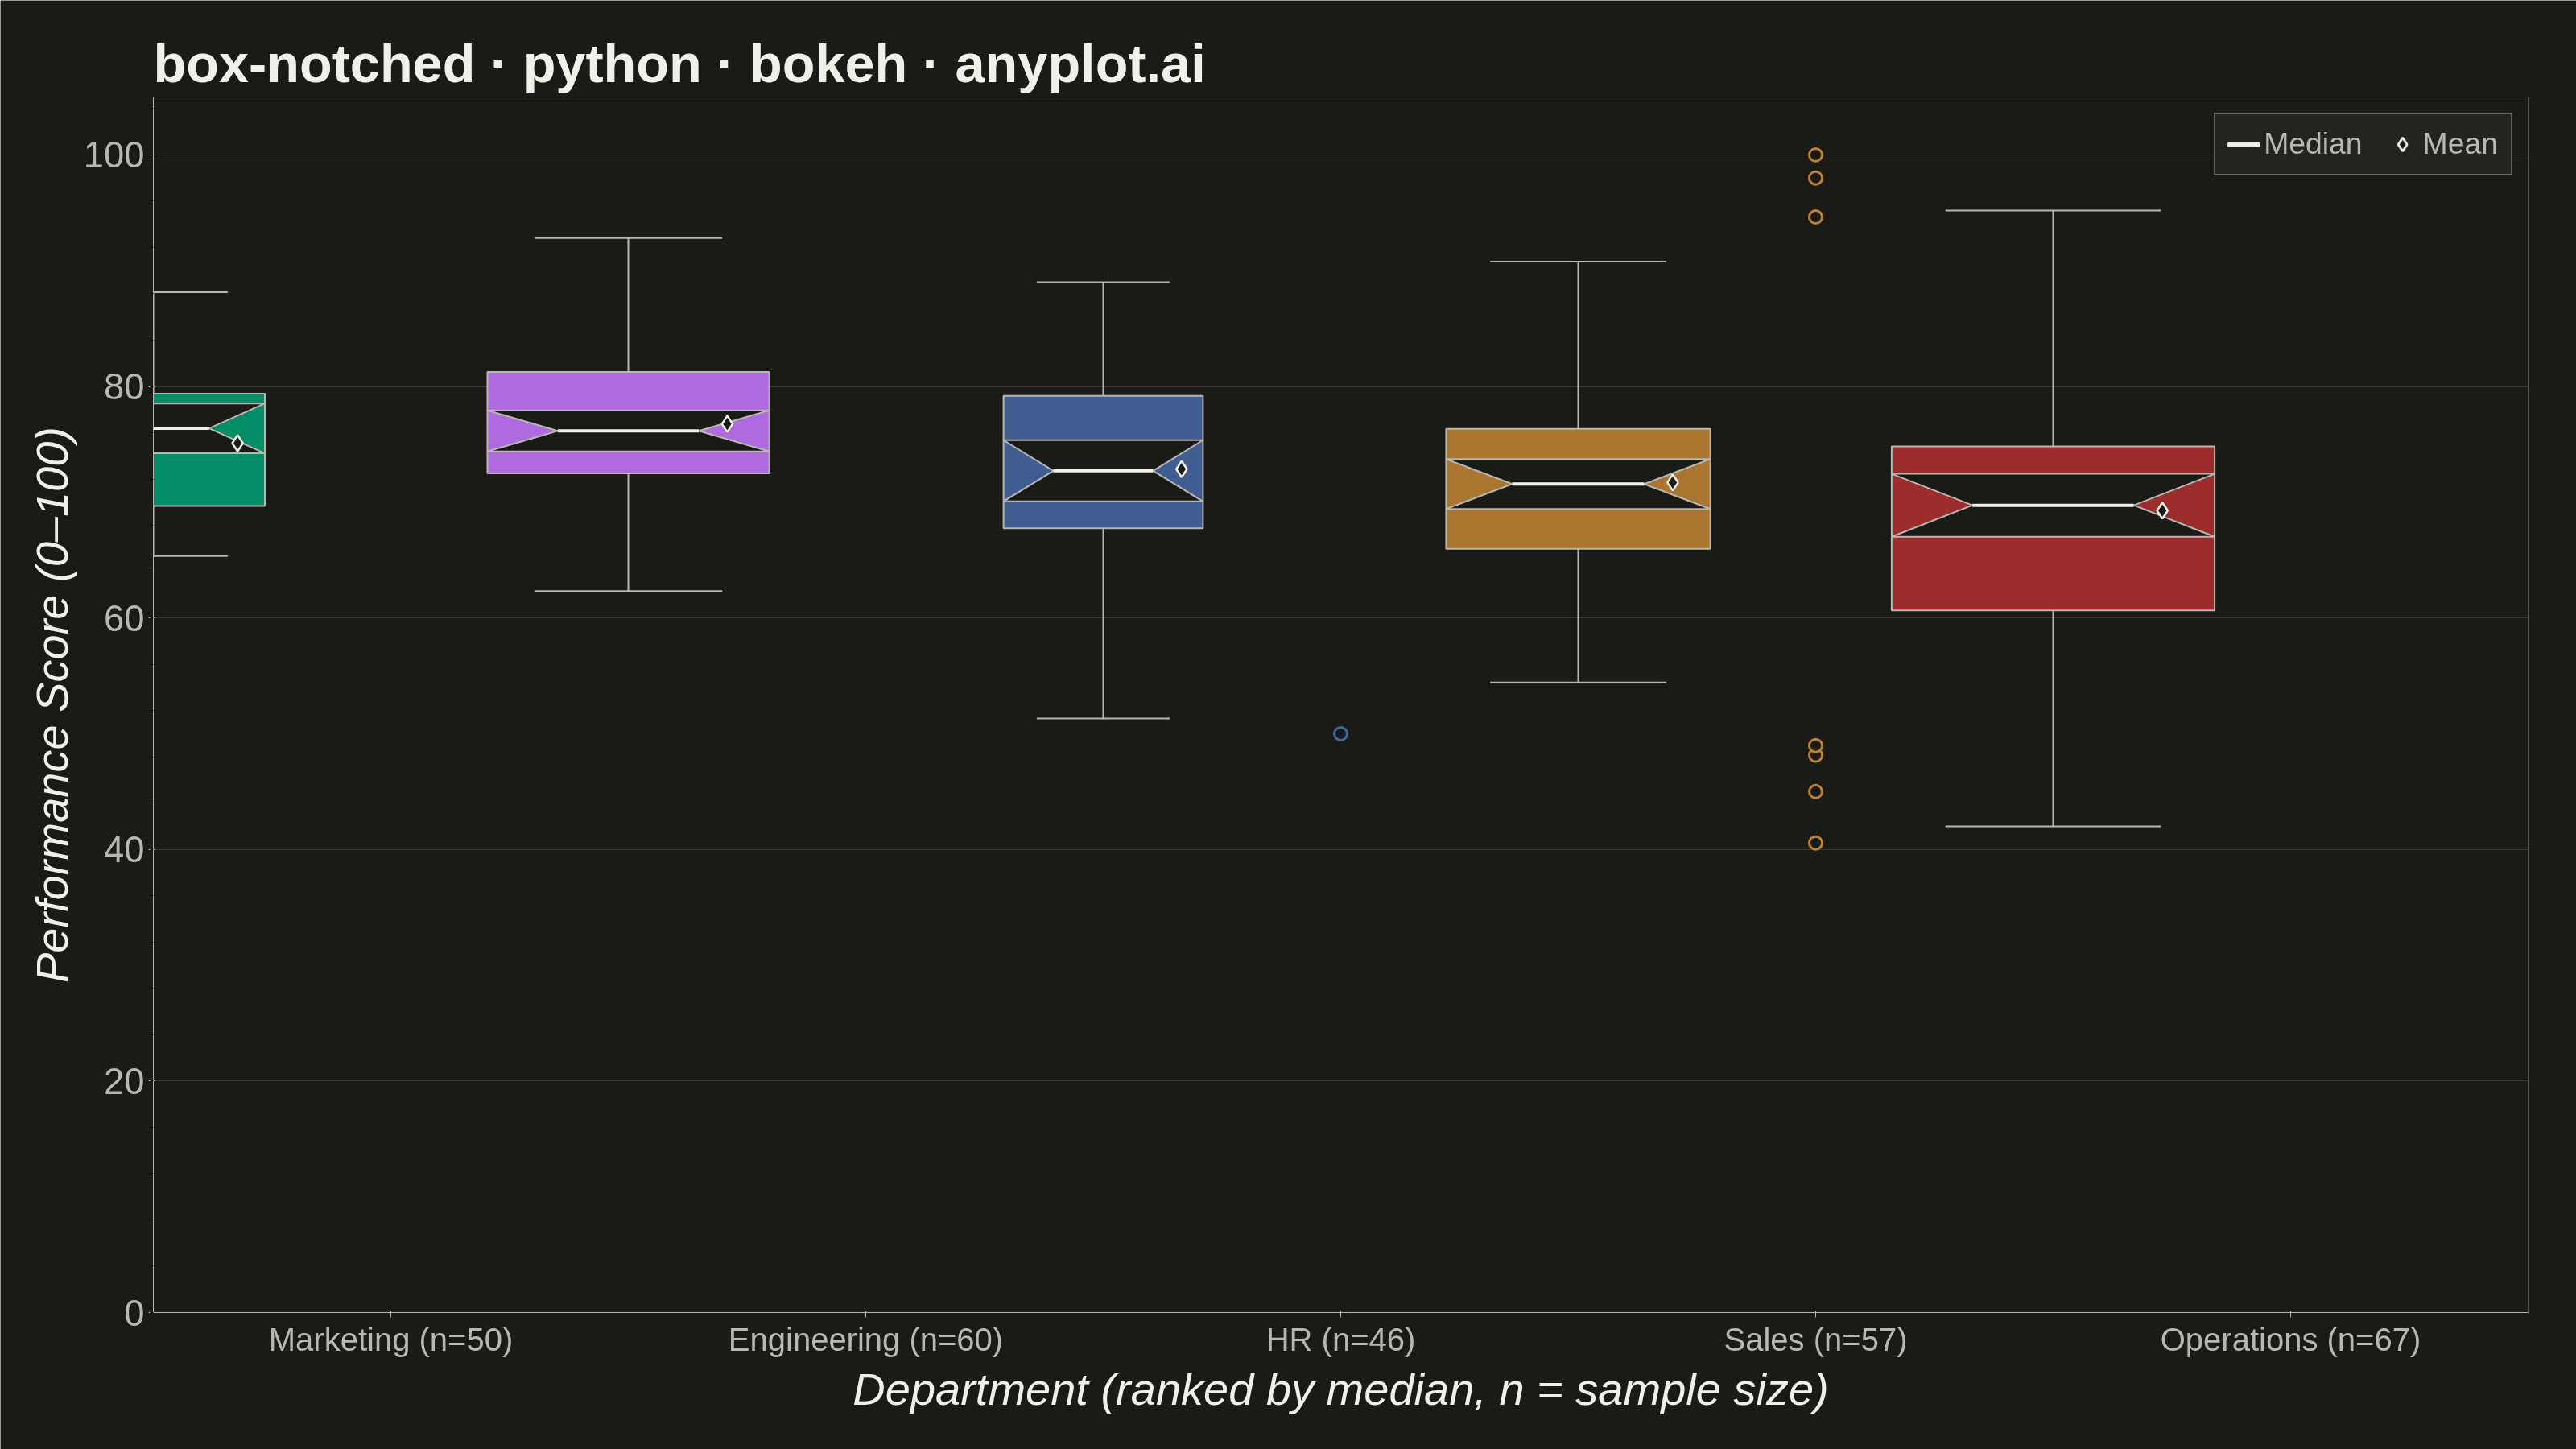
A notched box plot extends the standard box plot by adding notches around the median that represent a confidence interval. If the notches of two boxes do not overlap, this provides visual evidence that the medians differ significantly. This variant is particularly valuable for quick visual hypothesis testing and comparing group medians in statistical analysis.
""" anyplot.ai
box-notched: Notched Box Plot
Library: bokeh 3.9.2 | Python 3.13.15
Quality: 96/100 | Updated: 2026-08-18
"""

import os
import sys
import time
from pathlib import Path


# Remove the script's own directory from sys.path so "bokeh" resolves to the
# installed package, not this file.
_this_dir = str(Path(__file__).parent.resolve())
sys.path = [p for p in sys.path if os.path.abspath(p) != _this_dir and p != ""]

import numpy as np
from bokeh.io import output_file, save
from bokeh.models import ColumnDataSource, HoverTool
from bokeh.plotting import figure
from selenium import webdriver
from selenium.webdriver.chrome.options import Options


# Theme tokens
THEME = os.getenv("ANYPLOT_THEME", "light")
PAGE_BG = "#FAF8F1" if THEME == "light" else "#1A1A17"
ELEVATED_BG = "#FFFDF6" if THEME == "light" else "#242420"
INK = "#1A1A17" if THEME == "light" else "#F0EFE8"
INK_SOFT = "#4A4A44" if THEME == "light" else "#B8B7B0"

# Imprint palette (first series is always #009E73)
IMPRINT = [
    "#009E73",  # brand green
    "#C475FD",  # lavender
    "#4467A3",  # blue
    "#BD8233",  # ochre
    "#AE3030",  # matte red
]

# Data - Employee performance scores across departments
np.random.seed(42)

raw_data = {
    "Engineering": np.random.normal(78, 8, 60),
    "Sales": np.random.normal(72, 12, 55),
    "Marketing": np.random.normal(75, 6, 50),
    "Operations": np.random.normal(68, 10, 65),
    "HR": np.random.normal(74, 7, 45),
}

# Add some outliers (constrained to 0-100 range)
raw_data["Sales"] = np.append(raw_data["Sales"], [45, 98])
raw_data["Operations"] = np.append(raw_data["Operations"], [42, 95])
raw_data["HR"] = np.append(raw_data["HR"], [50])

# Clip all values to 0-100 range
for cat in raw_data:
    raw_data[cat] = np.clip(raw_data[cat], 0, 100)

# Compute box plot statistics with notches for each department, then rank by
# median descending — turns the plot into a leaderboard-style comparison
# instead of an arbitrary department order.
stats = []
for cat, values in raw_data.items():
    q1 = np.percentile(values, 25)
    q2 = np.percentile(values, 50)
    q3 = np.percentile(values, 75)
    mean = values.mean()
    iqr = q3 - q1
    n = len(values)

    lower_fence = q1 - 1.5 * iqr
    upper_fence = q3 + 1.5 * iqr
    in_range = values[(values >= lower_fence) & (values <= upper_fence)]
    lower_whisker = in_range.min() if len(in_range) > 0 else q1
    upper_whisker = in_range.max() if len(in_range) > 0 else q3

    # Notch: 95% CI around median = ±1.57 × IQR / √n
    notch_width = 1.57 * iqr / np.sqrt(n)

    outliers = values[(values < lower_fence) | (values > upper_fence)]

    stats.append(
        {
            "category": cat,
            "q1": q1,
            "q2": q2,
            "q3": q3,
            "mean": mean,
            "upper": upper_whisker,
            "lower": lower_whisker,
            "notch_lower": q2 - notch_width,
            "notch_upper": q2 + notch_width,
            "n": n,
            "outliers": outliers,
        }
    )

stats.sort(key=lambda s: s["q2"], reverse=True)
for i, s in enumerate(stats):
    s["color"] = IMPRINT[i]
    s["label"] = f"{s['category']} (n={s['n']})"

categories = [s["label"] for s in stats]

# Variable box width, proportional to sqrt(sample size) — the classic
# varwidth-boxplot convention, so a wider box visually signals a more
# trustworthy notch, not just decoration.
n_values = [s["n"] for s in stats]
n_min, n_max = min(n_values), max(n_values)


def _width_for_n(n):
    if n_max == n_min:
        return 0.55
    t = (n - n_min) / (n_max - n_min)
    return 0.42 + t * (0.68 - 0.42)


# Create figure
p = figure(
    width=3200,
    height=1800,
    title="box-notched · python · bokeh · anyplot.ai",
    x_range=categories,
    y_range=(0, 105),
    y_axis_label="Performance Score (0–100)",
    x_axis_label="Department (ranked by median, n = sample size)",
    toolbar_location=None,
    min_border_bottom=170,
    min_border_left=190,
    min_border_top=120,
    min_border_right=60,
)

# Styling — canonical sizes for the 3200x1800 canvas
p.title.text_font_size = "50pt"
p.title.text_font_style = "bold"
p.xaxis.axis_label_text_font_size = "42pt"
p.yaxis.axis_label_text_font_size = "42pt"
p.xaxis.major_label_text_font_size = "30pt"
p.yaxis.major_label_text_font_size = "34pt"

# Theme-adaptive chrome
p.background_fill_color = PAGE_BG
p.border_fill_color = PAGE_BG
# No full-rectangle outline — the bottom/left axis lines already form the
# L-shaped frame convention; a plot-wide outline would add top/right edges.
p.outline_line_color = None

p.title.text_color = INK
p.xaxis.axis_label_text_color = INK
p.yaxis.axis_label_text_color = INK
p.xaxis.major_label_text_color = INK_SOFT
p.yaxis.major_label_text_color = INK_SOFT
p.xaxis.axis_line_color = INK_SOFT
p.yaxis.axis_line_color = INK_SOFT
p.xaxis.major_tick_line_color = INK_SOFT
p.yaxis.major_tick_line_color = INK_SOFT

p.xgrid.grid_line_color = None
p.ygrid.grid_line_color = INK
p.ygrid.grid_line_alpha = 0.15

# Draw each notched box manually, with width scaled to sample size and a
# hollow mean-diamond next to the median notch — the divergence between the
# two is itself a signal of skew, giving the reader a second story beyond
# "which department is on top".
for i, s in enumerate(stats):
    q1, q2, q3 = s["q1"], s["q2"], s["q3"]
    nl, nu = s["notch_lower"], s["notch_upper"]
    lower, upper = s["lower"], s["upper"]
    color = s["color"]

    box_width = _width_for_n(s["n"])
    half_width = box_width / 2
    notch_indent = box_width / 4
    cap_width = box_width / 3

    # Lower box (q1 to notch_lower)
    p.quad(
        top=[nl],
        bottom=[q1],
        left=[i - half_width],
        right=[i + half_width],
        fill_color=color,
        fill_alpha=0.88,
        line_color=INK_SOFT,
        line_width=2,
    )

    # Upper box (notch_upper to q3)
    p.quad(
        top=[q3],
        bottom=[nu],
        left=[i - half_width],
        right=[i + half_width],
        fill_color=color,
        fill_alpha=0.88,
        line_color=INK_SOFT,
        line_width=2,
    )

    # Left notch triangle
    p.patch(
        x=[i - half_width, i - notch_indent, i - half_width],
        y=[nl, q2, nu],
        fill_color=color,
        fill_alpha=0.88,
        line_color=INK_SOFT,
        line_width=2,
    )

    # Right notch triangle
    p.patch(
        x=[i + half_width, i + notch_indent, i + half_width],
        y=[nl, q2, nu],
        fill_color=color,
        fill_alpha=0.88,
        line_color=INK_SOFT,
        line_width=2,
    )

    # Median line (legend groups repeated labels into a single entry)
    p.segment(
        x0=[i - notch_indent],
        x1=[i + notch_indent],
        y0=[q2],
        y1=[q2],
        line_color=INK,
        line_width=4,
        legend_label="Median",
    )

    # Mean marker — hollow diamond, offset just past the notch
    p.scatter(
        x=[i + notch_indent + 0.06],
        y=[s["mean"]],
        marker="diamond",
        size=20,
        fill_color=PAGE_BG,
        line_color=INK,
        line_width=2.5,
        legend_label="Mean",
    )

    # Whiskers (vertical lines)
    p.segment(x0=[i], x1=[i], y0=[q3], y1=[upper], line_color=INK_SOFT, line_width=2)
    p.segment(x0=[i], x1=[i], y0=[q1], y1=[lower], line_color=INK_SOFT, line_width=2)

    # Whisker caps (horizontal lines)
    p.segment(x0=[i - cap_width], x1=[i + cap_width], y0=[upper], y1=[upper], line_color=INK_SOFT, line_width=2)
    p.segment(x0=[i - cap_width], x1=[i + cap_width], y0=[lower], y1=[lower], line_color=INK_SOFT, line_width=2)

# Invisible hover-target quads (whisker-to-whisker) so the HTML export lets
# readers inspect the exact q1/median/q3/mean/n behind each box on hover.
hover_source = ColumnDataSource(
    data={
        "left": [i - _width_for_n(s["n"]) / 2 for i, s in enumerate(stats)],
        "right": [i + _width_for_n(s["n"]) / 2 for i, s in enumerate(stats)],
        "top": [s["upper"] for s in stats],
        "bottom": [s["lower"] for s in stats],
        "category": [s["category"] for s in stats],
        "q1": [s["q1"] for s in stats],
        "median": [s["q2"] for s in stats],
        "q3": [s["q3"] for s in stats],
        "mean": [s["mean"] for s in stats],
        "n": [s["n"] for s in stats],
    }
)
hover_glyph = p.quad(
    top="top", bottom="bottom", left="left", right="right", source=hover_source, fill_alpha=0, line_alpha=0
)
p.add_tools(
    HoverTool(
        renderers=[hover_glyph],
        tooltips=[
            ("Department", "@category"),
            ("n", "@n"),
            ("Q1", "@q1{0.1f}"),
            ("Median", "@median{0.1f}"),
            ("Q3", "@q3{0.1f}"),
            ("Mean", "@mean{0.1f}"),
        ],
    )
)

# Draw outliers
outlier_x, outlier_y, outlier_color = [], [], []
for s in stats:
    for o in s["outliers"]:
        outlier_x.append(s["label"])
        outlier_y.append(o)
        outlier_color.append(s["color"])

if outlier_x:
    outlier_source = ColumnDataSource(data={"x": outlier_x, "y": outlier_y, "color": outlier_color})
    p.scatter(
        x="x",
        y="y",
        source=outlier_source,
        marker="circle",
        size=16,
        fill_color=PAGE_BG,
        line_color="color",
        line_width=3,
        fill_alpha=0.9,
    )

# Legend — explains the median-notch vs. mean-diamond encoding
p.legend.location = "top_right"
p.legend.orientation = "horizontal"
p.legend.background_fill_color = ELEVATED_BG
p.legend.border_line_color = INK_SOFT
p.legend.label_text_color = INK_SOFT
p.legend.label_text_font_size = "28pt"
p.legend.glyph_width = 40
p.legend.glyph_height = 40
p.legend.spacing = 30
p.legend.padding = 16
p.legend.margin = 20

# Save HTML
output_file(f"plot-{THEME}.html")
save(p)

# Screenshot with headless Chrome
W, H = 3200, 1800
opts = Options()
for arg in (
    "--headless=new",
    "--no-sandbox",
    "--disable-dev-shm-usage",
    "--disable-gpu",
    f"--window-size={W},{H}",
    "--hide-scrollbars",
):
    opts.add_argument(arg)

driver = webdriver.Chrome(options=opts)
driver.set_window_size(W, H)
driver.get(f"file://{Path(f'plot-{THEME}.html').resolve()}")
# Pin the exact viewport via CDP — headless Chrome's --window-size sets the
# OUTER window and still reserves a phantom title-bar height, which would
# otherwise shrink the screenshot below H.
driver.execute_cdp_cmd(
    "Emulation.setDeviceMetricsOverride", {"width": W, "height": H, "deviceScaleFactor": 1, "mobile": False}
)
time.sleep(3)
driver.save_screenshot(f"plot-{THEME}.png")
driver.quit()
Runnable source as JSON, for any HTTP client: https://api.anyplot.ai/specs/box-notched/bokeh/code. Any spec id and library id listed in llms-full.txt fit the same URL shape; every URL below is complete and callable.
{
  "spec_id": "box-notched",
  "language": "python",
  "library": "bokeh",
  "page": "https://anyplot.ai/box-notched/python/bokeh",
  "hub": "https://anyplot.ai/box-notched",
  "code_json": "https://api.anyplot.ai/specs/box-notched/bokeh/code",
  "spec_json": "https://api.anyplot.ai/specs/box-notched",
  "render_light_png": "https://storage.googleapis.com/anyplot-images/plots/box-notched/python/bokeh/plot-light.png",
  "render_dark_png": "https://storage.googleapis.com/anyplot-images/plots/box-notched/python/bokeh/plot-dark.png",
  "interactive_light_html": "https://storage.googleapis.com/anyplot-images/plots/box-notched/python/bokeh/plot-light.html",
  "interactive_dark_html": "https://storage.googleapis.com/anyplot-images/plots/box-notched/python/bokeh/plot-dark.html",
  "quality_score": 96.0,
  "license": "MIT",
  "guide": "https://anyplot.ai/llms.txt"
}
Part of Notched Box Plot on anyplot.ai.