The same plot in 14 other libraries — Python: Altair, Bokeh, lets-plot, Matplotlib, Plotly, plotnine, Pygal, Seaborn; R: ggplot2; JavaScript: Chart.js, D3.js, Apache ECharts, Highcharts, MUI X Charts. Compare all 15 side by side: Notched Box Plot in Python, R, Julia and JavaScript.
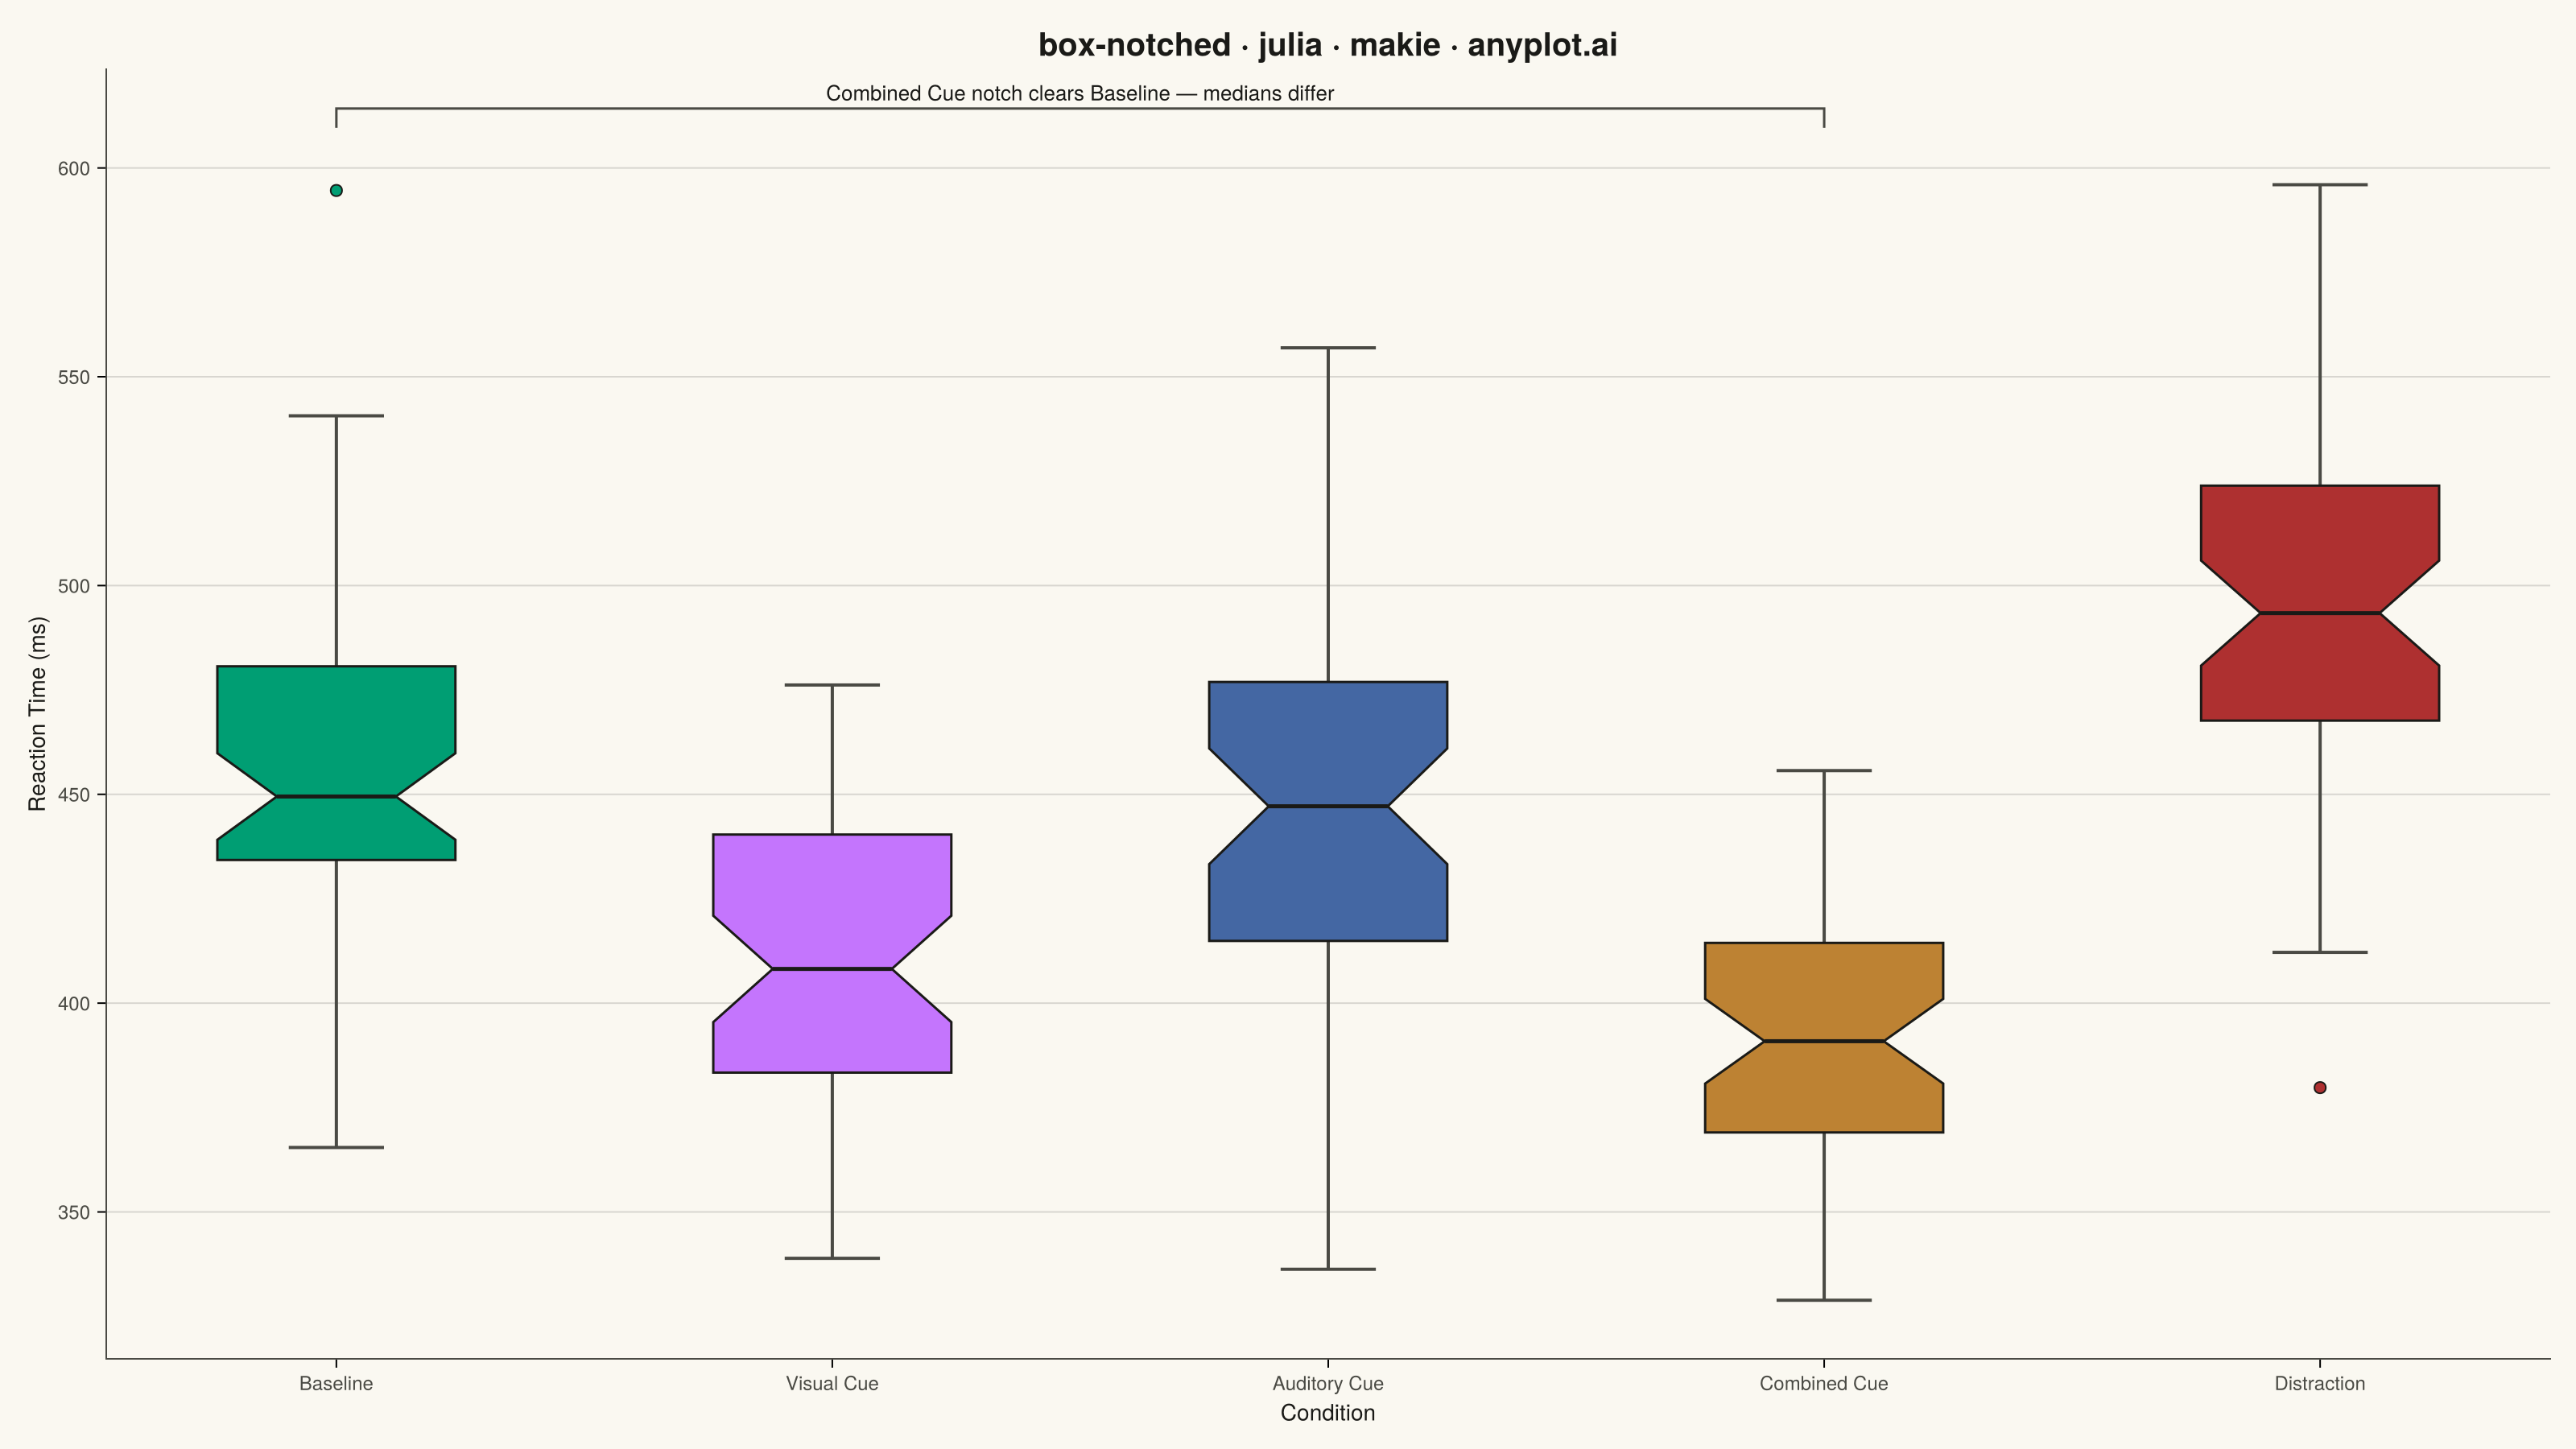
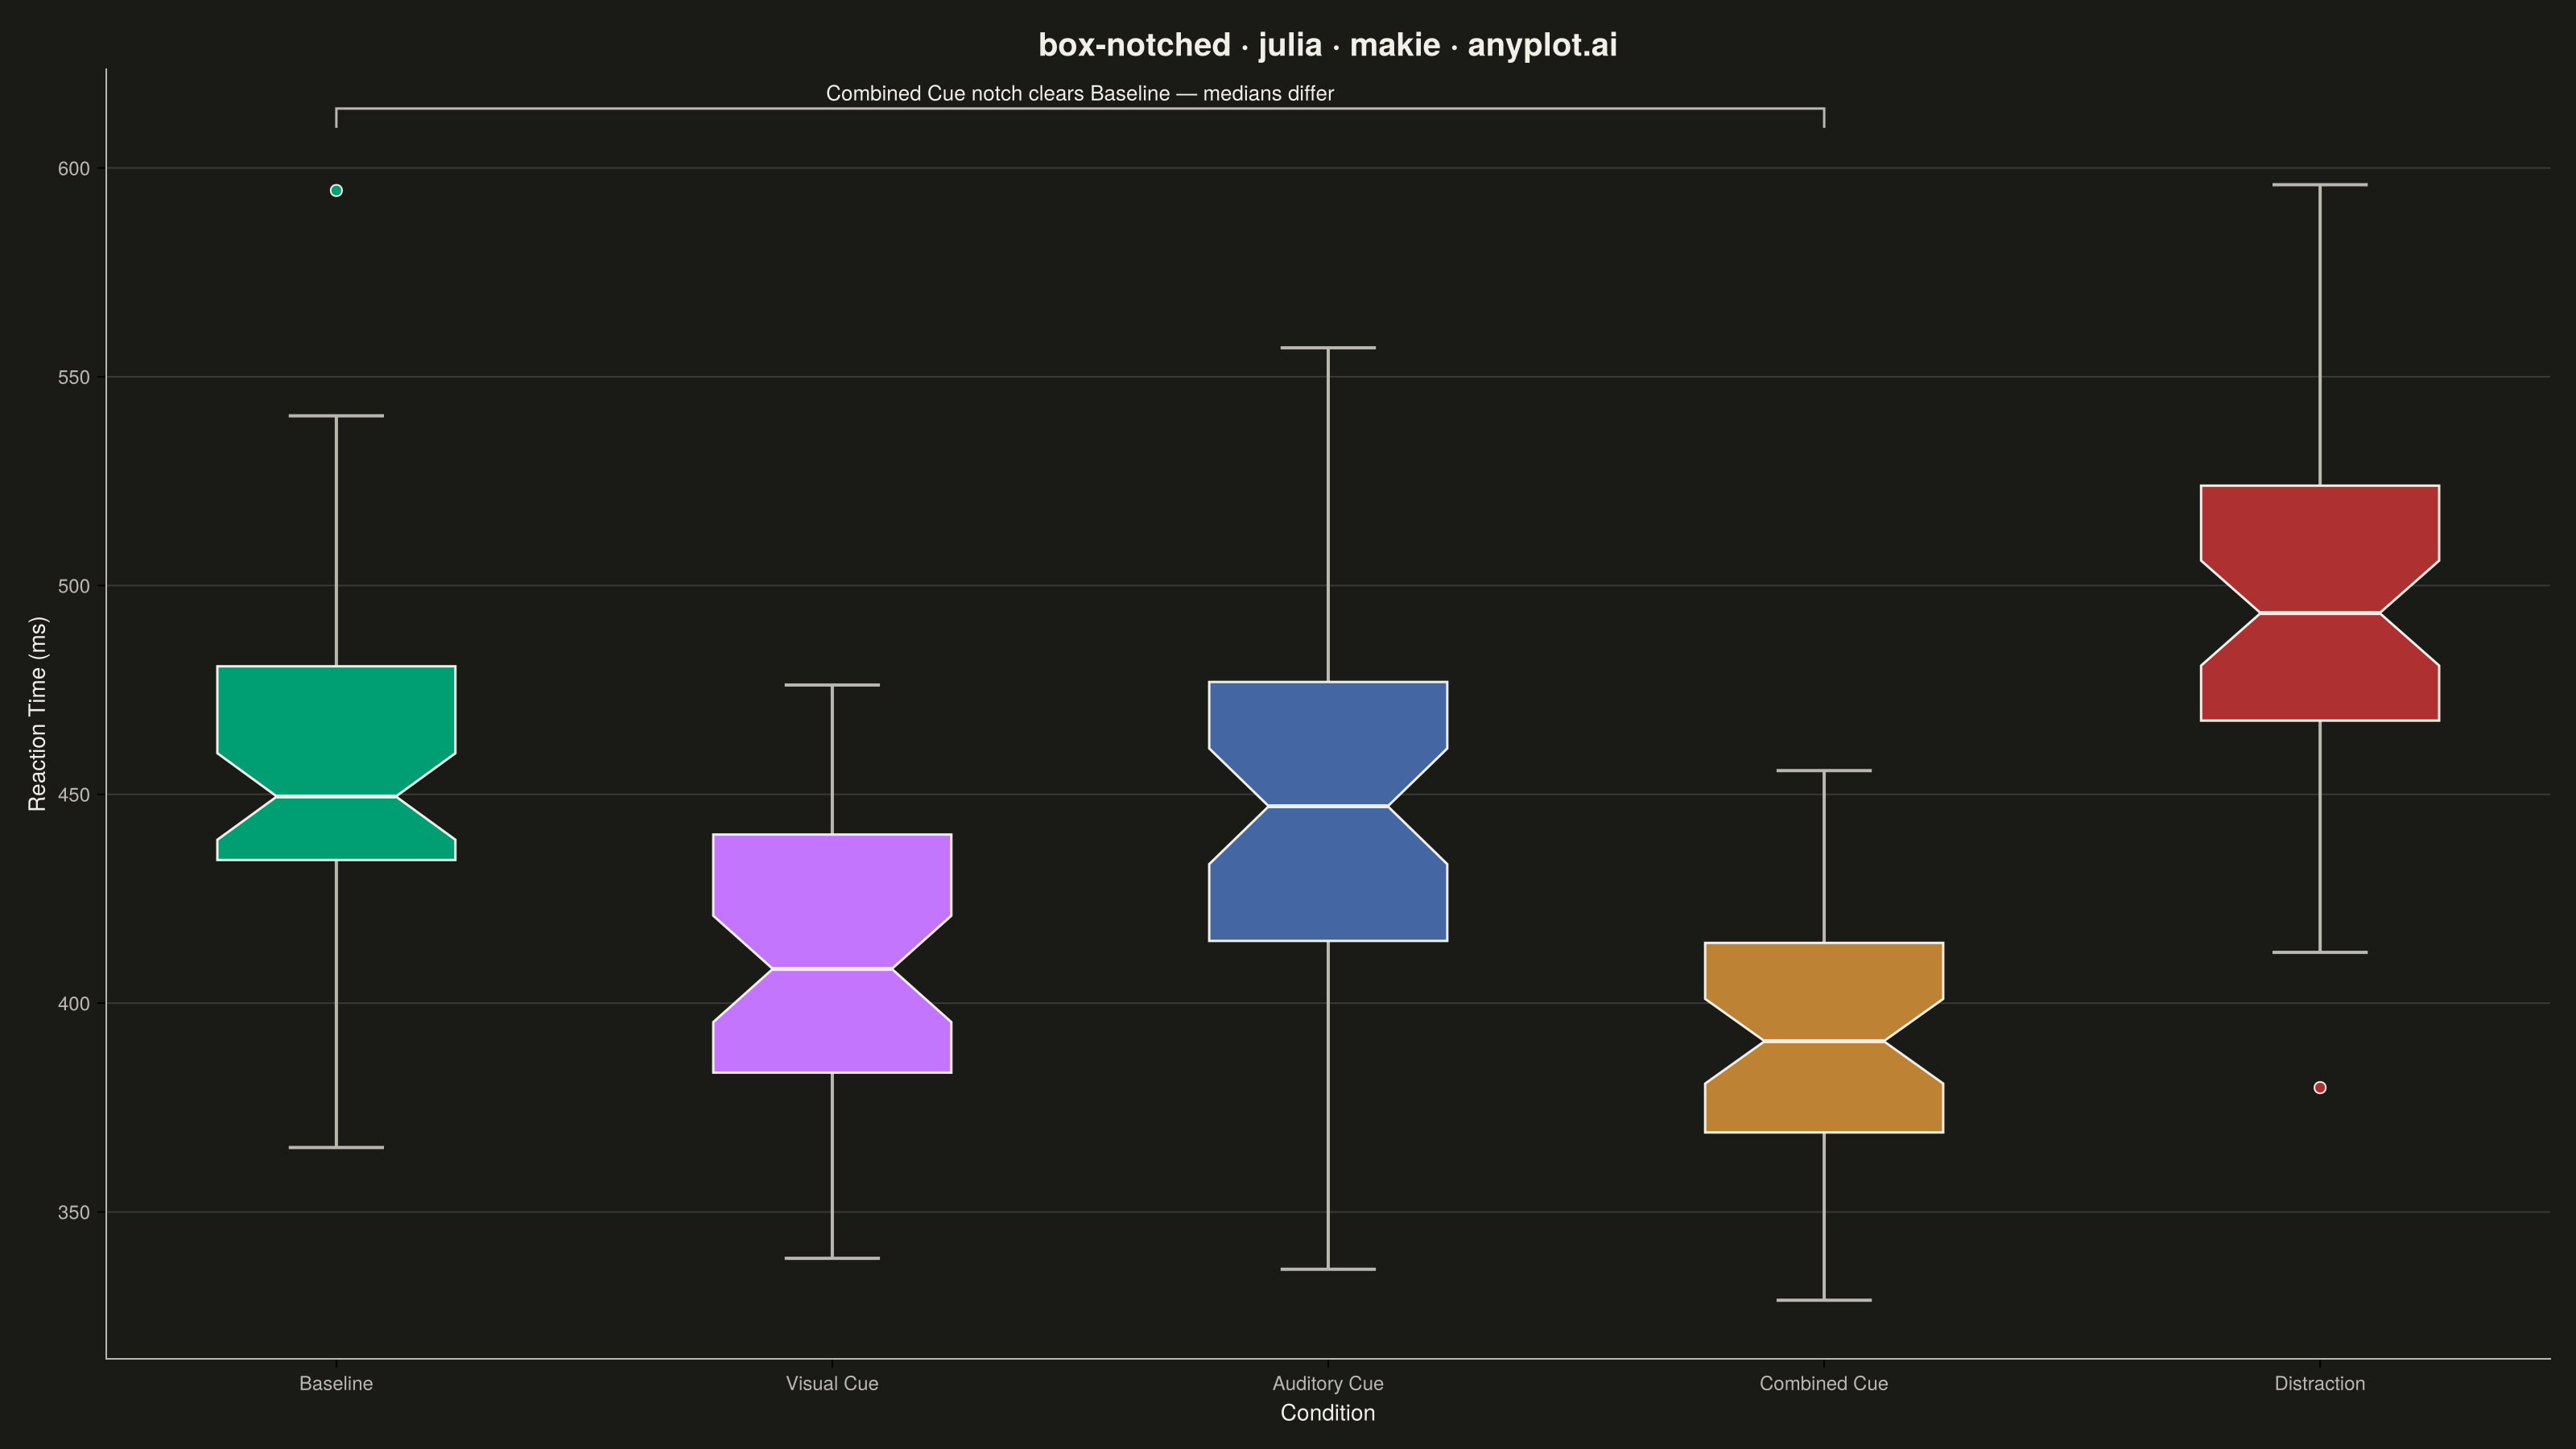
A notched box plot extends the standard box plot by adding notches around the median that represent a confidence interval. If the notches of two boxes do not overlap, this provides visual evidence that the medians differ significantly. This variant is particularly valuable for quick visual hypothesis testing and comparing group medians in statistical analysis.
# anyplot.ai
# box-notched: Notched Box Plot
# Library: makie 0.21.9 | Julia 1.11.9
# Quality: 93/100 | Created: 2026-08-18

using CairoMakie
using Colors
using Random
using Statistics

Random.seed!(42)

# --- Theme tokens -----------------------------------------------------------
const THEME    = get(ENV, "ANYPLOT_THEME", "light")
const PAGE_BG  = THEME == "light" ? colorant"#FAF8F1" : colorant"#1A1A17"
const INK      = THEME == "light" ? colorant"#1A1A17" : colorant"#F0EFE8"
const INK_SOFT = THEME == "light" ? colorant"#4A4A44" : colorant"#B8B7B0"

# Imprint categorical palette — 8 hues, theme-independent, hybrid-v3 sort
const IMPRINT_PALETTE = [
    colorant"#009E73",  # 1 — brand green, ALWAYS first series
    colorant"#C475FD",  # 2 — lavender
    colorant"#4467A3",  # 3 — blue
    colorant"#BD8233",  # 4 — ochre
    colorant"#AE3030",  # 5 — matte red
]

# --- Data ---------------------------------------------------------------
# Reaction times (ms) across five cue conditions in a cognitive science
# experiment. Sample sizes and spreads vary slightly, as they would in real
# collected data, so some notches overlap (no significant median shift)
# while others clearly separate.
conditions = ["Baseline", "Visual Cue", "Auditory Cue", "Combined Cue", "Distraction"]
means       = [450.0, 410.0, 440.0, 390.0, 480.0]
stds        = [40.0, 35.0, 45.0, 30.0, 50.0]
sample_size = 50

group_index = Int[]
reaction_ms = Float64[]
point_color = RGB{Float64}[]
for (i, (mu, sigma)) in enumerate(zip(means, stds))
    append!(group_index, fill(i, sample_size))
    append!(reaction_ms, randn(sample_size) .* sigma .+ mu)
    append!(point_color, fill(IMPRINT_PALETTE[i], sample_size))
end

# Per-group median + notch band (±1.57 * IQR / sqrt(n), matching the spec's
# 95%-CI notch formula) so the significance callout below is derived from the
# actual sampled data rather than hard-coded.
group_vals   = [reaction_ms[group_index .== i] for i in eachindex(conditions)]
group_median = [median(v) for v in group_vals]
group_notch  = [1.57 * (quantile(v, 0.75) - quantile(v, 0.25)) / sqrt(length(v)) for v in group_vals]
baseline_lo, baseline_hi = group_median[1] - group_notch[1], group_median[1] + group_notch[1]

# Dense y-axis ticks: every 50ms across the full sampled range, so the lower
# half of the data reads with the same reference density as the upper half.
y_tick_lo = floor(minimum(reaction_ms) / 50) * 50
y_tick_hi = ceil(maximum(reaction_ms) / 50) * 50

# --- Plot -----------------------------------------------------------------
fig = Figure(
    size            = (1600, 900),
    fontsize        = 14,
    backgroundcolor = PAGE_BG,
)

ax = Axis(
    fig[1, 1];
    title              = "box-notched · julia · makie · anyplot.ai",
    titlesize          = 20,
    titlecolor         = INK,
    xlabel             = "Condition",
    ylabel             = "Reaction Time (ms)",
    xlabelsize         = 14,
    ylabelsize         = 14,
    xlabelcolor        = INK,
    ylabelcolor        = INK,
    xticks             = (1:length(conditions), conditions),
    xticklabelsize     = 12,
    yticks             = y_tick_lo:50:y_tick_hi,
    yticklabelsize     = 12,
    xticklabelcolor    = INK_SOFT,
    yticklabelcolor    = INK_SOFT,
    backgroundcolor    = PAGE_BG,
    topspinevisible    = false,
    rightspinevisible  = false,
    leftspinecolor     = INK_SOFT,
    bottomspinecolor   = INK_SOFT,
    xgridvisible       = false,
    ygridcolor         = RGBAf(INK.r, INK.g, INK.b, 0.15),
)

boxplot!(
    ax, group_index, reaction_ms;
    color               = point_color,
    width               = 0.6,
    show_notch          = true,
    notchwidth          = 0.5,
    strokecolor         = INK,
    strokewidth         = 1.5,
    mediancolor         = INK,
    medianlinewidth     = 2.5,
    whiskerwidth        = 0.4,
    whiskercolor        = INK_SOFT,
    whiskerlinewidth    = 2.0,
    markersize          = 10,
    outlierstrokecolor  = INK,
    outlierstrokewidth  = 1.0,
)

# Significance callout: connect Baseline to whichever condition's notch band
# clears Baseline's with a Makie `bracket!` annotation, making the "quick
# visual hypothesis testing" story explicit rather than requiring the viewer
# to compare notch bands by eye. Picks the condition with the largest median
# gap among the non-overlapping ones so the callout matches the most visually
# obvious separation.
non_overlapping = [i for i in 2:length(conditions)
                    if group_median[i] + group_notch[i] < baseline_lo ||
                       group_median[i] - group_notch[i] > baseline_hi]
if !isempty(non_overlapping)
    callout_idx = non_overlapping[argmax(abs.(group_median[non_overlapping] .- group_median[1]))]
    bracket_y = maximum(vcat(group_vals[1], group_vals[callout_idx])) + 15
    bracket!(
        ax, 1, bracket_y, callout_idx, bracket_y;
        text        = "$(conditions[callout_idx]) notch clears $(conditions[1]) — medians differ",
        style       = :square,
        orientation = :up,
        width       = 12,
        color       = INK_SOFT,
        textcolor   = INK,
        fontsize    = 13,
        linewidth   = 1.5,
    )
end

# --- Save -------------------------------------------------------------------
save("plot-$(THEME).png", fig; px_per_unit = 2)
Runnable source as JSON, for any HTTP client: https://api.anyplot.ai/specs/box-notched/makie/code. Any spec id and library id listed in llms-full.txt fit the same URL shape; every URL below is complete and callable.
{
  "spec_id": "box-notched",
  "language": "julia",
  "library": "makie",
  "page": "https://anyplot.ai/box-notched/julia/makie",
  "hub": "https://anyplot.ai/box-notched",
  "code_json": "https://api.anyplot.ai/specs/box-notched/makie/code",
  "spec_json": "https://api.anyplot.ai/specs/box-notched",
  "render_light_png": "https://storage.googleapis.com/anyplot-images/plots/box-notched/julia/makie/plot-light.png",
  "render_dark_png": "https://storage.googleapis.com/anyplot-images/plots/box-notched/julia/makie/plot-dark.png",
  "quality_score": 93.0,
  "license": "MIT",
  "guide": "https://anyplot.ai/llms.txt"
}
Part of Notched Box Plot on anyplot.ai.