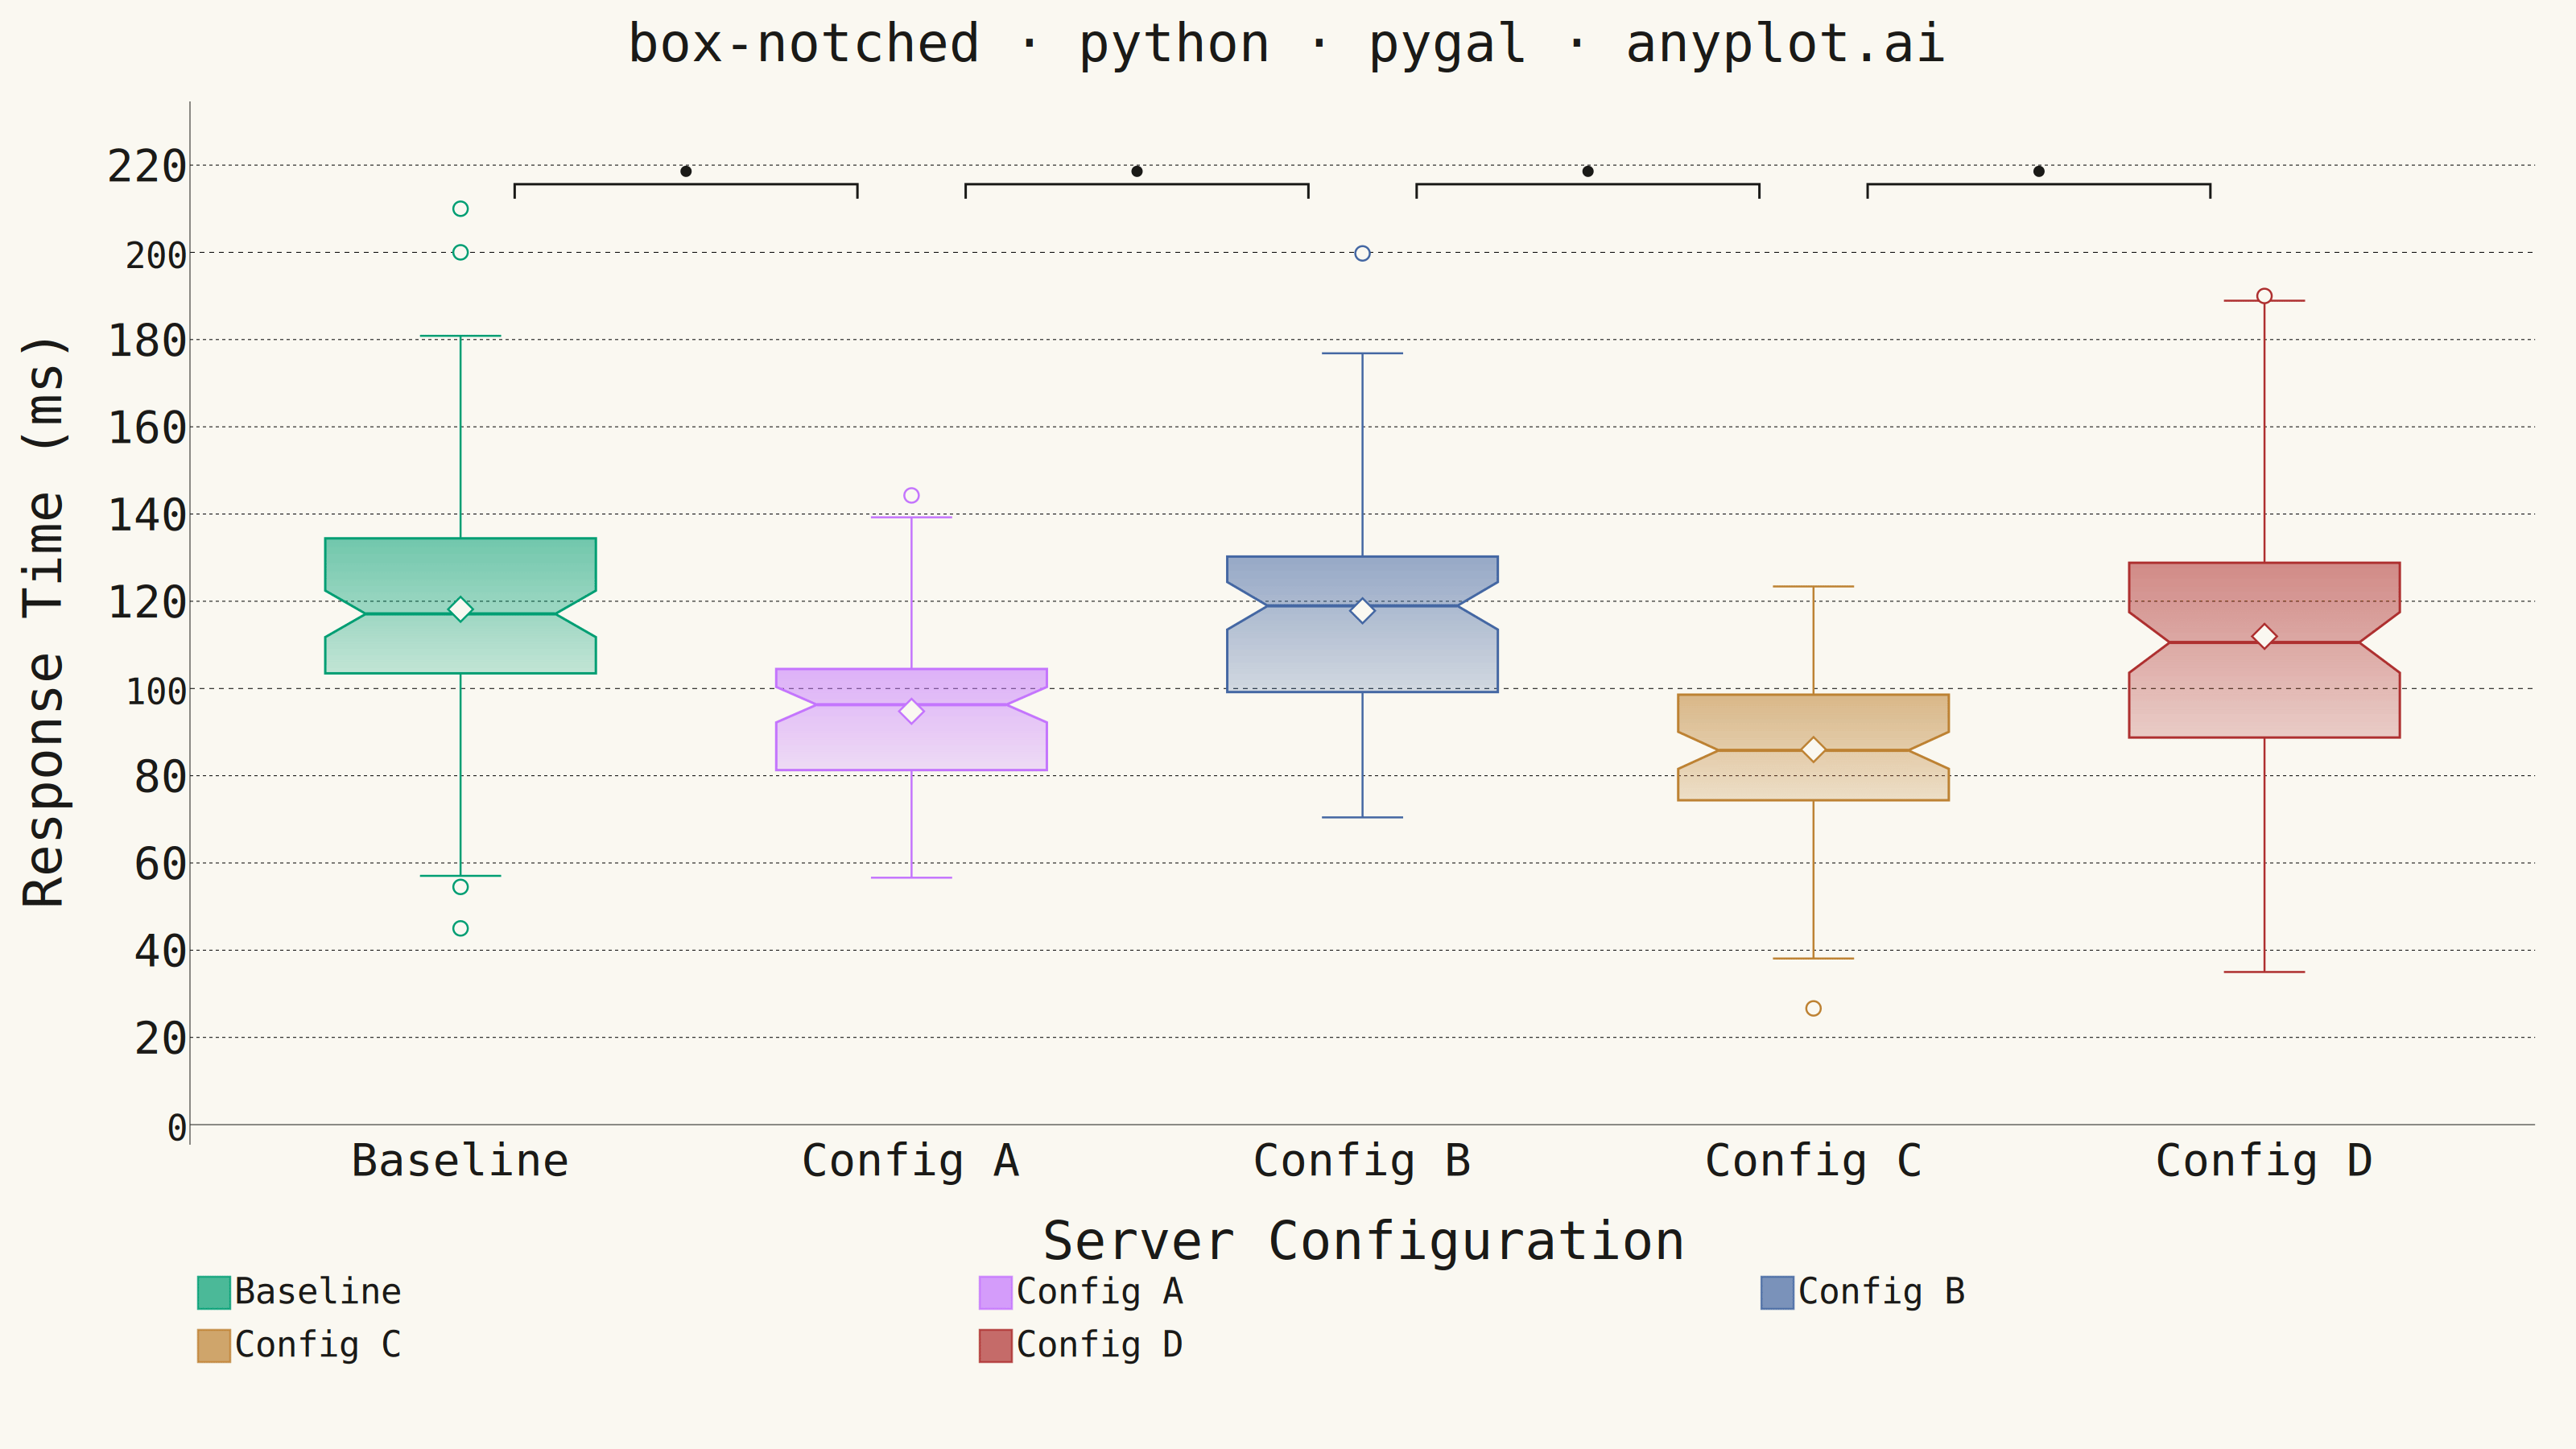
A notched box plot extends the standard box plot by adding notches around the median that represent a confidence interval. If the notches of two boxes do not overlap, this provides visual evidence that the medians differ significantly. This variant is particularly valuable for quick visual hypothesis testing and comparing group medians in statistical analysis.
""" anyplot.ai
box-notched: Notched Box Plot
Library: pygal 3.1.3 | Python 3.13.15
Quality: 90/100 | Updated: 2026-08-18
"""

import os
import re
import xml.etree.ElementTree as ET

import cairosvg
import numpy as np
import pygal
from pygal.style import Style


SVG_NS = "http://www.w3.org/2000/svg"

# Theme tokens
THEME = os.getenv("ANYPLOT_THEME", "light")
PAGE_BG = "#FAF8F1" if THEME == "light" else "#1A1A17"
INK = "#1A1A17" if THEME == "light" else "#F0EFE8"
INK_MUTED = "#6B6A63" if THEME == "light" else "#A8A79F"
IMPRINT = ("#009E73", "#C475FD", "#4467A3", "#BD8233", "#AE3030")

# Data - Generate response times for different server configurations
np.random.seed(42)
categories = ["Baseline", "Config A", "Config B", "Config C", "Config D"]
data = {
    "Baseline": np.random.normal(120, 25, 80),
    "Config A": np.random.normal(95, 20, 80),
    "Config B": np.random.normal(115, 22, 80),
    "Config C": np.random.normal(85, 18, 80),
    "Config D": np.random.normal(110, 30, 80),
}
data["Baseline"] = np.append(data["Baseline"], [200, 210, 45])
data["Config D"] = np.append(data["Config D"], [190, 35])

# Calculate notched box plot statistics (inlined)
stats = {}
for cat in categories:
    values = data[cat]
    q1 = np.percentile(values, 25)
    median = np.percentile(values, 50)
    q3 = np.percentile(values, 75)
    iqr = q3 - q1
    n = len(values)

    notch_width = 1.57 * iqr / np.sqrt(n)
    notch_low = median - notch_width
    notch_high = median + notch_width

    whisker_low = max(q1 - 1.5 * iqr, np.min(values))
    whisker_high = min(q3 + 1.5 * iqr, np.max(values))

    outliers = values[(values < q1 - 1.5 * iqr) | (values > q3 + 1.5 * iqr)]

    stats[cat] = {
        "q1": q1,
        "median": median,
        "q3": q3,
        "mean": float(np.mean(values)),
        "notch_low": notch_low,
        "notch_high": notch_high,
        "whisker_low": whisker_low,
        "whisker_high": whisker_high,
        "outliers": outliers.tolist(),
    }

# Custom style (Imprint palette + theme-adaptive chrome)
custom_style = Style(
    background=PAGE_BG,
    plot_background=PAGE_BG,
    foreground=INK,
    foreground_strong=INK,
    foreground_subtle=INK_MUTED,
    colors=IMPRINT,
    title_font_size=66,
    label_font_size=56,
    major_label_font_size=44,
    legend_font_size=44,
    value_font_size=36,
    stroke_width=2.5,
)

all_values = np.concatenate([data[cat] for cat in categories])
y_min = np.floor(np.min(all_values) / 10) * 10 - 10
# Extra headroom above the tallest whisker so the significance brackets have room to breathe.
y_max = np.ceil(np.max(all_values) / 10) * 10 + 20

# Base chart only supplies axis geometry (ticks, legend, titles) - the notched
# boxes themselves are drawn as an SVG overlay below, aligned to pygal's own
# rendered coordinates. Bar (not Line/XY) is used so each category gets a full
# equal-width slot with generous edge margin - Line/XY reserve almost none,
# which clips box overlays and axis labels near the first/last category.
chart = pygal.Bar(
    width=3200,
    height=1800,
    style=custom_style,
    title="box-notched · python · pygal · anyplot.ai",
    x_title="Server Configuration",
    y_title="Response Time (ms)",
    show_legend=True,
    legend_at_bottom=True,
    legend_box_size=40,
    show_y_guides=True,
    show_x_guides=False,
    margin=50,
    range=(y_min, y_max),
    no_data_text="",
)

chart.x_labels = categories
for category in categories:
    chart.add(category, [{"value": y_min, "label": ""}])

svg_string = chart.render()
if isinstance(svg_string, bytes):
    svg_string = svg_string.decode("utf-8")

# Introspect pygal's own rendered coordinate system (plot origin, x-axis tick
# centers, y-axis value<->pixel mapping) so the overlay aligns exactly with the
# axes regardless of font size / margin choices - no hardcoded pixel guesses.
plot_origin = re.search(r'<g transform="translate\(([\d.]+),\s*([\d.]+)\)" class="plot">', svg_string)
plot_dx, plot_dy = (float(v) for v in plot_origin.groups())

x_block = re.search(r'<g class="axis x">(.*?)</g></g>', svg_string, re.S).group(1)
x_centers = {
    label: plot_dx + float(x_pos)
    for x_pos, label in re.findall(
        r'<path d="M([\d.]+) [\d.]+ v[\d.]+" class="[^"]*" ?/><text x="-?[\d.]+" y="-?[\d.]+" class="[^"]*">([^<]*)</text>',
        x_block,
    )
}

y_block = re.search(r'<g class="axis y[^"]*">(.*?)</g><g class="axis x">', svg_string, re.S).group(1)
y_ticks = [
    (float(value), float(y_pos))
    for y_pos, value in re.findall(
        r'<path d="M[\d.]+ ([\d.]+) h[\d.]+" class="[^"]*" ?/><text x="-?[\d.]+" y="-?[\d.]+" class="[^"]*">([^<]*)</text>',
        y_block,
    )
]
y_scale, y_intercept = np.polyfit([v for v, _ in y_ticks], [p for _, p in y_ticks], 1)


def y_px(value):
    return plot_dy + y_scale * value + y_intercept


centers_sorted = [x_centers[c] for c in categories]
box_spacing = float(np.mean(np.diff(centers_sorted))) if len(centers_sorted) > 1 else 400.0
box_width = box_spacing * 0.6
notch_indent = box_width * 0.15
cap_width = box_width * 0.3

# Parse and augment the rendered SVG
ET.register_namespace("", SVG_NS)
ET.register_namespace("xlink", "http://www.w3.org/1999/xlink")
root = ET.fromstring(svg_string)

# Drop the anchor bars pygal drew for the invisible series - only their tick
# geometry (already extracted above) was needed; the boxes below replace them.
parent_map = {child: parent for parent in root.iter() for child in parent}
for g in list(root.iter(f"{{{SVG_NS}}}g")):
    if g.get("class", "").startswith("series"):
        parent = parent_map.get(g)
        if parent is not None:
            parent.remove(g)

defs = ET.SubElement(root, f"{{{SVG_NS}}}defs")
boxes_group = ET.Element(f"{{{SVG_NS}}}g", attrib={"class": "notched-boxes"})

for i, category in enumerate(categories):
    s = stats[category]
    color = IMPRINT[i % len(IMPRINT)]
    x_center = x_centers[category]
    x_left = x_center - box_width / 2
    x_right = x_center + box_width / 2

    y_q1 = y_px(s["q1"])
    y_q3 = y_px(s["q3"])
    y_med = y_px(s["median"])
    y_mean = y_px(s["mean"])
    y_notch_low = y_px(s["notch_low"])
    y_notch_high = y_px(s["notch_high"])
    y_whisker_low = y_px(s["whisker_low"])
    y_whisker_high = y_px(s["whisker_high"])

    notch_x_left = x_left + notch_indent
    notch_x_right = x_right - notch_indent

    # Subtle top-to-bottom gradient gives each box a touch of depth beyond flat fill-opacity.
    gradient = ET.SubElement(
        defs, f"{{{SVG_NS}}}linearGradient", attrib={"id": f"box-grad-{i}", "x1": "0", "y1": "0", "x2": "0", "y2": "1"}
    )
    ET.SubElement(gradient, f"{{{SVG_NS}}}stop", attrib={"offset": "0%", "stop-color": color, "stop-opacity": "0.55"})
    ET.SubElement(gradient, f"{{{SVG_NS}}}stop", attrib={"offset": "100%", "stop-color": color, "stop-opacity": "0.22"})

    path_d = (
        f"M {x_left} {y_q3} "
        f"L {x_right} {y_q3} "
        f"L {x_right} {y_notch_high} "
        f"L {notch_x_right} {y_med} "
        f"L {x_right} {y_notch_low} "
        f"L {x_right} {y_q1} "
        f"L {x_left} {y_q1} "
        f"L {x_left} {y_notch_low} "
        f"L {notch_x_left} {y_med} "
        f"L {x_left} {y_notch_high} "
        f"Z"
    )

    ET.SubElement(
        boxes_group,
        f"{{{SVG_NS}}}path",
        attrib={"d": path_d, "fill": f"url(#box-grad-{i})", "stroke": color, "stroke-width": "3"},
    )

    ET.SubElement(
        boxes_group,
        f"{{{SVG_NS}}}line",
        attrib={
            "x1": str(notch_x_left),
            "y1": str(y_med),
            "x2": str(notch_x_right),
            "y2": str(y_med),
            "stroke": color,
            "stroke-width": "4",
        },
    )

    ET.SubElement(
        boxes_group,
        f"{{{SVG_NS}}}line",
        attrib={
            "x1": str(x_center),
            "y1": str(y_q3),
            "x2": str(x_center),
            "y2": str(y_whisker_high),
            "stroke": color,
            "stroke-width": "2.5",
        },
    )
    ET.SubElement(
        boxes_group,
        f"{{{SVG_NS}}}line",
        attrib={
            "x1": str(x_center - cap_width / 2),
            "y1": str(y_whisker_high),
            "x2": str(x_center + cap_width / 2),
            "y2": str(y_whisker_high),
            "stroke": color,
            "stroke-width": "2.5",
        },
    )
    ET.SubElement(
        boxes_group,
        f"{{{SVG_NS}}}line",
        attrib={
            "x1": str(x_center),
            "y1": str(y_q1),
            "x2": str(x_center),
            "y2": str(y_whisker_low),
            "stroke": color,
            "stroke-width": "2.5",
        },
    )
    ET.SubElement(
        boxes_group,
        f"{{{SVG_NS}}}line",
        attrib={
            "x1": str(x_center - cap_width / 2),
            "y1": str(y_whisker_low),
            "x2": str(x_center + cap_width / 2),
            "y2": str(y_whisker_low),
            "stroke": color,
            "stroke-width": "2.5",
        },
    )

    # Mean marker (diamond) alongside the median line - the notch already tests the
    # median's confidence interval, the diamond gives the mean for comparison at a glance.
    diamond_r = 11
    ET.SubElement(
        boxes_group,
        f"{{{SVG_NS}}}rect",
        attrib={
            "x": str(x_center - diamond_r),
            "y": str(y_mean - diamond_r),
            "width": str(diamond_r * 2),
            "height": str(diamond_r * 2),
            "fill": PAGE_BG,
            "stroke": color,
            "stroke-width": "2.5",
            "transform": f"rotate(45 {x_center} {y_mean})",
        },
    )

    for outlier in s["outliers"]:
        ET.SubElement(
            boxes_group,
            f"{{{SVG_NS}}}circle",
            attrib={
                "cx": str(x_center),
                "cy": str(y_px(outlier)),
                "r": "9",
                "fill": PAGE_BG,
                "stroke": color,
                "stroke-width": "2.5",
            },
        )

# Significance brackets: a shared row in the headroom above the tallest whisker
# marks adjacent category pairs whose notches do not overlap - the visual
# "quick hypothesis test" the notched box plot exists for (see specification.md).
# Placed a third of the way down from the range ceiling so it clears both the
# title and the y=y_max gridline instead of crowding the nearest gridline.
top_of_range_px = y_px(y_max)
min_whisker_px = min(y_px(stats[c]["whisker_high"]) for c in categories)
bracket_y = top_of_range_px + (min_whisker_px - top_of_range_px) * 0.35
tick_len = 18
for cat_a, cat_b in zip(categories, categories[1:], strict=False):
    stats_a, stats_b = stats[cat_a], stats[cat_b]
    significant = stats_a["notch_high"] < stats_b["notch_low"] or stats_b["notch_high"] < stats_a["notch_low"]
    if not significant:
        continue
    # Inset from the tick centers so consecutive significant pairs read as separate
    # brackets instead of fusing into one continuous line across the whole row.
    inset = box_width * 0.2
    xa, xb = x_centers[cat_a] + inset, x_centers[cat_b] - inset
    ET.SubElement(
        boxes_group,
        f"{{{SVG_NS}}}path",
        attrib={
            "d": f"M {xa} {bracket_y + tick_len} L {xa} {bracket_y} L {xb} {bracket_y} L {xb} {bracket_y + tick_len}",
            "fill": "none",
            "stroke": INK,
            "stroke-width": "3",
        },
    )
    ET.SubElement(
        boxes_group,
        f"{{{SVG_NS}}}circle",
        attrib={"cx": str((xa + xb) / 2), "cy": str(bracket_y - 16), "r": "7", "fill": INK},
    )

root.append(boxes_group)
modified_svg = ET.tostring(root, encoding="unicode")

# Save as PNG and HTML
with open(f"plot-{THEME}.html", "w") as f:
    f.write(modified_svg)

cairosvg.svg2png(
    bytestring=modified_svg.encode("utf-8"), write_to=f"plot-{THEME}.png", output_width=3200, output_height=1800
)
Runnable source as JSON, for any HTTP client: https://api.anyplot.ai/specs/box-notched/pygal/code. Any spec id and library id listed in llms-full.txt fit the same URL shape; every URL below is complete and callable.
{
  "spec_id": "box-notched",
  "language": "python",
  "library": "pygal",
  "page": "https://anyplot.ai/box-notched/python/pygal",
  "hub": "https://anyplot.ai/box-notched",
  "code_json": "https://api.anyplot.ai/specs/box-notched/pygal/code",
  "spec_json": "https://api.anyplot.ai/specs/box-notched",
  "render_light_png": "https://storage.googleapis.com/anyplot-images/plots/box-notched/python/pygal/plot-light.png",
  "render_dark_png": "https://storage.googleapis.com/anyplot-images/plots/box-notched/python/pygal/plot-dark.png",
  "interactive_light_html": "https://storage.googleapis.com/anyplot-images/plots/box-notched/python/pygal/plot-light.html",
  "interactive_dark_html": "https://storage.googleapis.com/anyplot-images/plots/box-notched/python/pygal/plot-dark.html",
  "quality_score": 90.0,
  "license": "MIT",
  "guide": "https://anyplot.ai/llms.txt"
}
Part of Notched Box Plot on anyplot.ai.