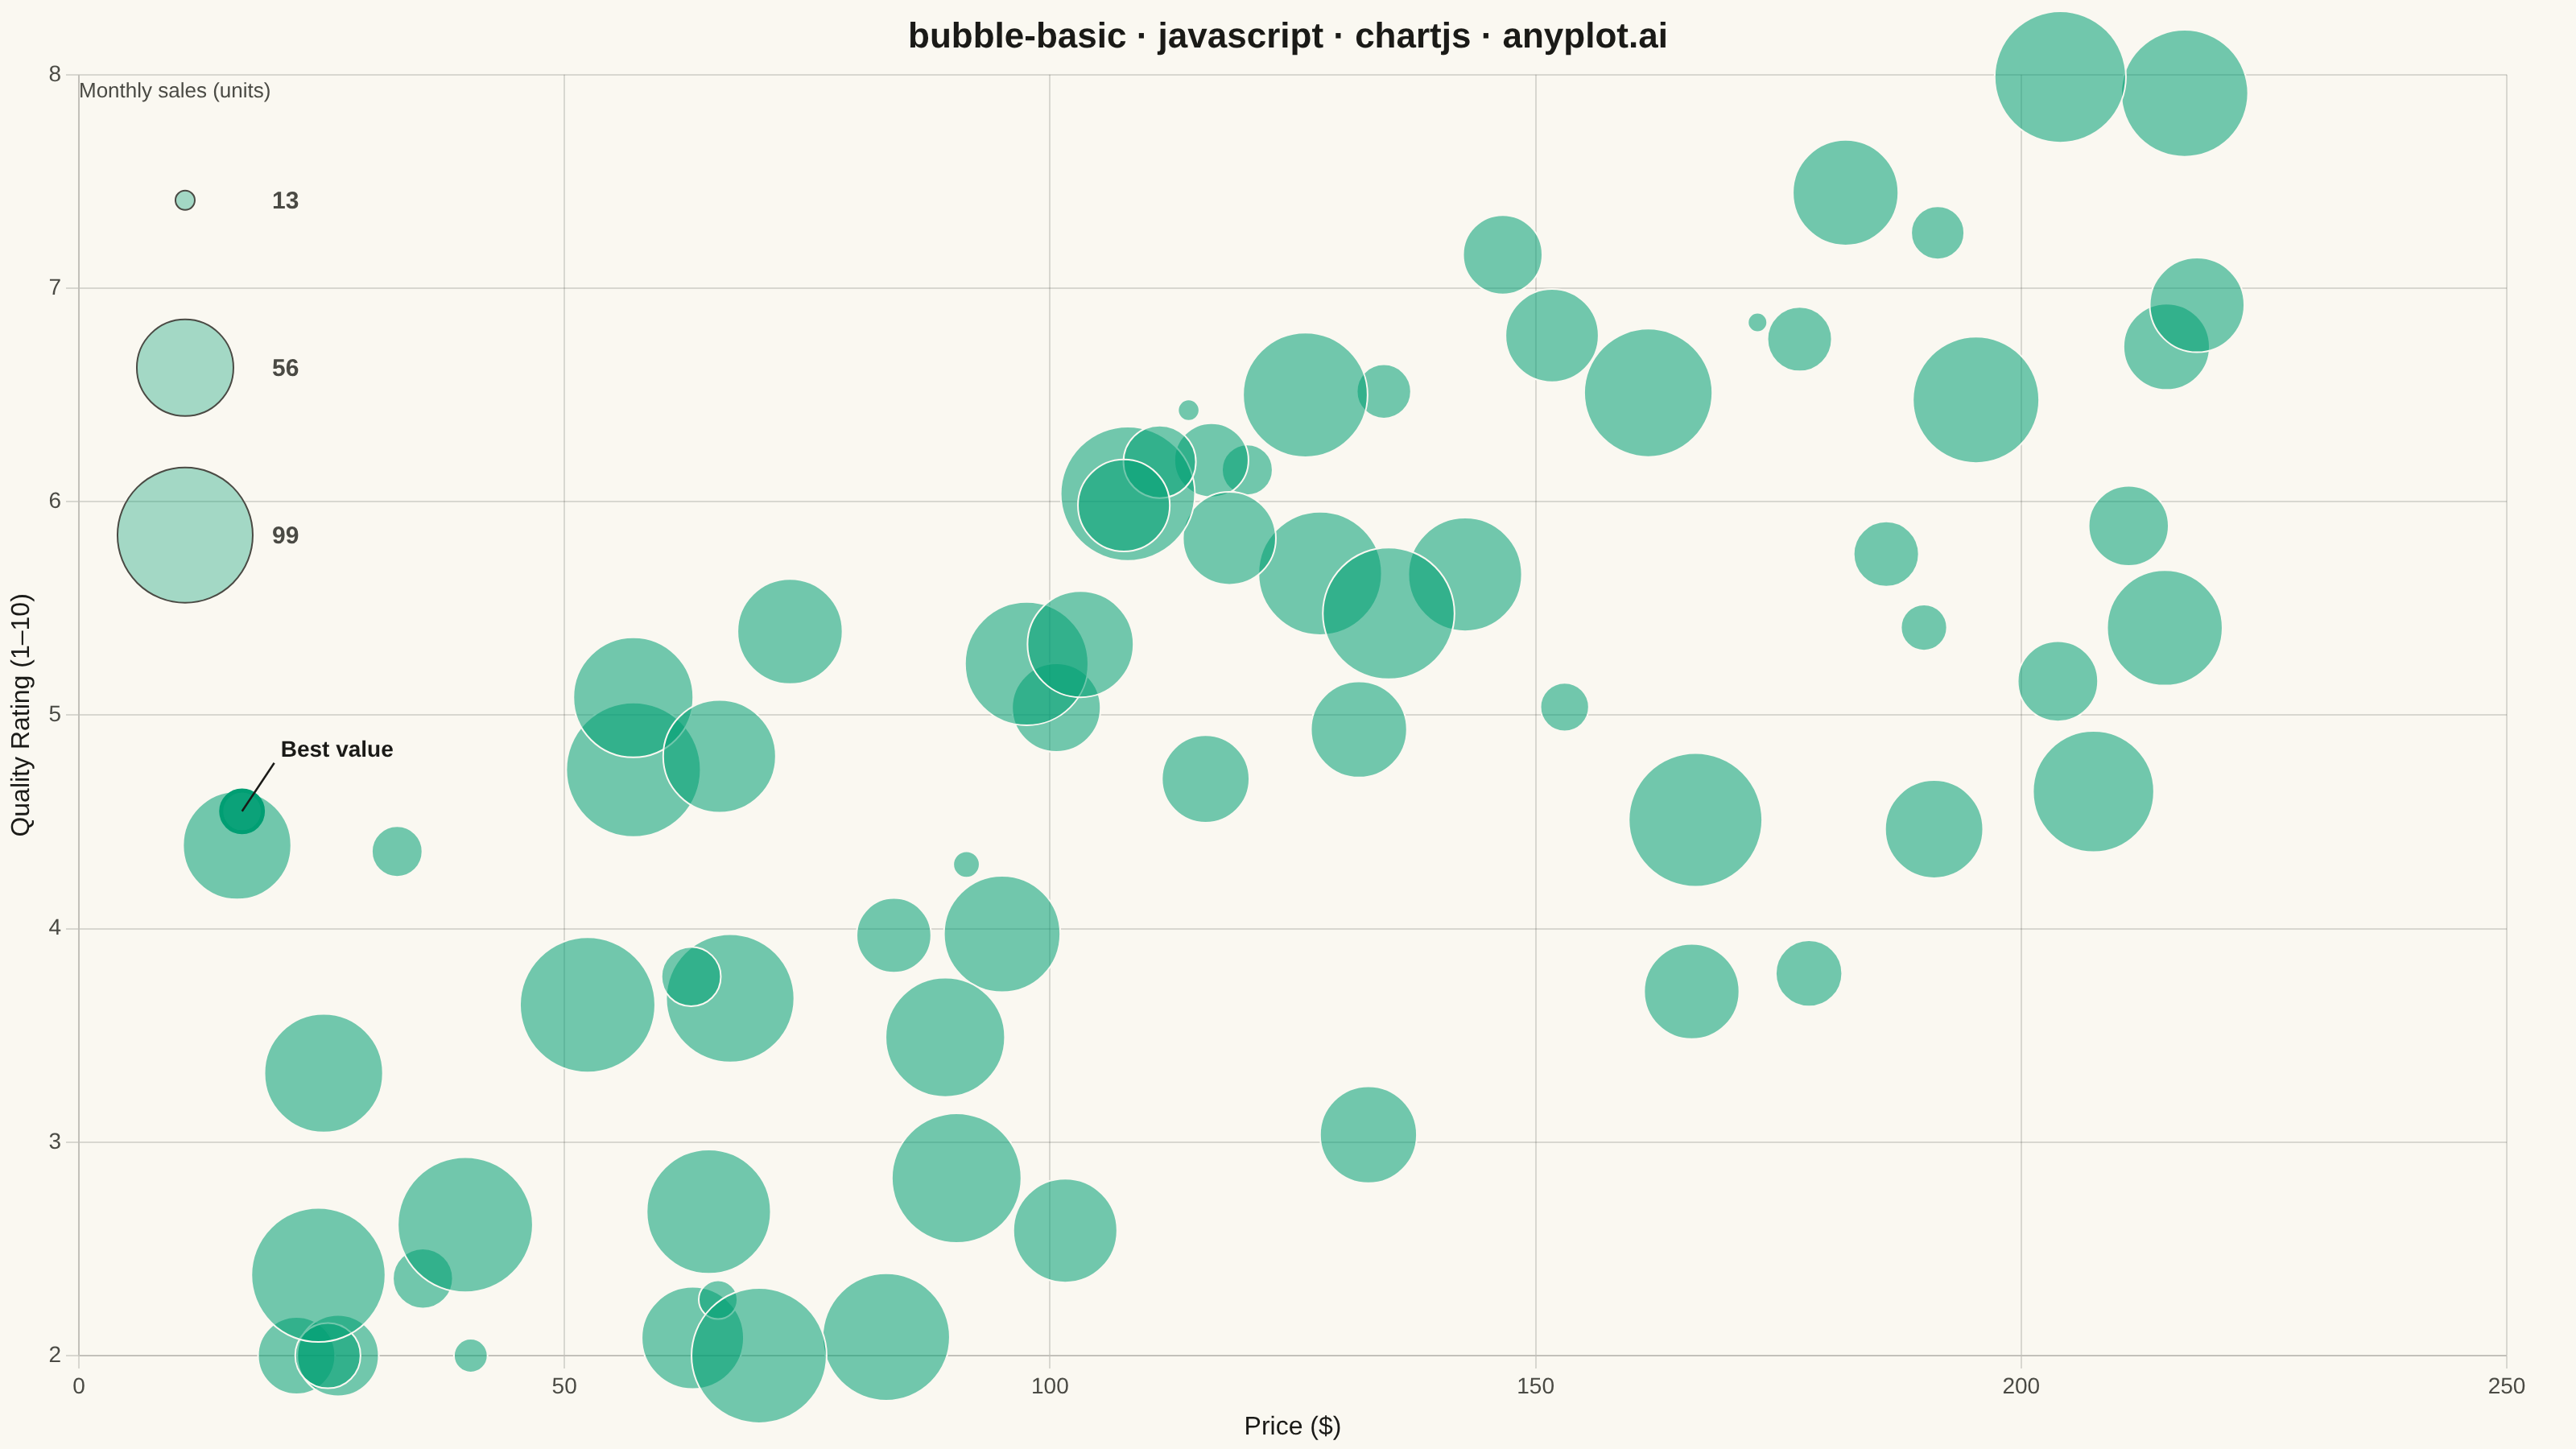
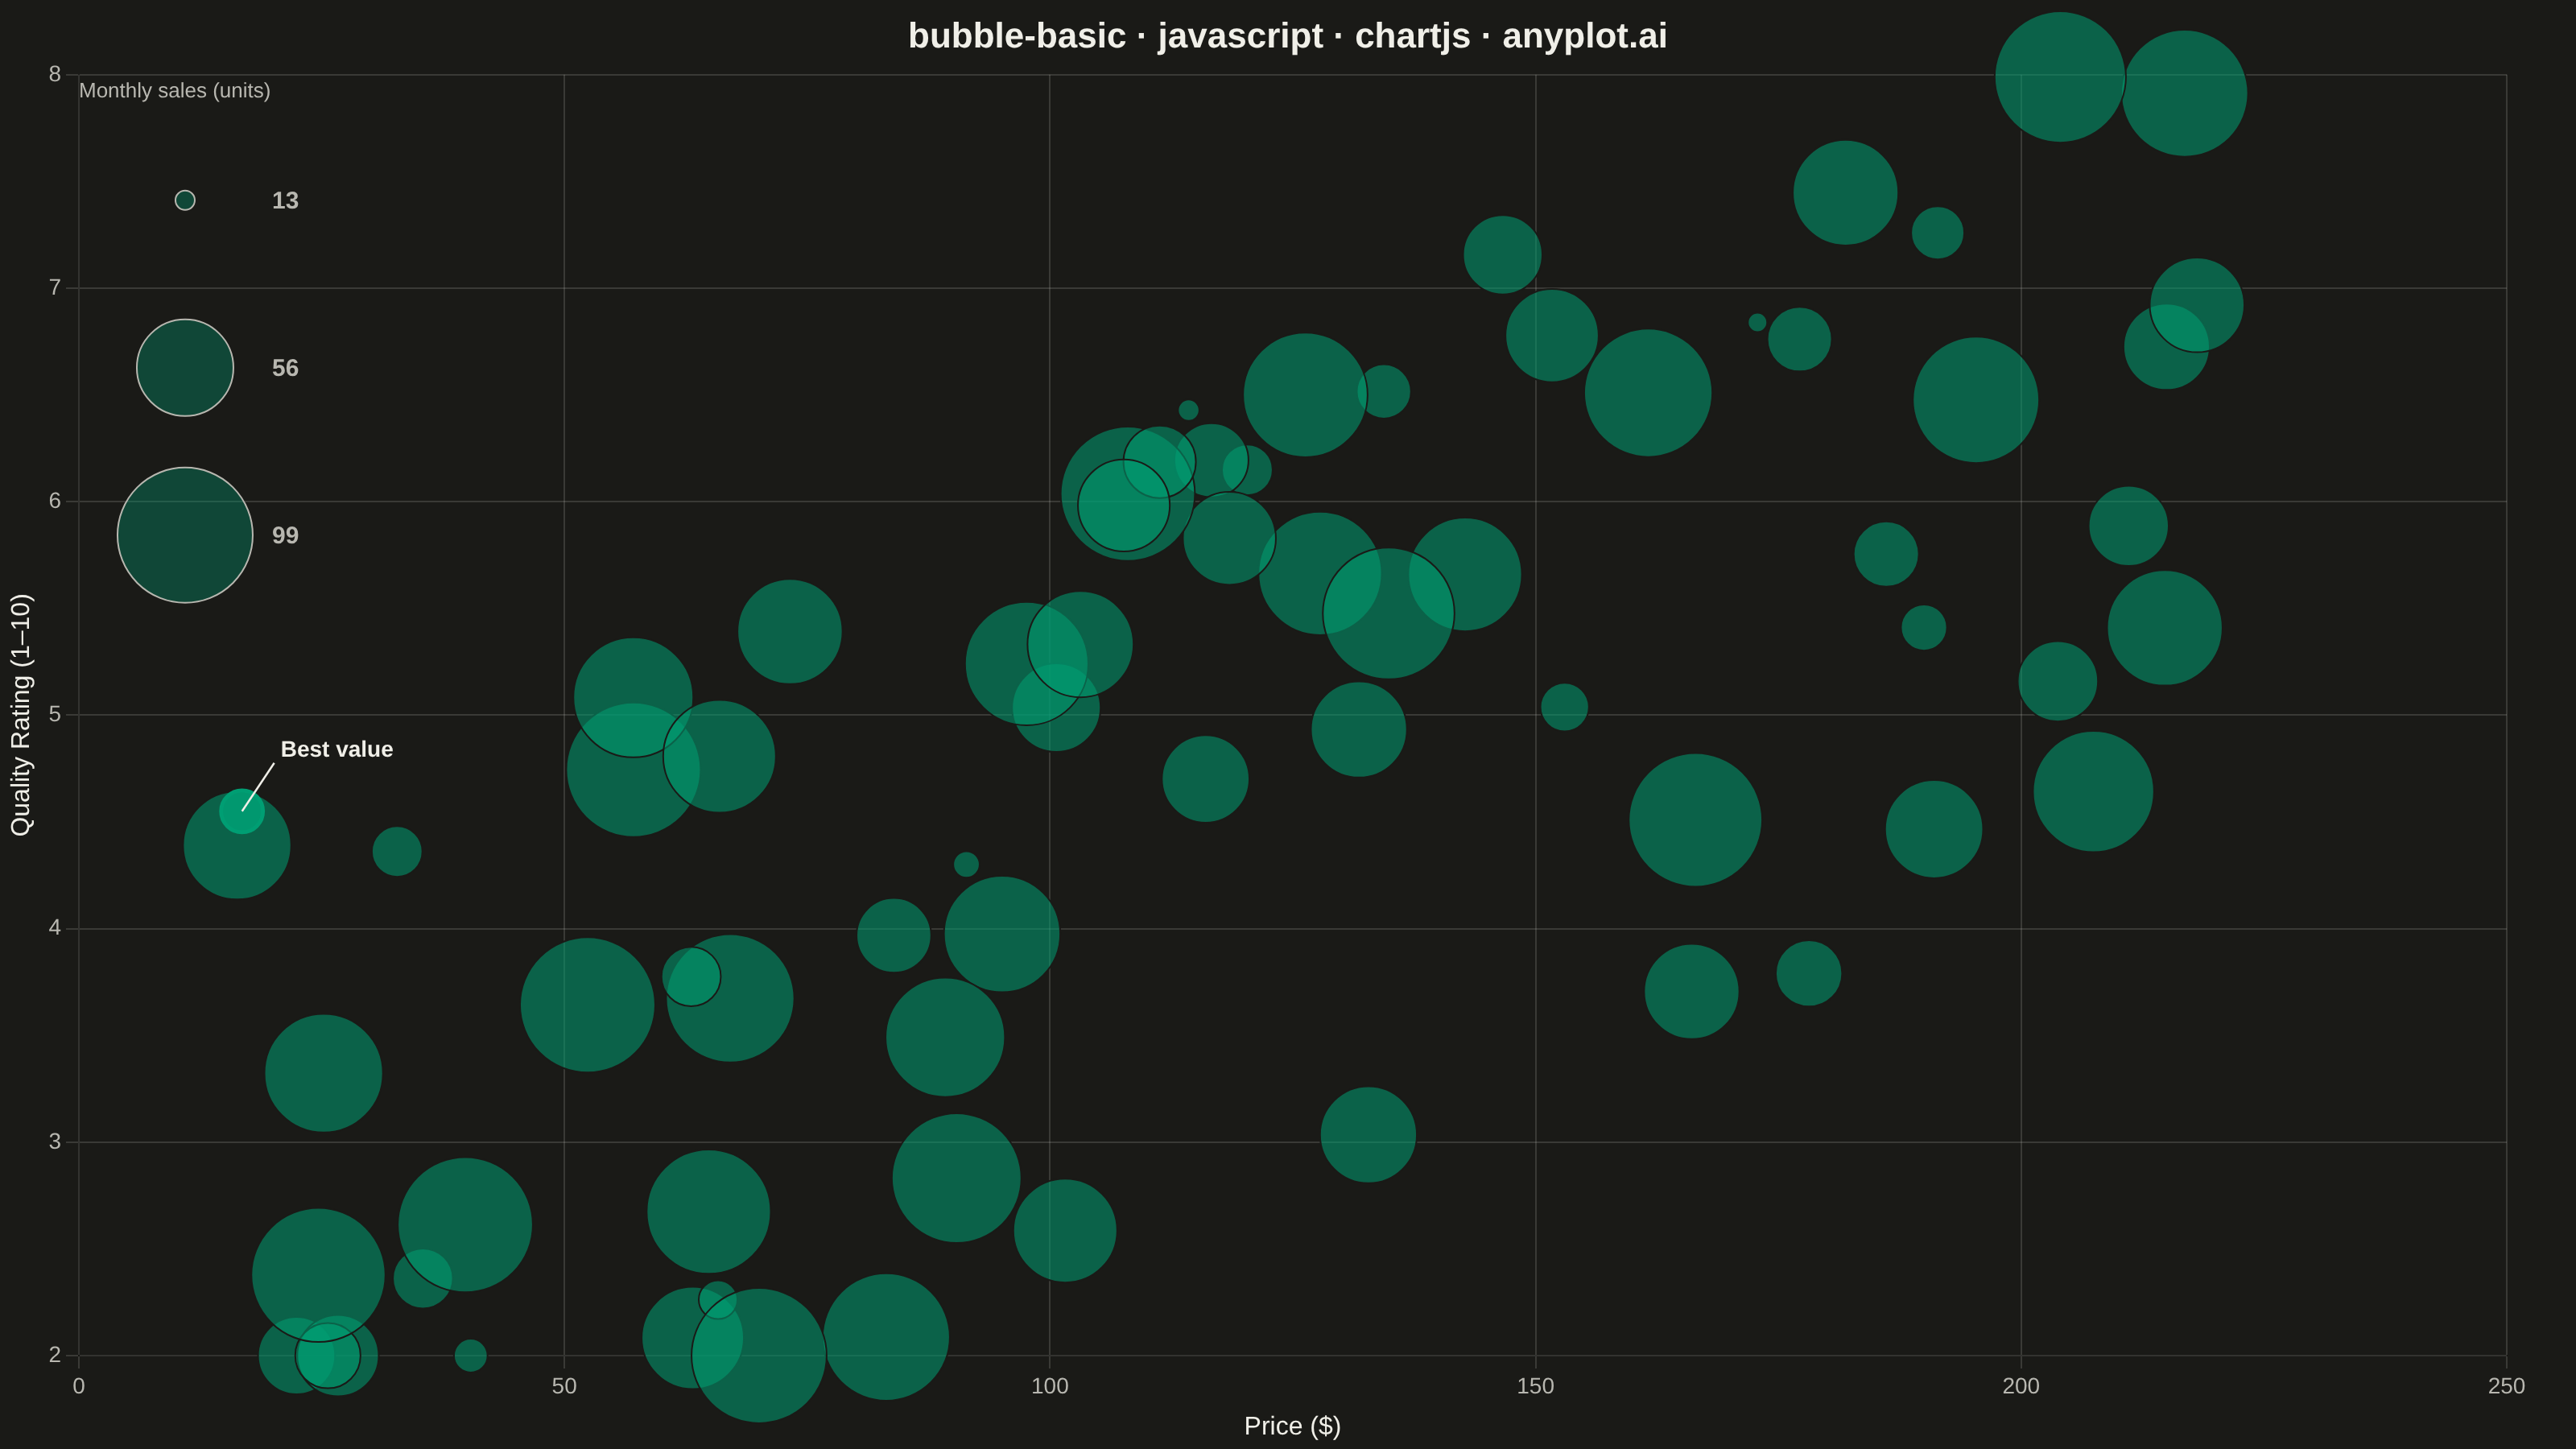
A bubble chart extending scatter plots by adding a third dimension through bubble size. Each point's position shows two variables (x, y) while the bubble size represents a third quantitative variable. This visualization is excellent for understanding relationships between three numerical variables simultaneously, revealing patterns that would be hidden in traditional 2D scatter plots.
Preview render from the Chart.js implementation.