The same plot in 14 other libraries — JavaScript: D3.js, Apache ECharts, Highcharts, MUI X Charts; Python: Altair, Bokeh, lets-plot, Matplotlib, Plotly, plotnine, Pygal, Seaborn; R: ggplot2; Julia: Makie.jl. Compare all 15 side by side: Basic Bubble Chart in Python, R, Julia and JavaScript.
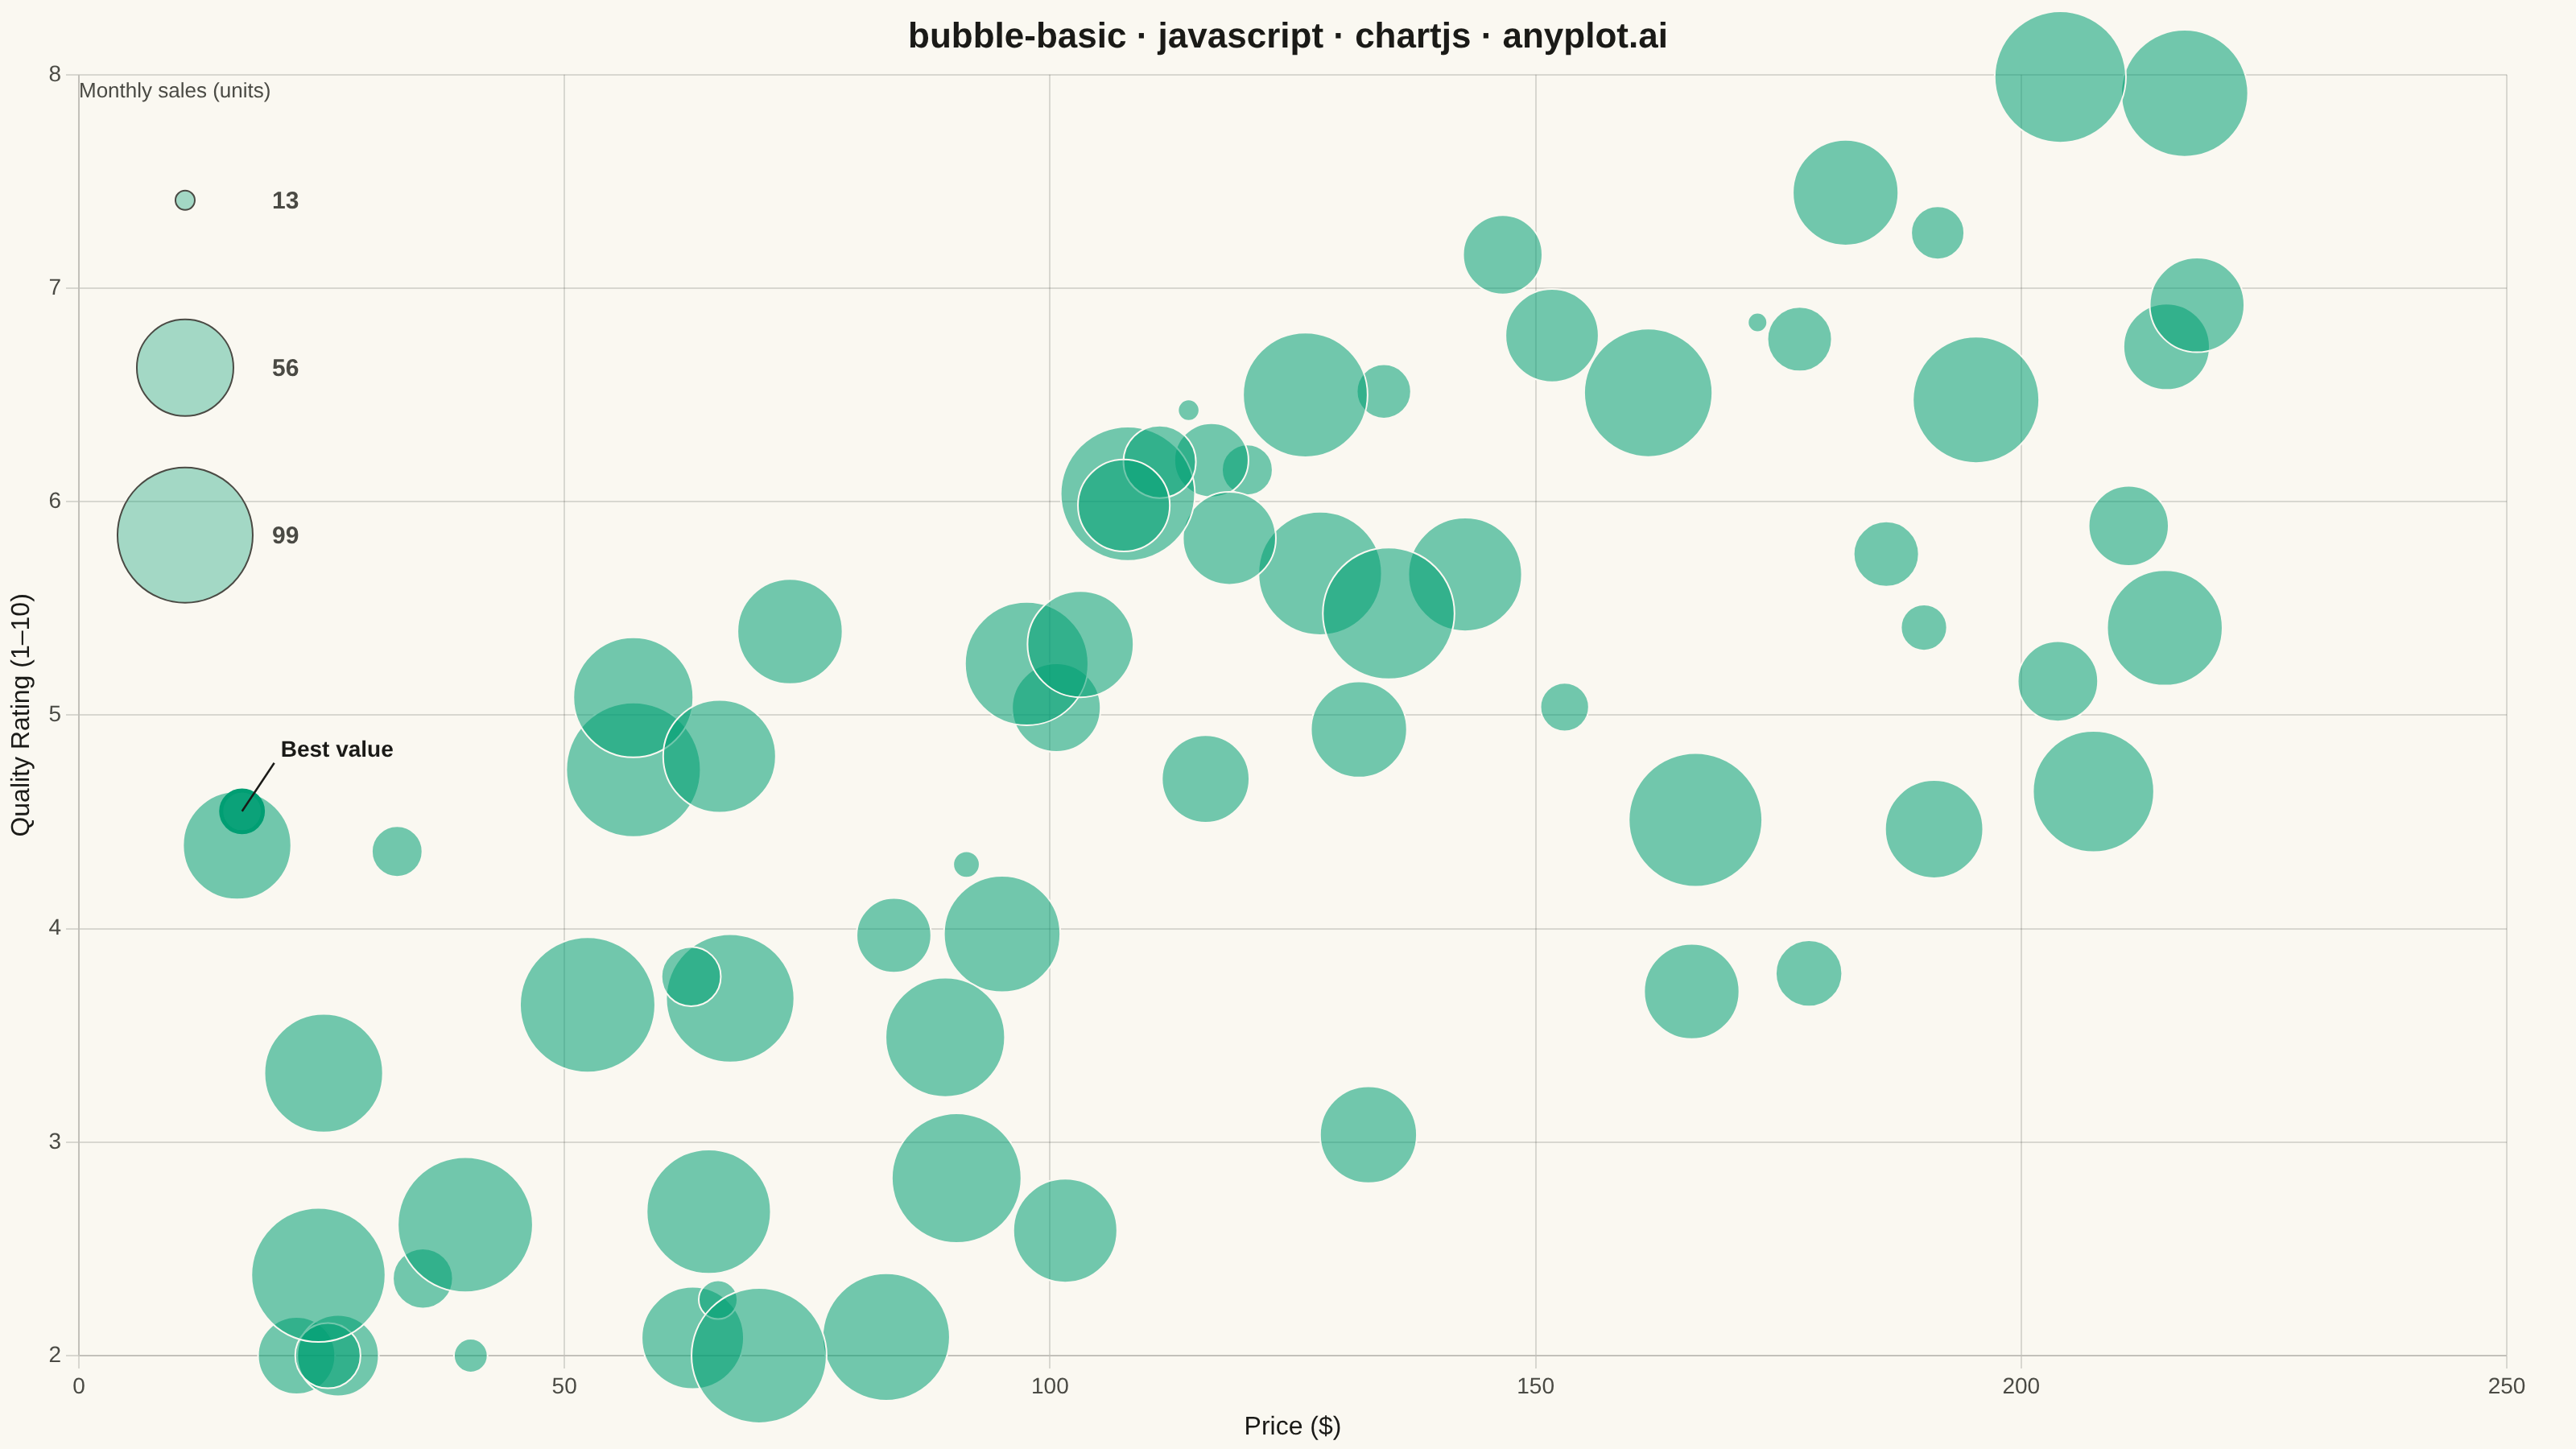
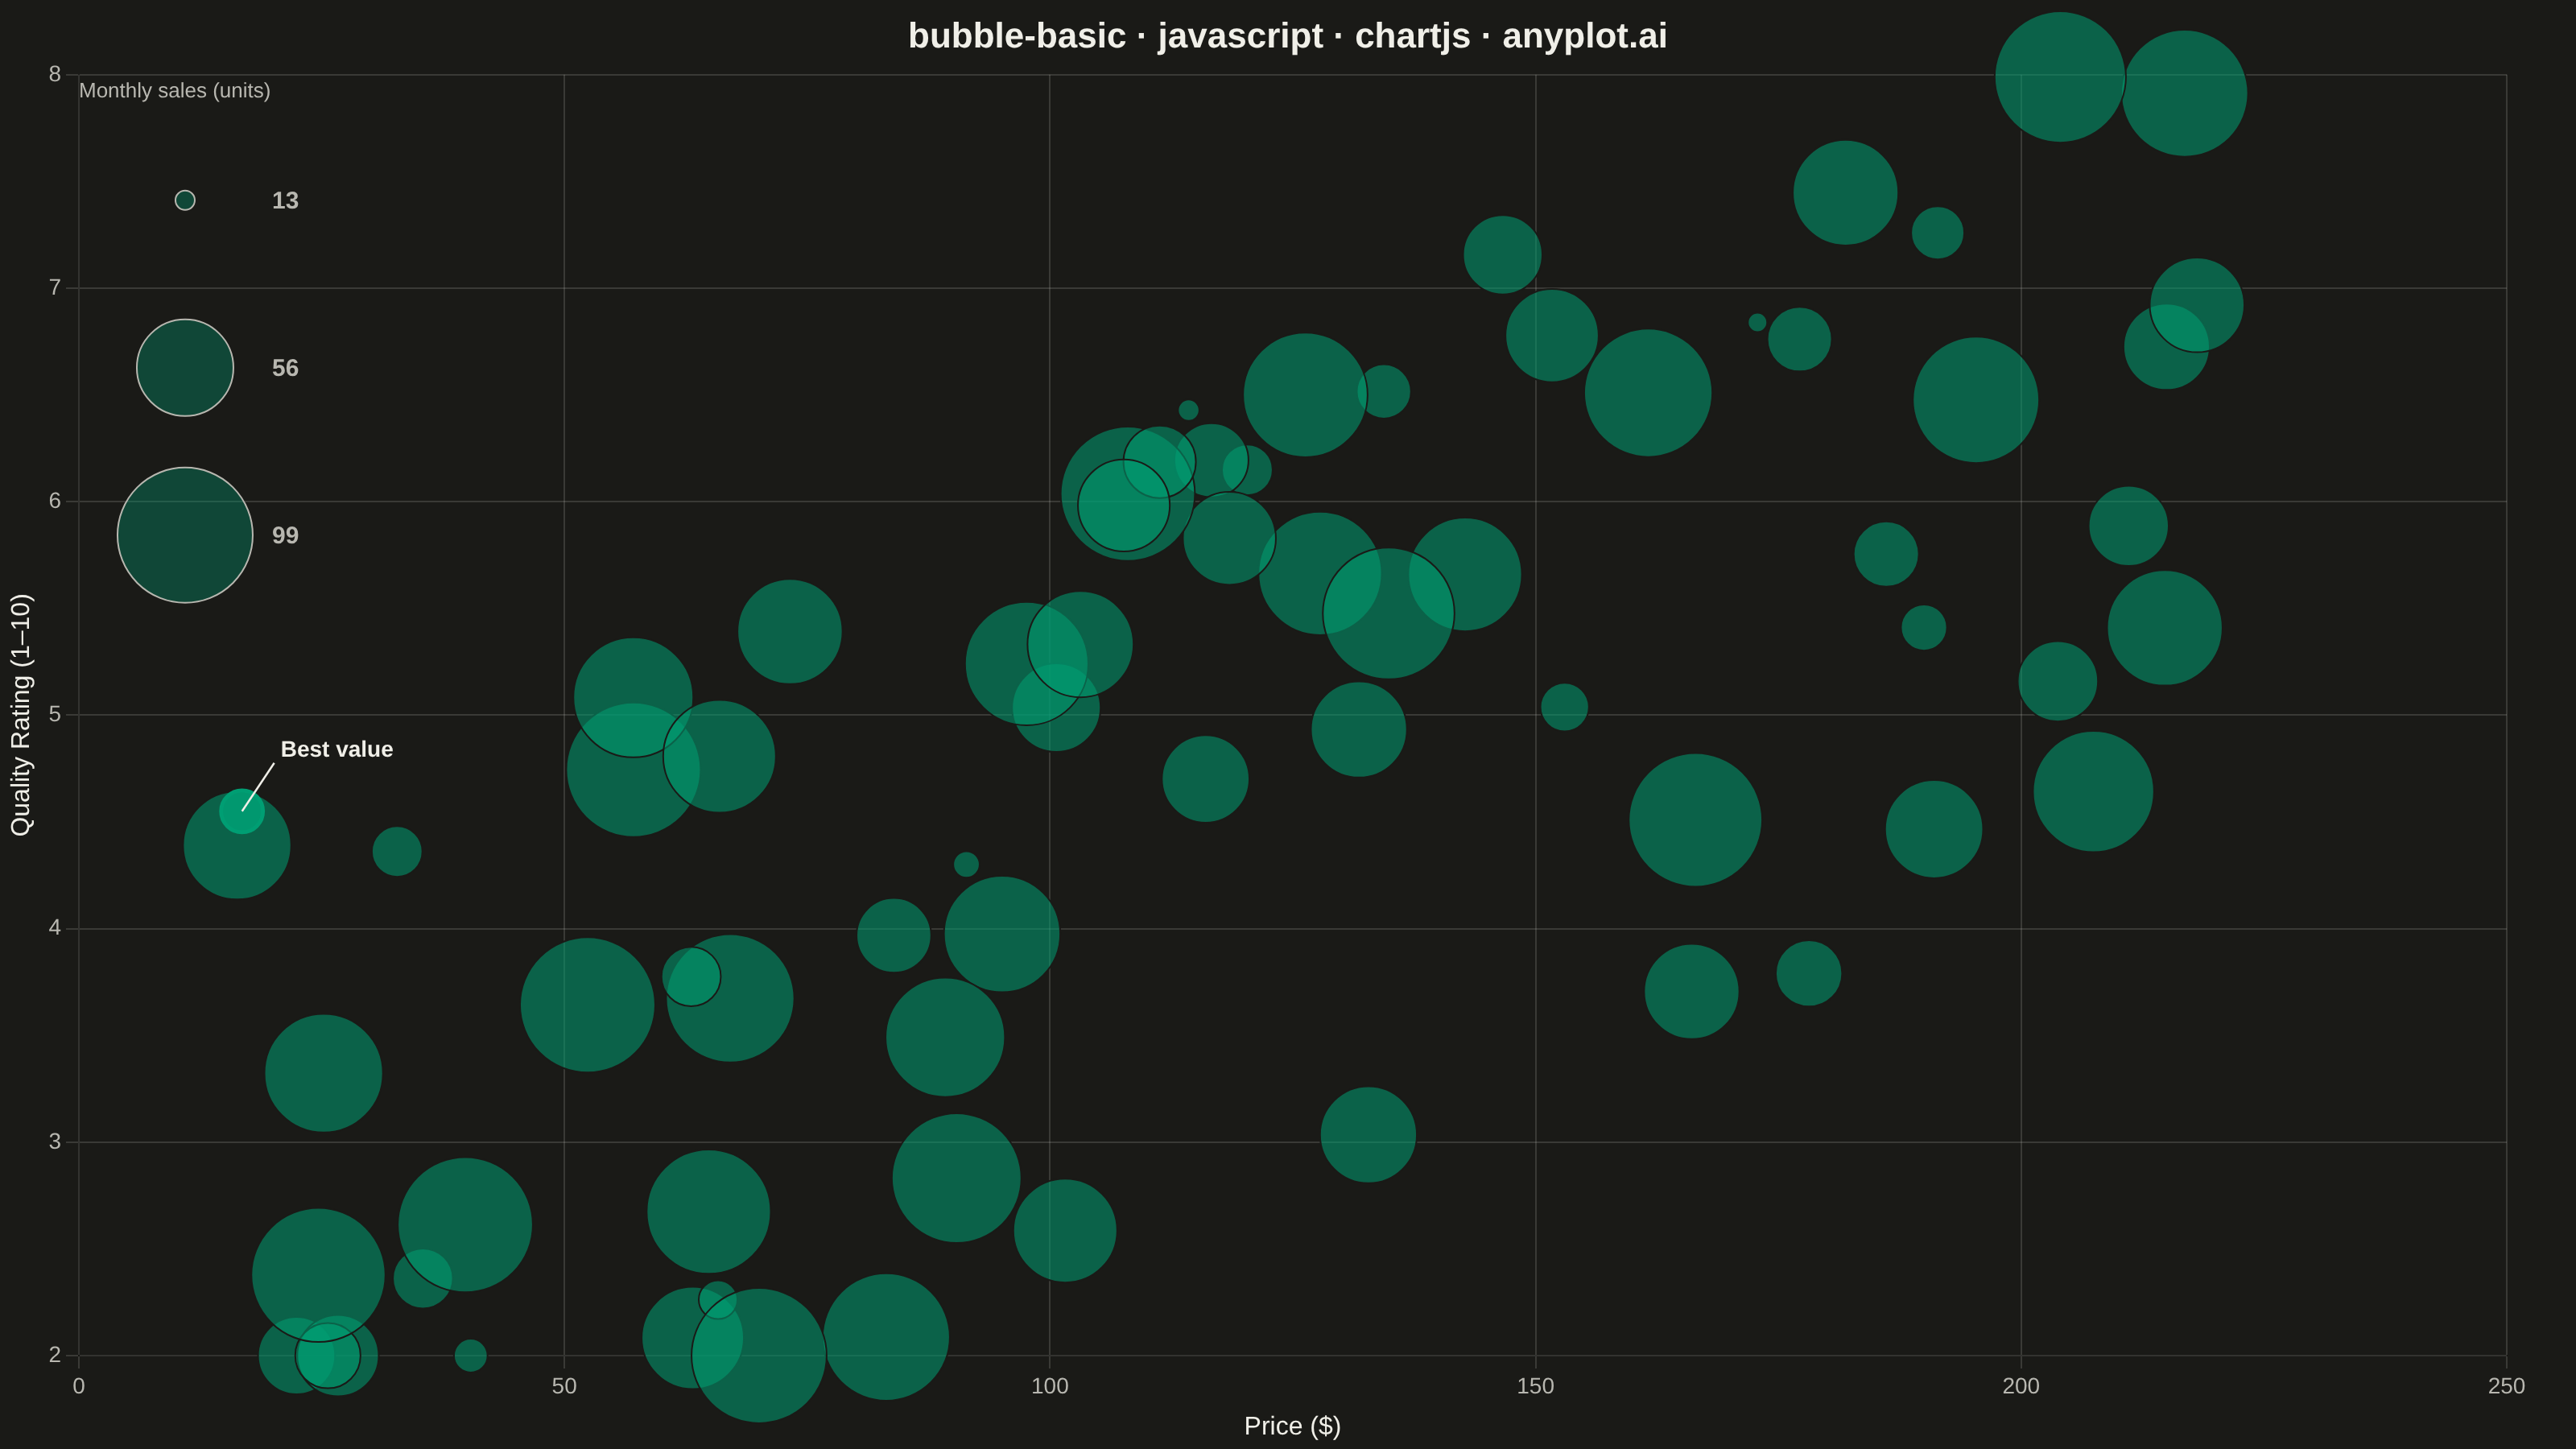
A bubble chart extending scatter plots by adding a third dimension through bubble size. Each point's position shows two variables (x, y) while the bubble size represents a third quantitative variable. This visualization is excellent for understanding relationships between three numerical variables simultaneously, revealing patterns that would be hidden in traditional 2D scatter plots.
// anyplot.ai
// bubble-basic: Basic Bubble Chart
// Library: chartjs 4.4.7 | JavaScript 22.23.3
// Quality: 82/100 | Updated: 2026-09-30
const t = window.ANYPLOT_TOKENS;

// --- Data (in-memory, deterministic LCG) ------------------------------------
function makeLcg(seed) {
  let state = seed >>> 0;
  return function () {
    state = (1103515245 * state + 12345) >>> 0;
    return state / 4294967296;
  };
}
const rand = makeLcg(42);

const N = 70;
const products = [];
for (let i = 0; i < N; i++) {
  const price = 15 + rand() * 205; // $15 - $220
  const noise = (rand() - 0.5) * 4;
  const quality = Math.min(9.8, Math.max(2.0, 2.5 + (price / 220) * 4 + noise));
  const salesVolume = 10 + rand() * 90; // 10-100 units sold per month
  products.push({ price, quality, salesVolume });
}

const sizeValues = products.map((p) => p.salesVolume);
const sizeMin = Math.min(...sizeValues);
const sizeMax = Math.max(...sizeValues);
// Wider radius spread than a smaller range would give, keeping bubbles in the
// dense $80-140 cluster individuated by size alone.
const R_MIN = 6;
const R_MAX = 42;

function bubbleRadius(size) {
  // area-proportional (not radius-proportional) to avoid overstating large values
  const frac = (size - sizeMin) / (sizeMax - sizeMin);
  const area = R_MIN * R_MIN + frac * (R_MAX * R_MAX - R_MIN * R_MIN);
  return Math.sqrt(area);
}

function hexToRgba(hex, alpha) {
  const n = parseInt(hex.slice(1), 16);
  const r = (n >> 16) & 255;
  const g = (n >> 8) & 255;
  const b = n & 255;
  return `rgba(${r}, ${g}, ${b}, ${alpha})`;
}

// Draw largest bubbles first so smaller ones render on top of them instead of
// being buried underneath — meaningfully improves individuation in the dense
// $80-140 cluster where same-size bubbles previously stacked in insert order.
const orderedProducts = [...products].sort(
  (a, b) => b.salesVolume - a.salesVolume,
);
const bubbleData = orderedProducts.map((p) => ({
  x: p.price,
  y: p.quality,
  r: bubbleRadius(p.salesVolume),
}));

// --- Size legend plugin (static key explaining the bubble-area encoding) ---
// Drawn as an elevated card (ELEVATED_BG + thin rule) rather than bare text
// floating over the plot area, matching the style guide's callout-box role.
const legendValues = [sizeMin, (sizeMin + sizeMax) / 2, sizeMax];
const sizeLegend = {
  id: "sizeLegend",
  afterDraw(chart) {
    const { ctx, chartArea } = chart;
    // Offset clear of the y-axis tick-label gutter so the card never
    // overlaps the "10"/"9" labels now that the axis is pinned to 1-10.
    const left = chartArea.left + 56;
    const cx = left + R_MAX + 24;
    const spacing = 2 * R_MAX + 20;
    const panelX = left - 16;
    const panelY = chartArea.top - 4;
    const panelW = 2 * (R_MAX + 12) + 90;
    const panelH = 54 + 2 * R_MAX + (legendValues.length - 1) * spacing;
    ctx.save();
    ctx.fillStyle = t.elevatedBg;
    ctx.beginPath();
    ctx.roundRect(panelX, panelY, panelW, panelH, 10);
    ctx.fill();
    ctx.strokeStyle = t.grid;
    ctx.lineWidth = 1;
    ctx.stroke();
    // Bold, higher-contrast header outranks the regular-weight value labels —
    // a clearer typographic hierarchy than a flat single-weight legend.
    ctx.font = "bold 16px sans-serif";
    ctx.fillStyle = t.ink;
    ctx.textAlign = "left";
    ctx.fillText("Monthly sales (units)", left, chartArea.top + 16);
    legendValues.forEach((val, i) => {
      const r = bubbleRadius(val);
      const cy = chartArea.top + 36 + R_MAX + i * spacing;
      ctx.beginPath();
      ctx.arc(cx, cy, r, 0, Math.PI * 2);
      ctx.fillStyle = hexToRgba(t.palette[0], 0.35);
      ctx.fill();
      ctx.lineWidth = 1;
      ctx.strokeStyle = t.inkSoft;
      ctx.stroke();
      ctx.font = "16px sans-serif";
      ctx.fillStyle = t.inkSoft;
      ctx.fillText(`${Math.round(val)}`, cx + R_MAX + 12, cy + 5);
    });
    ctx.restore();
  },
};

// --- Mount -------------------------------------------------------------
const canvas = document.createElement("canvas");
document.getElementById("container").appendChild(canvas);

// --- Chart ---------------------------------------------------------------
new Chart(canvas, {
  type: "bubble",
  data: {
    datasets: [
      {
        label: "Products",
        data: bubbleData,
        // A single ink stroke (not page-bg-matched) so overlapping bubbles in
        // the dense clusters stay separable from each other, not only from
        // the page; alpha keeps every bubble visible through overlap.
        backgroundColor: hexToRgba(t.palette[0], 0.55),
        borderColor: hexToRgba(t.ink, 0.65),
        borderWidth: 1.5,
      },
    ],
  },
  options: {
    responsive: true,
    maintainAspectRatio: false,
    animation: false,
    plugins: {
      title: {
        display: true,
        text: "bubble-basic · javascript · chartjs · anyplot.ai",
        color: t.ink,
        font: { size: 22 },
      },
      legend: { display: false },
      tooltip: {
        callbacks: {
          label: (ctx) => {
            const p = orderedProducts[ctx.dataIndex];
            return `Price $${p.price.toFixed(0)} · Quality ${p.quality.toFixed(1)} · Sales ${Math.round(p.salesVolume)} units`;
          },
        },
      },
    },
    scales: {
      x: {
        ticks: {
          color: t.inkSoft,
          font: { size: 14 },
          callback: (val) => `$${val}`,
        },
        grid: { color: t.grid },
        title: {
          display: true,
          text: "Price ($)",
          color: t.ink,
          font: { size: 16 },
        },
      },
      y: {
        min: 1,
        max: 10,
        ticks: { color: t.inkSoft, font: { size: 14 } },
        grid: { color: t.grid },
        title: {
          display: true,
          text: "Quality Rating (1–10)",
          color: t.ink,
          font: { size: 16 },
        },
      },
    },
  },
  plugins: [sizeLegend],
});
Runnable source as JSON, for any HTTP client: https://api.anyplot.ai/specs/bubble-basic/chartjs/code. Any spec id and library id listed in llms-full.txt fit the same URL shape; every URL below is complete and callable.
{
  "spec_id": "bubble-basic",
  "language": "javascript",
  "library": "chartjs",
  "page": "https://anyplot.ai/bubble-basic/javascript/chartjs",
  "hub": "https://anyplot.ai/bubble-basic",
  "code_json": "https://api.anyplot.ai/specs/bubble-basic/chartjs/code",
  "spec_json": "https://api.anyplot.ai/specs/bubble-basic",
  "render_light_png": "https://storage.googleapis.com/anyplot-images/plots/bubble-basic/javascript/chartjs/plot-light.png",
  "render_dark_png": "https://storage.googleapis.com/anyplot-images/plots/bubble-basic/javascript/chartjs/plot-dark.png",
  "interactive_light_html": "https://storage.googleapis.com/anyplot-images/plots/bubble-basic/javascript/chartjs/plot-light.html",
  "interactive_dark_html": "https://storage.googleapis.com/anyplot-images/plots/bubble-basic/javascript/chartjs/plot-dark.html",
  "quality_score": 82.0,
  "license": "MIT",
  "guide": "https://anyplot.ai/llms.txt"
}
Part of Basic Bubble Chart on anyplot.ai.