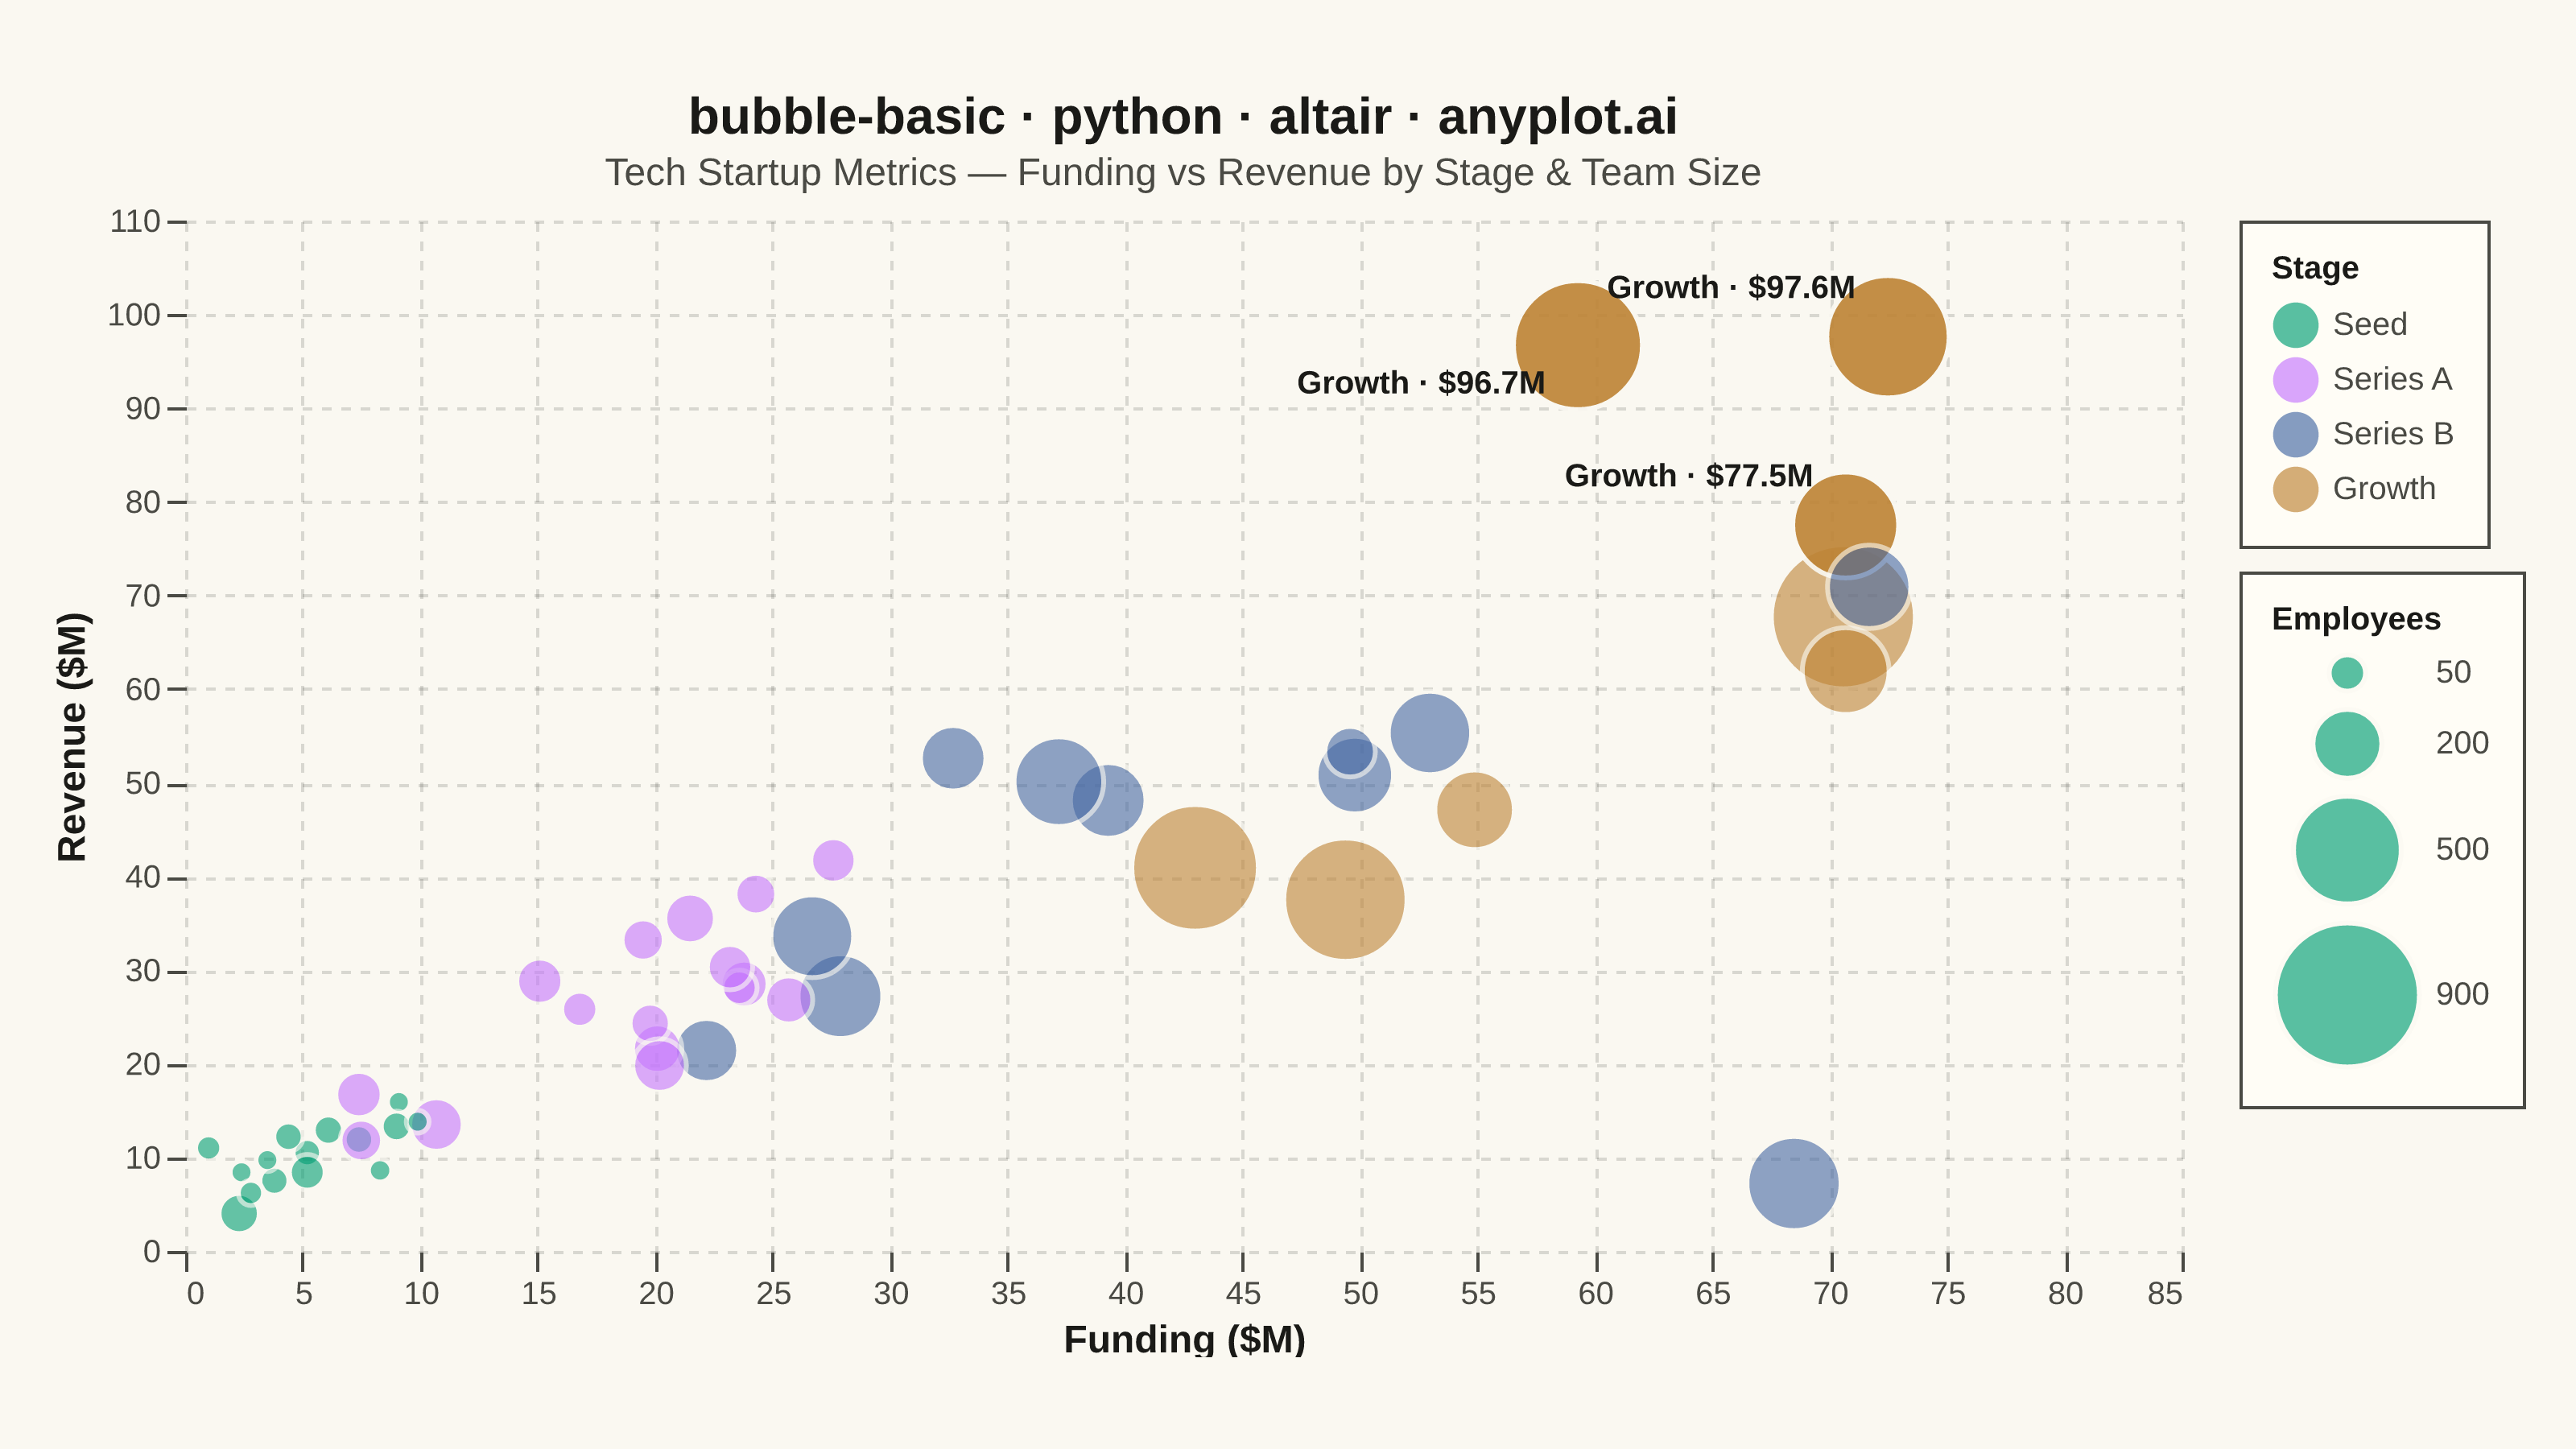
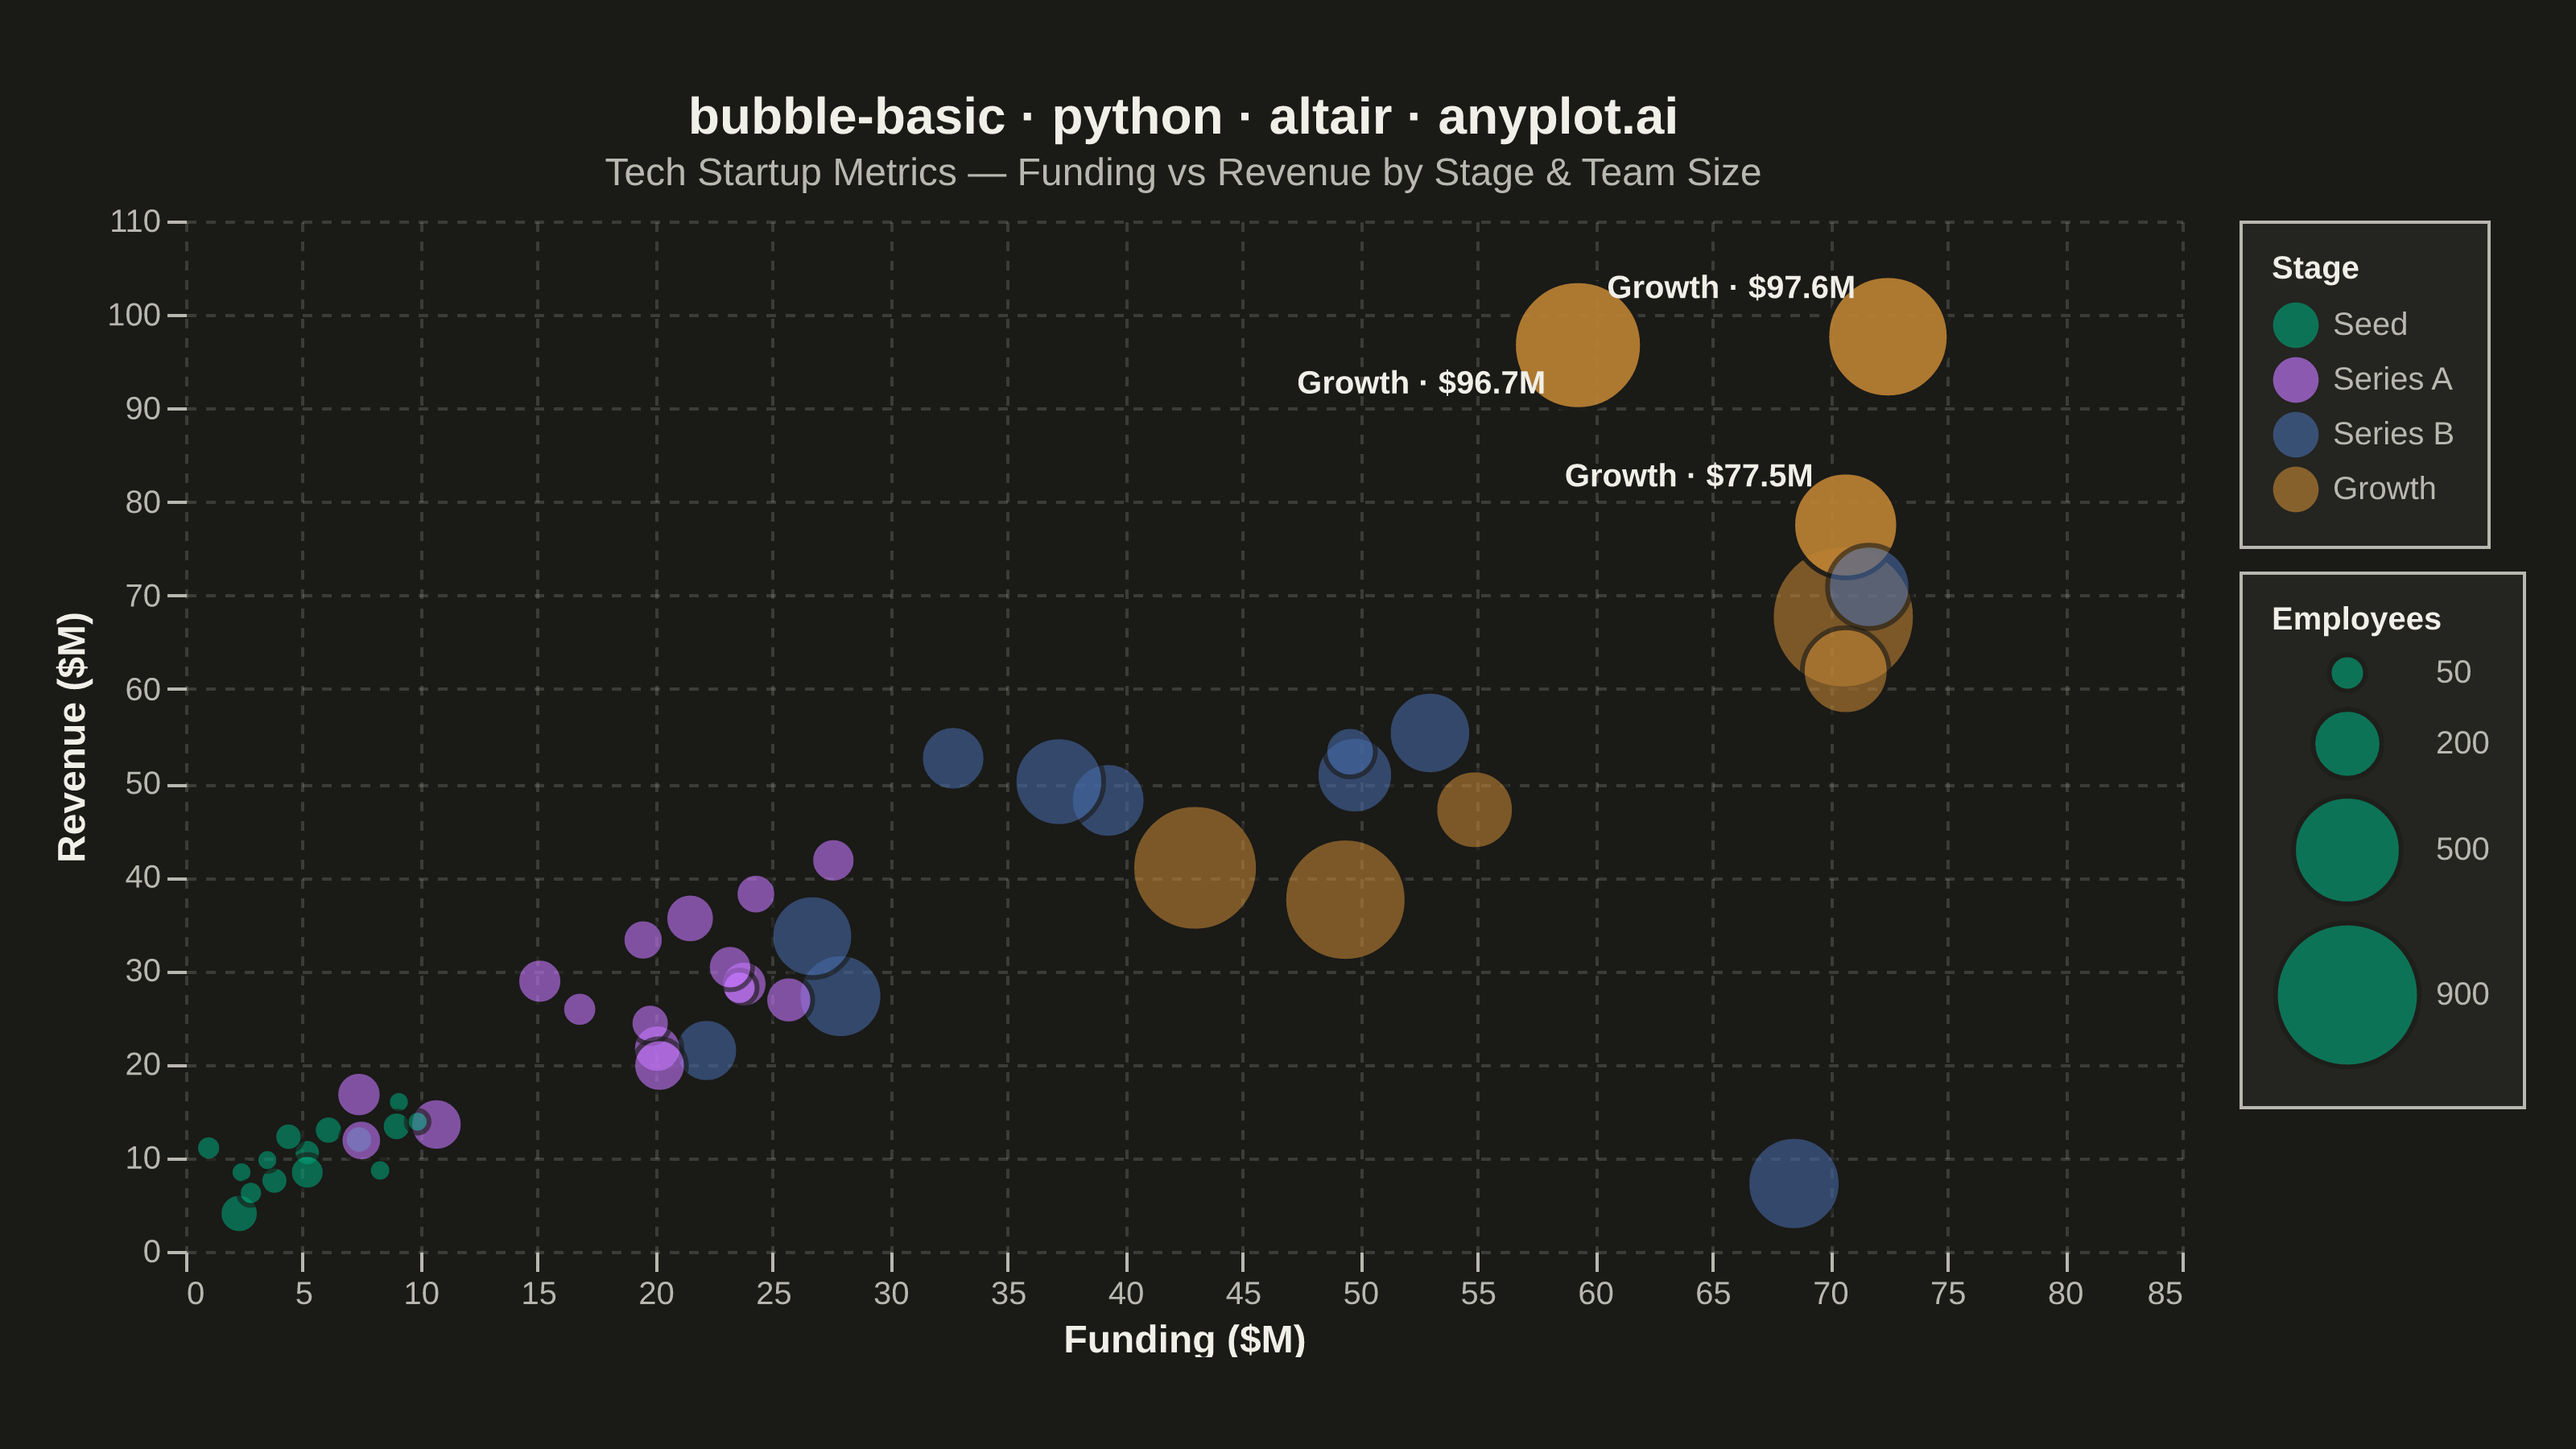
A bubble chart extending scatter plots by adding a third dimension through bubble size. Each point's position shows two variables (x, y) while the bubble size represents a third quantitative variable. This visualization is excellent for understanding relationships between three numerical variables simultaneously, revealing patterns that would be hidden in traditional 2D scatter plots.
""" anyplot.ai
bubble-basic: Basic Bubble Chart
Library: altair 6.1.0 | Python 3.13.13
Quality: 87/100 | Created: 2026-05-29
"""

import os

import altair as alt
import numpy as np
import pandas as pd
from PIL import Image


# Theme tokens
THEME = os.getenv("ANYPLOT_THEME", "light")
PAGE_BG = "#FAF8F1" if THEME == "light" else "#1A1A17"
ELEVATED_BG = "#FFFDF6" if THEME == "light" else "#242420"
INK = "#1A1A17" if THEME == "light" else "#F0EFE8"
INK_SOFT = "#4A4A44" if THEME == "light" else "#B8B7B0"

ANYPLOT_PALETTE = ["#009E73", "#C475FD", "#4467A3", "#BD8233", "#AE3030", "#2ABCCD", "#954477", "#99B314"]
stage_colors = ANYPLOT_PALETTE[:4]

# Data — tech startup metrics: funding vs revenue, sized by employees, colored by stage
np.random.seed(42)
n = 49

stages = np.random.choice(["Seed", "Series A", "Series B", "Growth"], size=n, p=[0.25, 0.30, 0.25, 0.20])

stage_funding = {"Seed": (6, 4), "Series A": (18, 7), "Series B": (38, 10), "Growth": (60, 12)}
funding_m = np.array([np.random.normal(*stage_funding[s]) for s in stages])
funding_m = np.clip(funding_m, 1, 80)

revenue_m = funding_m * np.random.uniform(0.7, 1.5, size=n) + np.random.normal(5, 3, size=n)
revenue_m = np.clip(revenue_m, 2, 100)

stage_emp = {"Seed": (25, 10), "Series A": (80, 35), "Series B": (250, 90), "Growth": (550, 150)}
employees = np.array([int(np.clip(np.random.normal(*stage_emp[s]), 15, 900)) for s in stages])

df = pd.DataFrame(
    {
        "Funding ($M)": np.round(funding_m, 1),
        "Revenue ($M)": np.round(revenue_m, 1),
        "Employees": employees,
        "Stage": pd.Categorical(stages, categories=["Seed", "Series A", "Series B", "Growth"], ordered=True),
    }
)

# Add outlier: high-funded low-revenue startup to demonstrate full chart dynamics
outlier = pd.DataFrame(
    {
        "Funding ($M)": [68.5],
        "Revenue ($M)": [7.2],
        "Employees": [380],
        "Stage": pd.Categorical(["Series B"], categories=["Seed", "Series A", "Series B", "Growth"], ordered=True),
    }
)
df = pd.concat([df, outlier], ignore_index=True)

# Flag top-3 companies by revenue for storytelling annotations
top3_idx = df["Revenue ($M)"].nlargest(3).index.tolist()
df["label"] = ""
for i in top3_idx:
    df.loc[i, "label"] = f"{df.loc[i, 'Stage']} · ${df.loc[i, 'Revenue ($M)']}M"

title = "bubble-basic · python · altair · anyplot.ai"

# Plot — bubble layer
bubbles = (
    alt.Chart(df)
    .mark_circle(stroke=PAGE_BG, strokeWidth=1.5)
    .encode(
        x=alt.X(
            "Funding ($M):Q", scale=alt.Scale(domain=[0, 85], nice=False), axis=alt.Axis(domainWidth=0, tickSize=6)
        ),
        y=alt.Y(
            "Revenue ($M):Q", scale=alt.Scale(domain=[0, 110], nice=False), axis=alt.Axis(domainWidth=0, tickSize=6)
        ),
        size=alt.Size(
            "Employees:Q",
            scale=alt.Scale(range=[50, 2000], domain=[15, 900]),
            legend=alt.Legend(
                title="Employees",
                titleFontSize=10,
                labelFontSize=10,
                values=[50, 200, 500, 900],
                symbolFillColor=ANYPLOT_PALETTE[0],
                symbolStrokeColor=PAGE_BG,
                symbolOpacity=0.65,
                direction="vertical",
            ),
        ),
        color=alt.Color(
            "Stage:N",
            scale=alt.Scale(domain=["Seed", "Series A", "Series B", "Growth"], range=stage_colors),
            legend=alt.Legend(
                title="Stage",
                titleFontSize=10,
                labelFontSize=10,
                symbolType="circle",
                symbolSize=200,
                symbolStrokeWidth=0,
                symbolOpacity=0.65,
            ),
        ),
        opacity=alt.condition(alt.datum.label != "", alt.value(0.9), alt.value(0.6)),
        tooltip=["Stage:N", "Funding ($M):Q", "Revenue ($M):Q", "Employees:Q"],
    )
)

# Annotation layers — sort by revenue descending and alternate dy to prevent collision
_labeled = df[df["label"] != ""].sort_values("Revenue ($M)", ascending=False).reset_index(drop=True)
_dy_offsets = [-15, 12, -15]
_annotation_layers = [
    alt.Chart(_labeled.iloc[[k]])
    .mark_text(align="right", dx=-10, dy=_dy_offsets[k], fontSize=10, fontWeight="bold")
    .encode(x="Funding ($M):Q", y="Revenue ($M):Q", text="label:N", color=alt.value(INK))
    for k in range(len(_labeled))
]
annotations = alt.layer(*_annotation_layers)

chart = (
    (bubbles + annotations)
    .properties(
        width=620,
        height=320,
        background=PAGE_BG,
        padding={"left": 0, "right": 0, "top": 0, "bottom": 0},
        title=alt.Title(
            title,
            fontSize=16,
            fontWeight="bold",
            color=INK,
            anchor="middle",
            subtitle="Tech Startup Metrics — Funding vs Revenue by Stage & Team Size",
            subtitleFontSize=12,
            subtitleColor=INK_SOFT,
            subtitlePadding=4,
        ),
    )
    .configure_view(fill=PAGE_BG, strokeWidth=0, continuousWidth=620, continuousHeight=320)
    .configure_axis(
        domainColor=INK_SOFT,
        tickColor=INK_SOFT,
        gridColor=INK,
        gridOpacity=0.15,
        gridDash=[3, 3],
        labelColor=INK_SOFT,
        titleColor=INK,
        labelFontSize=10,
        titleFontSize=12,
    )
    .configure_legend(
        fillColor=ELEVATED_BG, strokeColor=INK_SOFT, labelColor=INK_SOFT, titleColor=INK, orient="right", padding=10
    )
)

# Save PNG
chart.save(f"plot-{THEME}.png", scale_factor=4.0)

# PAD to exact 3200×1800 (do not crop — cropping clips title/axis labels)
TW, TH = 3200, 1800
_img = Image.open(f"plot-{THEME}.png").convert("RGB")
_w, _h = _img.size
if _w > TW or _h > TH:
    raise SystemExit(
        f"altair vl-convert produced {_w}×{_h}, exceeds target {TW}×{TH}. "
        f"Shrink chart .properties(width=, height=) values and re-render."
    )
if _w < TW or _h < TH:
    _canvas = Image.new("RGB", (TW, TH), PAGE_BG)
    _canvas.paste(_img, ((TW - _w) // 2, (TH - _h) // 2))
    _canvas.save(f"plot-{THEME}.png")

# Save HTML
chart.save(f"plot-{THEME}.html")
Runnable source as JSON, for any HTTP client: https://api.anyplot.ai/specs/bubble-basic/altair/code. Any spec id and library id listed in llms-full.txt fit the same URL shape; every URL below is complete and callable.
{
  "spec_id": "bubble-basic",
  "language": "python",
  "library": "altair",
  "page": "https://anyplot.ai/bubble-basic/python/altair",
  "hub": "https://anyplot.ai/bubble-basic",
  "code_json": "https://api.anyplot.ai/specs/bubble-basic/altair/code",
  "spec_json": "https://api.anyplot.ai/specs/bubble-basic",
  "render_light_png": "https://storage.googleapis.com/anyplot-images/plots/bubble-basic/python/altair/plot-light.png",
  "render_dark_png": "https://storage.googleapis.com/anyplot-images/plots/bubble-basic/python/altair/plot-dark.png",
  "interactive_light_html": "https://storage.googleapis.com/anyplot-images/plots/bubble-basic/python/altair/plot-light.html",
  "interactive_dark_html": "https://storage.googleapis.com/anyplot-images/plots/bubble-basic/python/altair/plot-dark.html",
  "quality_score": 87.0,
  "license": "MIT",
  "guide": "https://anyplot.ai/llms.txt"
}
Part of Basic Bubble Chart on anyplot.ai.