The same plot in 14 other libraries — JavaScript: Chart.js, Apache ECharts, Highcharts, MUI X Charts; Python: Altair, Bokeh, lets-plot, Matplotlib, Plotly, plotnine, Pygal, Seaborn; R: ggplot2; Julia: Makie.jl. Compare all 15 side by side: Basic Bubble Chart in Python, R, Julia and JavaScript.
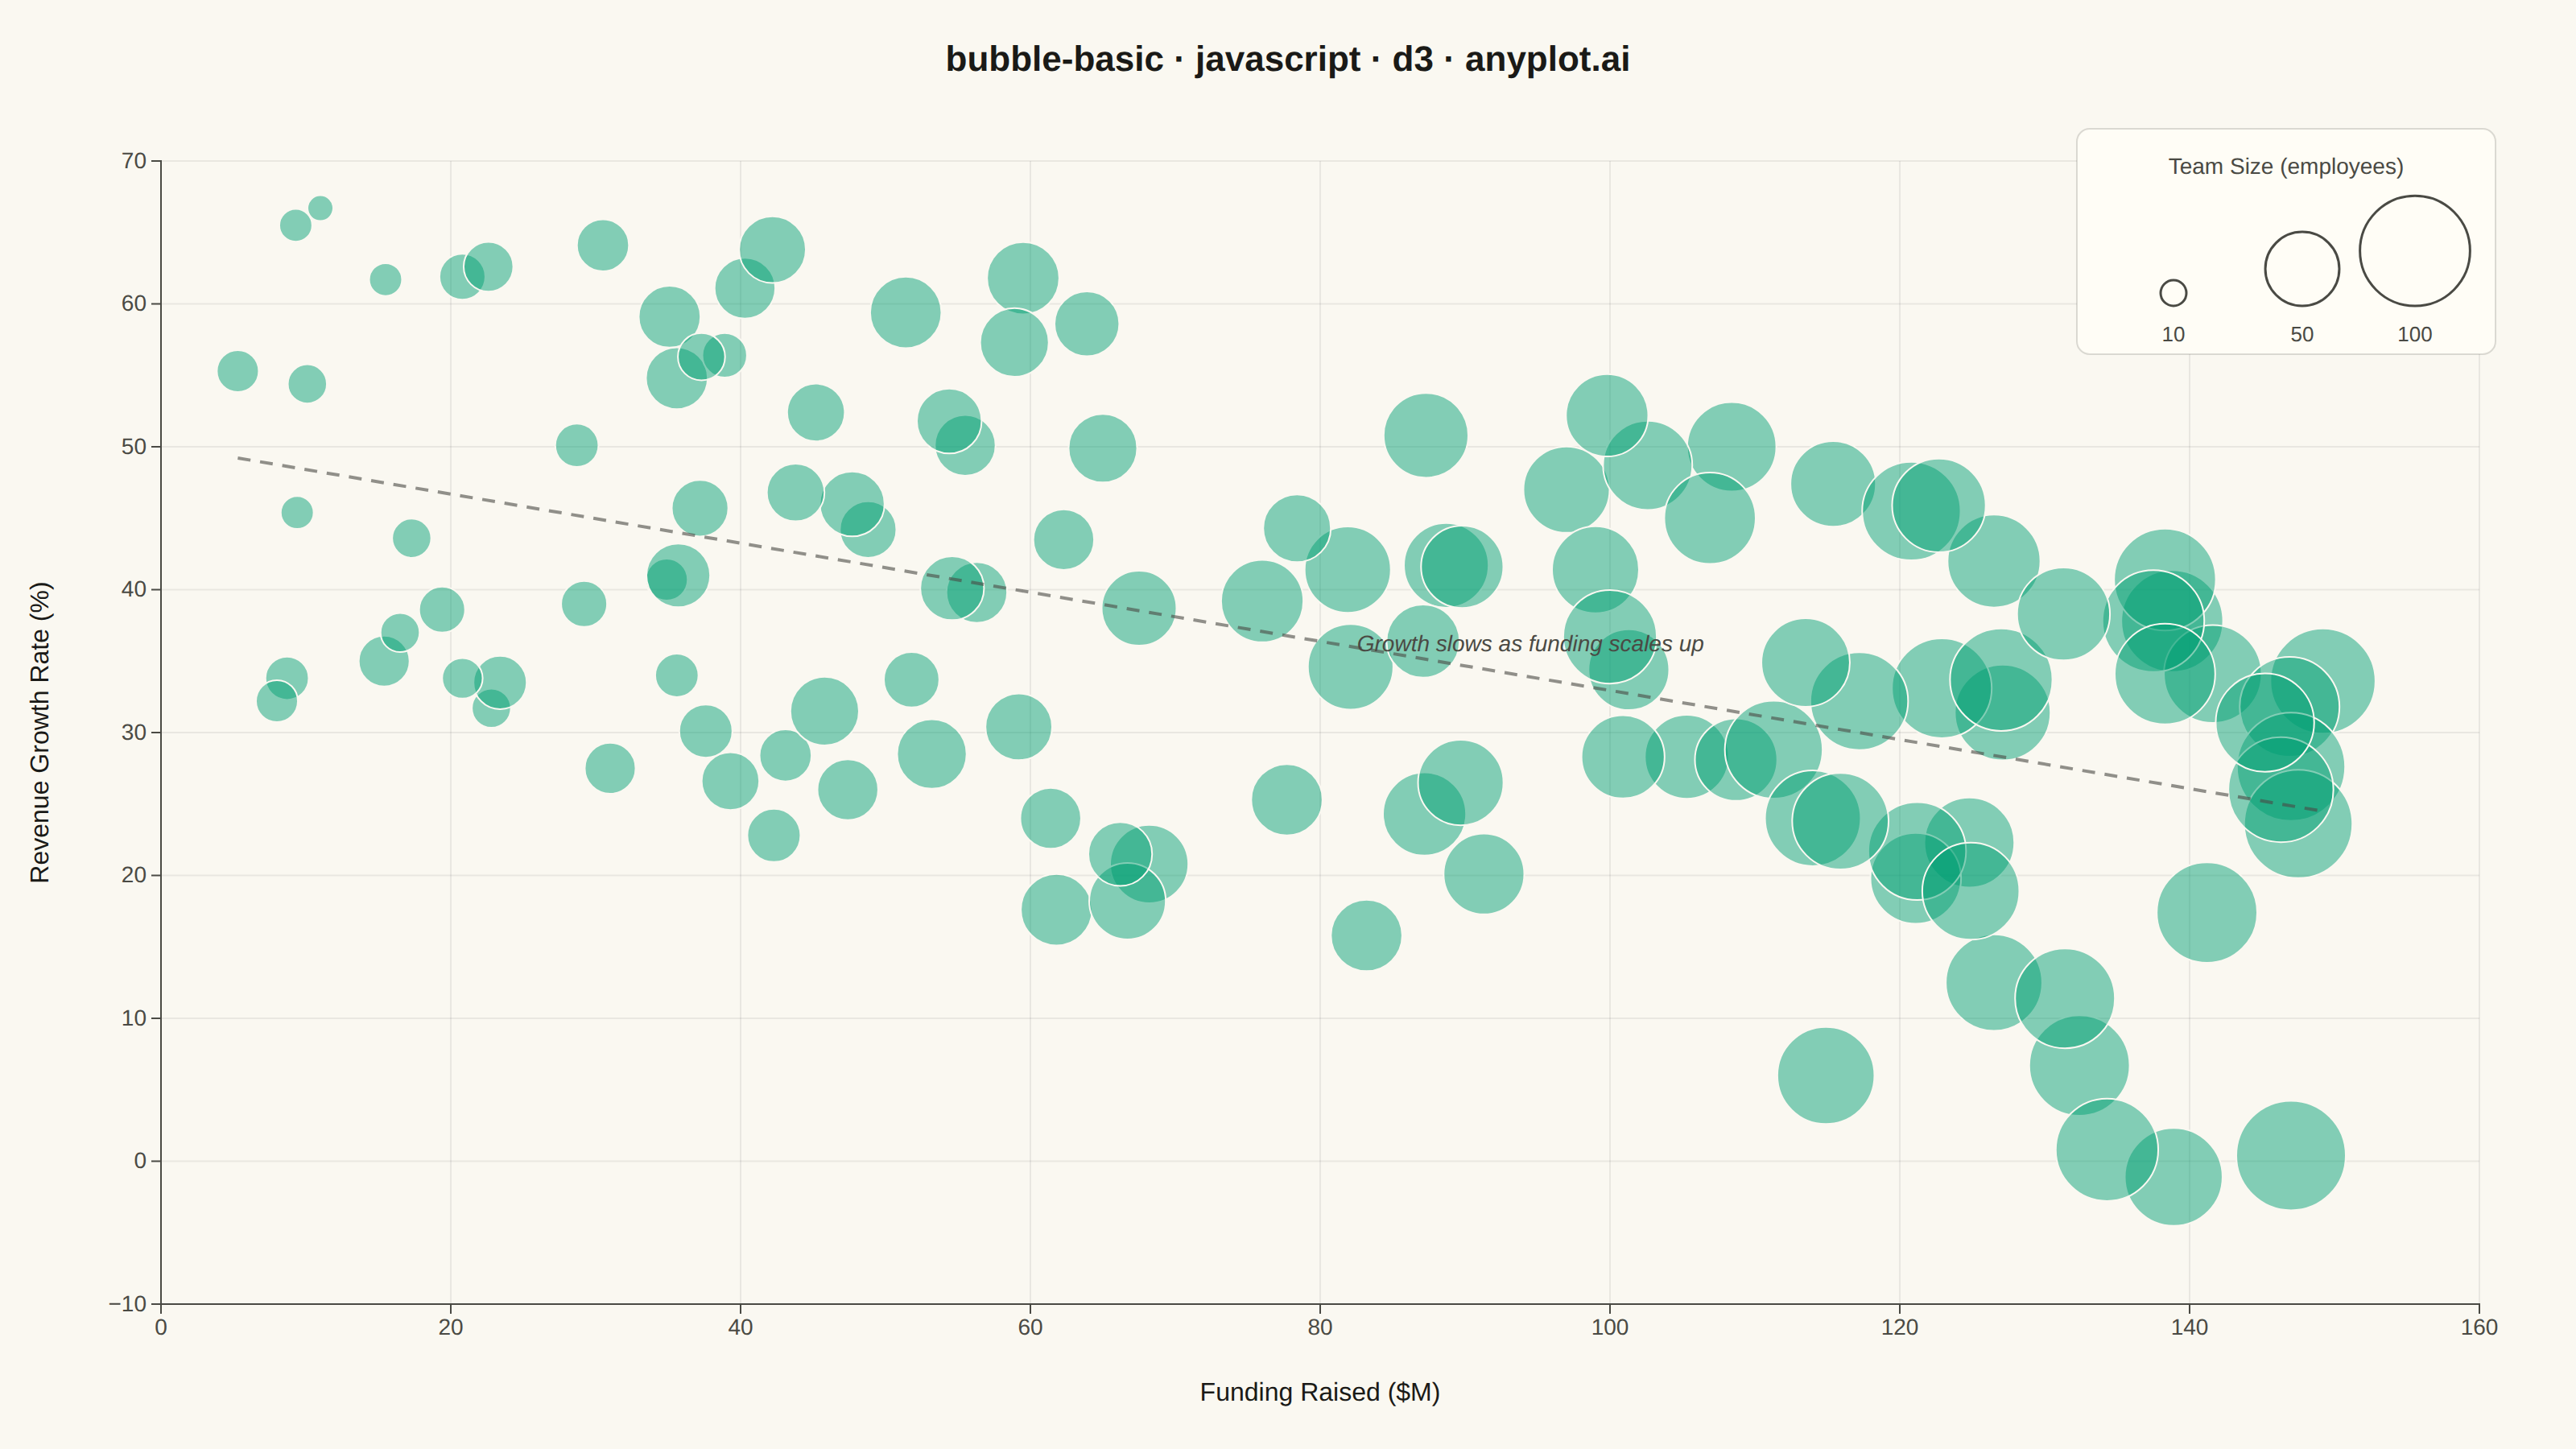
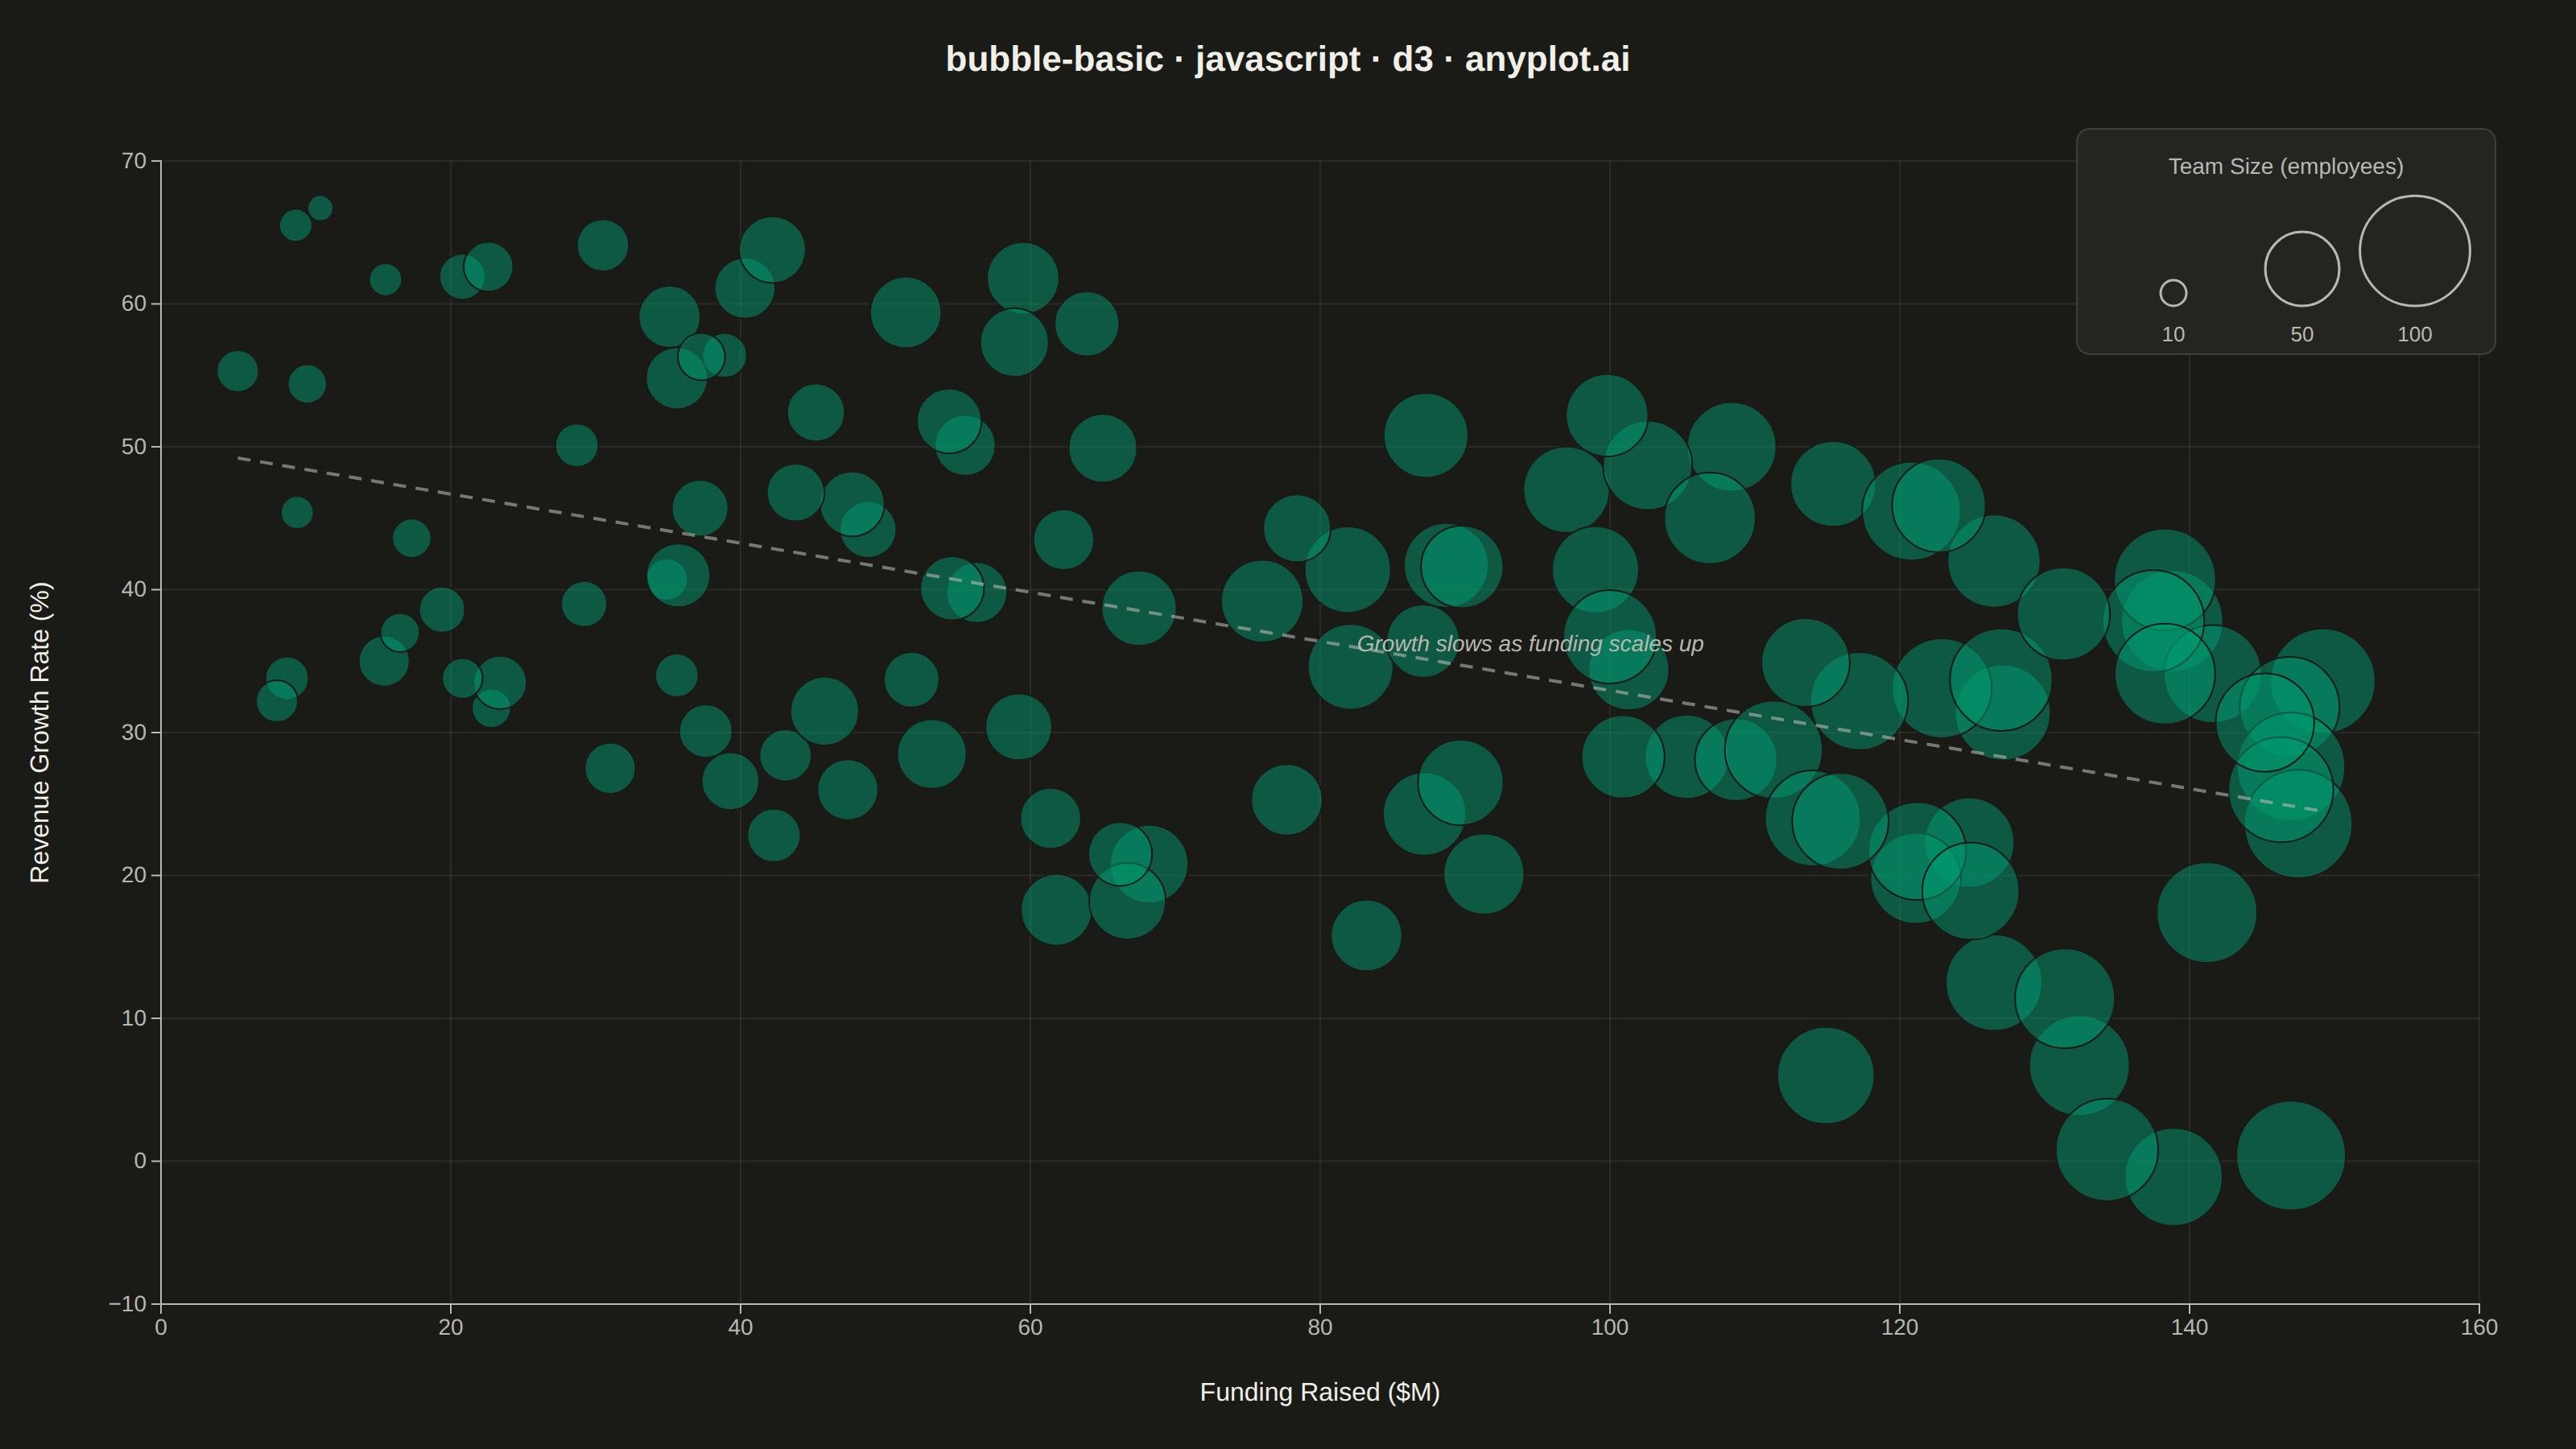
A bubble chart extending scatter plots by adding a third dimension through bubble size. Each point's position shows two variables (x, y) while the bubble size represents a third quantitative variable. This visualization is excellent for understanding relationships between three numerical variables simultaneously, revealing patterns that would be hidden in traditional 2D scatter plots.
// anyplot.ai
// bubble-basic: Basic Bubble Chart
// Library: d3 7.9.0 | JavaScript 22.23.2
// Quality: 84/100 | Updated: 2026-09-27

const t = window.ANYPLOT_TOKENS;
const { width, height } = window.ANYPLOT_SIZE;
const margin = { top: 100, right: 60, bottom: 90, left: 100 };
const iw = width - margin.left - margin.right;
const ih = height - margin.top - margin.bottom;

// --- Data (in-memory, deterministic) ----------------------------------------
// Startup funding rounds: funding raised vs. revenue growth rate, bubble size
// encodes team size — funding drives hiring, while growth slows as rounds grow.
function lcg(seed) {
  let state = seed;
  return () => {
    state = (state * 1664525 + 1013904223) >>> 0;
    return state / 4294967296;
  };
}
const rand = lcg(42);

const n = 120;
const data = [];
for (let i = 0; i < n; i++) {
  const funding = 2 + rand() * 148;
  const growth = 55 - funding * 0.25 + (rand() - 0.5) * 45;
  const team = 10 + funding * 0.55 + (rand() - 0.5) * 20;
  data.push({
    funding: Math.round(funding * 10) / 10,
    growth: Math.round(growth * 10) / 10,
    team: Math.round(Math.min(100, Math.max(10, team))),
  });
}

// --- SVG mount ----------------------------------------------------------------
const svg = d3.select("#container").append("svg").attr("width", width).attr("height", height);
const g = svg.append("g").attr("transform", `translate(${margin.left},${margin.top})`);

// --- Scales ---------------------------------------------------------------
const x = d3.scaleLinear().domain([0, d3.max(data, (d) => d.funding)]).nice().range([0, iw]);
const y = d3.scaleLinear().domain(d3.extent(data, (d) => d.growth)).nice().range([ih, 0]);
const teamExtent = d3.extent(data, (d) => d.team);
// Radius scaled by sqrt(team) so the bubble AREA (not radius) is proportional
// to team size, per the spec's perceptual-accuracy requirement.
const r = d3.scaleSqrt().domain(teamExtent).range([7, 18]);
// Stroke weight steps up across team-size terciles — a secondary encoding
// that reinforces the size channel with an outline cue, mirrored in the
// legend below so the reference set and the real bubbles agree.
const strokeWidth = d3.scaleQuantize().domain(teamExtent).range([1, 2, 3.5]);

// --- Gridlines --------------------------------------------------------------
const gridX = g.append("g")
  .attr("transform", `translate(0,${ih})`)
  .call(d3.axisBottom(x).tickSize(-ih).tickFormat(""));
const gridY = g.append("g").call(d3.axisLeft(y).tickSize(-iw).tickFormat(""));
for (const grid of [gridX, gridY]) {
  grid.select(".domain").remove();
  grid.selectAll("line").attr("stroke", t.grid).attr("stroke-opacity", 0.5);
}

// --- Axes ---------------------------------------------------------------------
const xAxis = g.append("g").attr("transform", `translate(0,${ih})`).call(d3.axisBottom(x));
const yAxis = g.append("g").call(d3.axisLeft(y));
for (const ax of [xAxis, yAxis]) {
  ax.selectAll("text").attr("fill", t.inkSoft).style("font-size", "14px");
  ax.selectAll("line").attr("stroke", t.inkSoft);
  // Domain lines stay theme-adaptive but softened (opacity, not inkSoft at
  // full strength) so the L-shaped frame reads as a subtle anchor rather
  // than a bold outline, matching the gridlines' restraint.
  ax.select(".domain").attr("stroke", t.inkSoft).attr("stroke-opacity", 0.55);
}

// --- Axis labels --------------------------------------------------------------
g.append("text")
  .attr("x", iw / 2)
  .attr("y", ih + 60)
  .attr("text-anchor", "middle")
  .attr("fill", t.ink)
  .style("font-size", "16px")
  .text("Funding Raised ($M)");

g.append("text")
  .attr("transform", "rotate(-90)")
  .attr("x", -ih / 2)
  .attr("y", -70)
  .attr("text-anchor", "middle")
  .attr("fill", t.ink)
  .style("font-size", "16px")
  .text("Revenue Growth Rate (%)");

// --- Bubbles --------------------------------------------------------------
// Every bubble sits at its true (funding, growth) coordinate — overlap in the
// densest funding cluster is handled through fill-opacity and a thin
// page-colored outline, not by displacing marks from their data values.
g.selectAll("circle.bubble").data(data).join("circle")
  .attr("class", "bubble")
  .attr("cx", (d) => x(d.funding))
  .attr("cy", (d) => y(d.growth))
  .attr("r", (d) => r(d.team))
  .attr("fill", t.palette[0])
  .attr("fill-opacity", 0.58)
  .attr("stroke", t.pageBg)
  .attr("stroke-width", (d) => strokeWidth(d.team));

// --- Size legend ------------------------------------------------------------
const teamMedian = d3.median(data, (d) => d.team);
const legendValues = [
  Math.round(teamExtent[0] / 5) * 5,
  Math.round(teamMedian / 5) * 5,
  Math.round(teamExtent[1] / 5) * 5,
];
const legendR = legendValues.map((v) => r(v));
const legendBoxW = 260;
const legendBoxH = 140;
const legend = svg.append("g")
  .attr("transform", `translate(${margin.left + iw - legendBoxW + 10},${margin.top - 20})`);

legend.append("rect")
  .attr("width", legendBoxW)
  .attr("height", legendBoxH)
  .attr("fill", t.elevatedBg)
  .attr("stroke", t.grid)
  .attr("rx", 8);

legend.append("text")
  .attr("x", legendBoxW / 2)
  .attr("y", 28)
  .attr("text-anchor", "middle")
  .attr("fill", t.inkSoft)
  .style("font-size", "14px")
  .text("Team Size (employees)");

// Legend circles echo the real bubble treatment (brand-green tint at the
// same 0.58 fill-opacity as the real marks, with the same background-colored
// cutout stroke) and reuse the same team-size stroke-width scale as the real
// bubbles, so the reference set matches the data in fill and outline alike.
const baselineY = 110;
const legendX = [60, 140, 210];
legendValues.forEach((v, i) => {
  legend.append("circle")
    .attr("cx", legendX[i])
    .attr("cy", baselineY - legendR[i])
    .attr("r", legendR[i])
    .attr("fill", t.palette[0])
    .attr("fill-opacity", 0.58)
    .attr("stroke", t.pageBg)
    .attr("stroke-width", strokeWidth(v));
  legend.append("text")
    .attr("x", legendX[i])
    .attr("y", baselineY + 22)
    .attr("text-anchor", "middle")
    .attr("fill", t.inkSoft)
    .style("font-size", "16px")
    .text(v);
});

// --- Title ------------------------------------------------------------------
svg.append("text")
  .attr("x", width / 2)
  .attr("y", 44)
  .attr("text-anchor", "middle")
  .attr("fill", t.ink)
  .style("font-size", "22px")
  .style("font-weight", "600")
  .text("bubble-basic · javascript · d3 · anyplot.ai");
Runnable source as JSON, for any HTTP client: https://api.anyplot.ai/specs/bubble-basic/d3/code. Any spec id and library id listed in llms-full.txt fit the same URL shape; every URL below is complete and callable.
{
  "spec_id": "bubble-basic",
  "language": "javascript",
  "library": "d3",
  "page": "https://anyplot.ai/bubble-basic/javascript/d3",
  "hub": "https://anyplot.ai/bubble-basic",
  "code_json": "https://api.anyplot.ai/specs/bubble-basic/d3/code",
  "spec_json": "https://api.anyplot.ai/specs/bubble-basic",
  "render_light_png": "https://storage.googleapis.com/anyplot-images/plots/bubble-basic/javascript/d3/plot-light.png",
  "render_dark_png": "https://storage.googleapis.com/anyplot-images/plots/bubble-basic/javascript/d3/plot-dark.png",
  "interactive_light_html": "https://storage.googleapis.com/anyplot-images/plots/bubble-basic/javascript/d3/plot-light.html",
  "interactive_dark_html": "https://storage.googleapis.com/anyplot-images/plots/bubble-basic/javascript/d3/plot-dark.html",
  "quality_score": 84.0,
  "license": "MIT",
  "guide": "https://anyplot.ai/llms.txt"
}
Part of Basic Bubble Chart on anyplot.ai.