The same plot in 14 other libraries — JavaScript: D3.js, Apache ECharts, Highcharts, MUI X Charts; Python: Altair, Bokeh, lets-plot, Matplotlib, Plotly, plotnine, Pygal, Seaborn; R: ggplot2; Julia: Makie.jl. Compare all 15 side by side: Basic Packed Bubble Chart in Python, R, Julia and JavaScript.
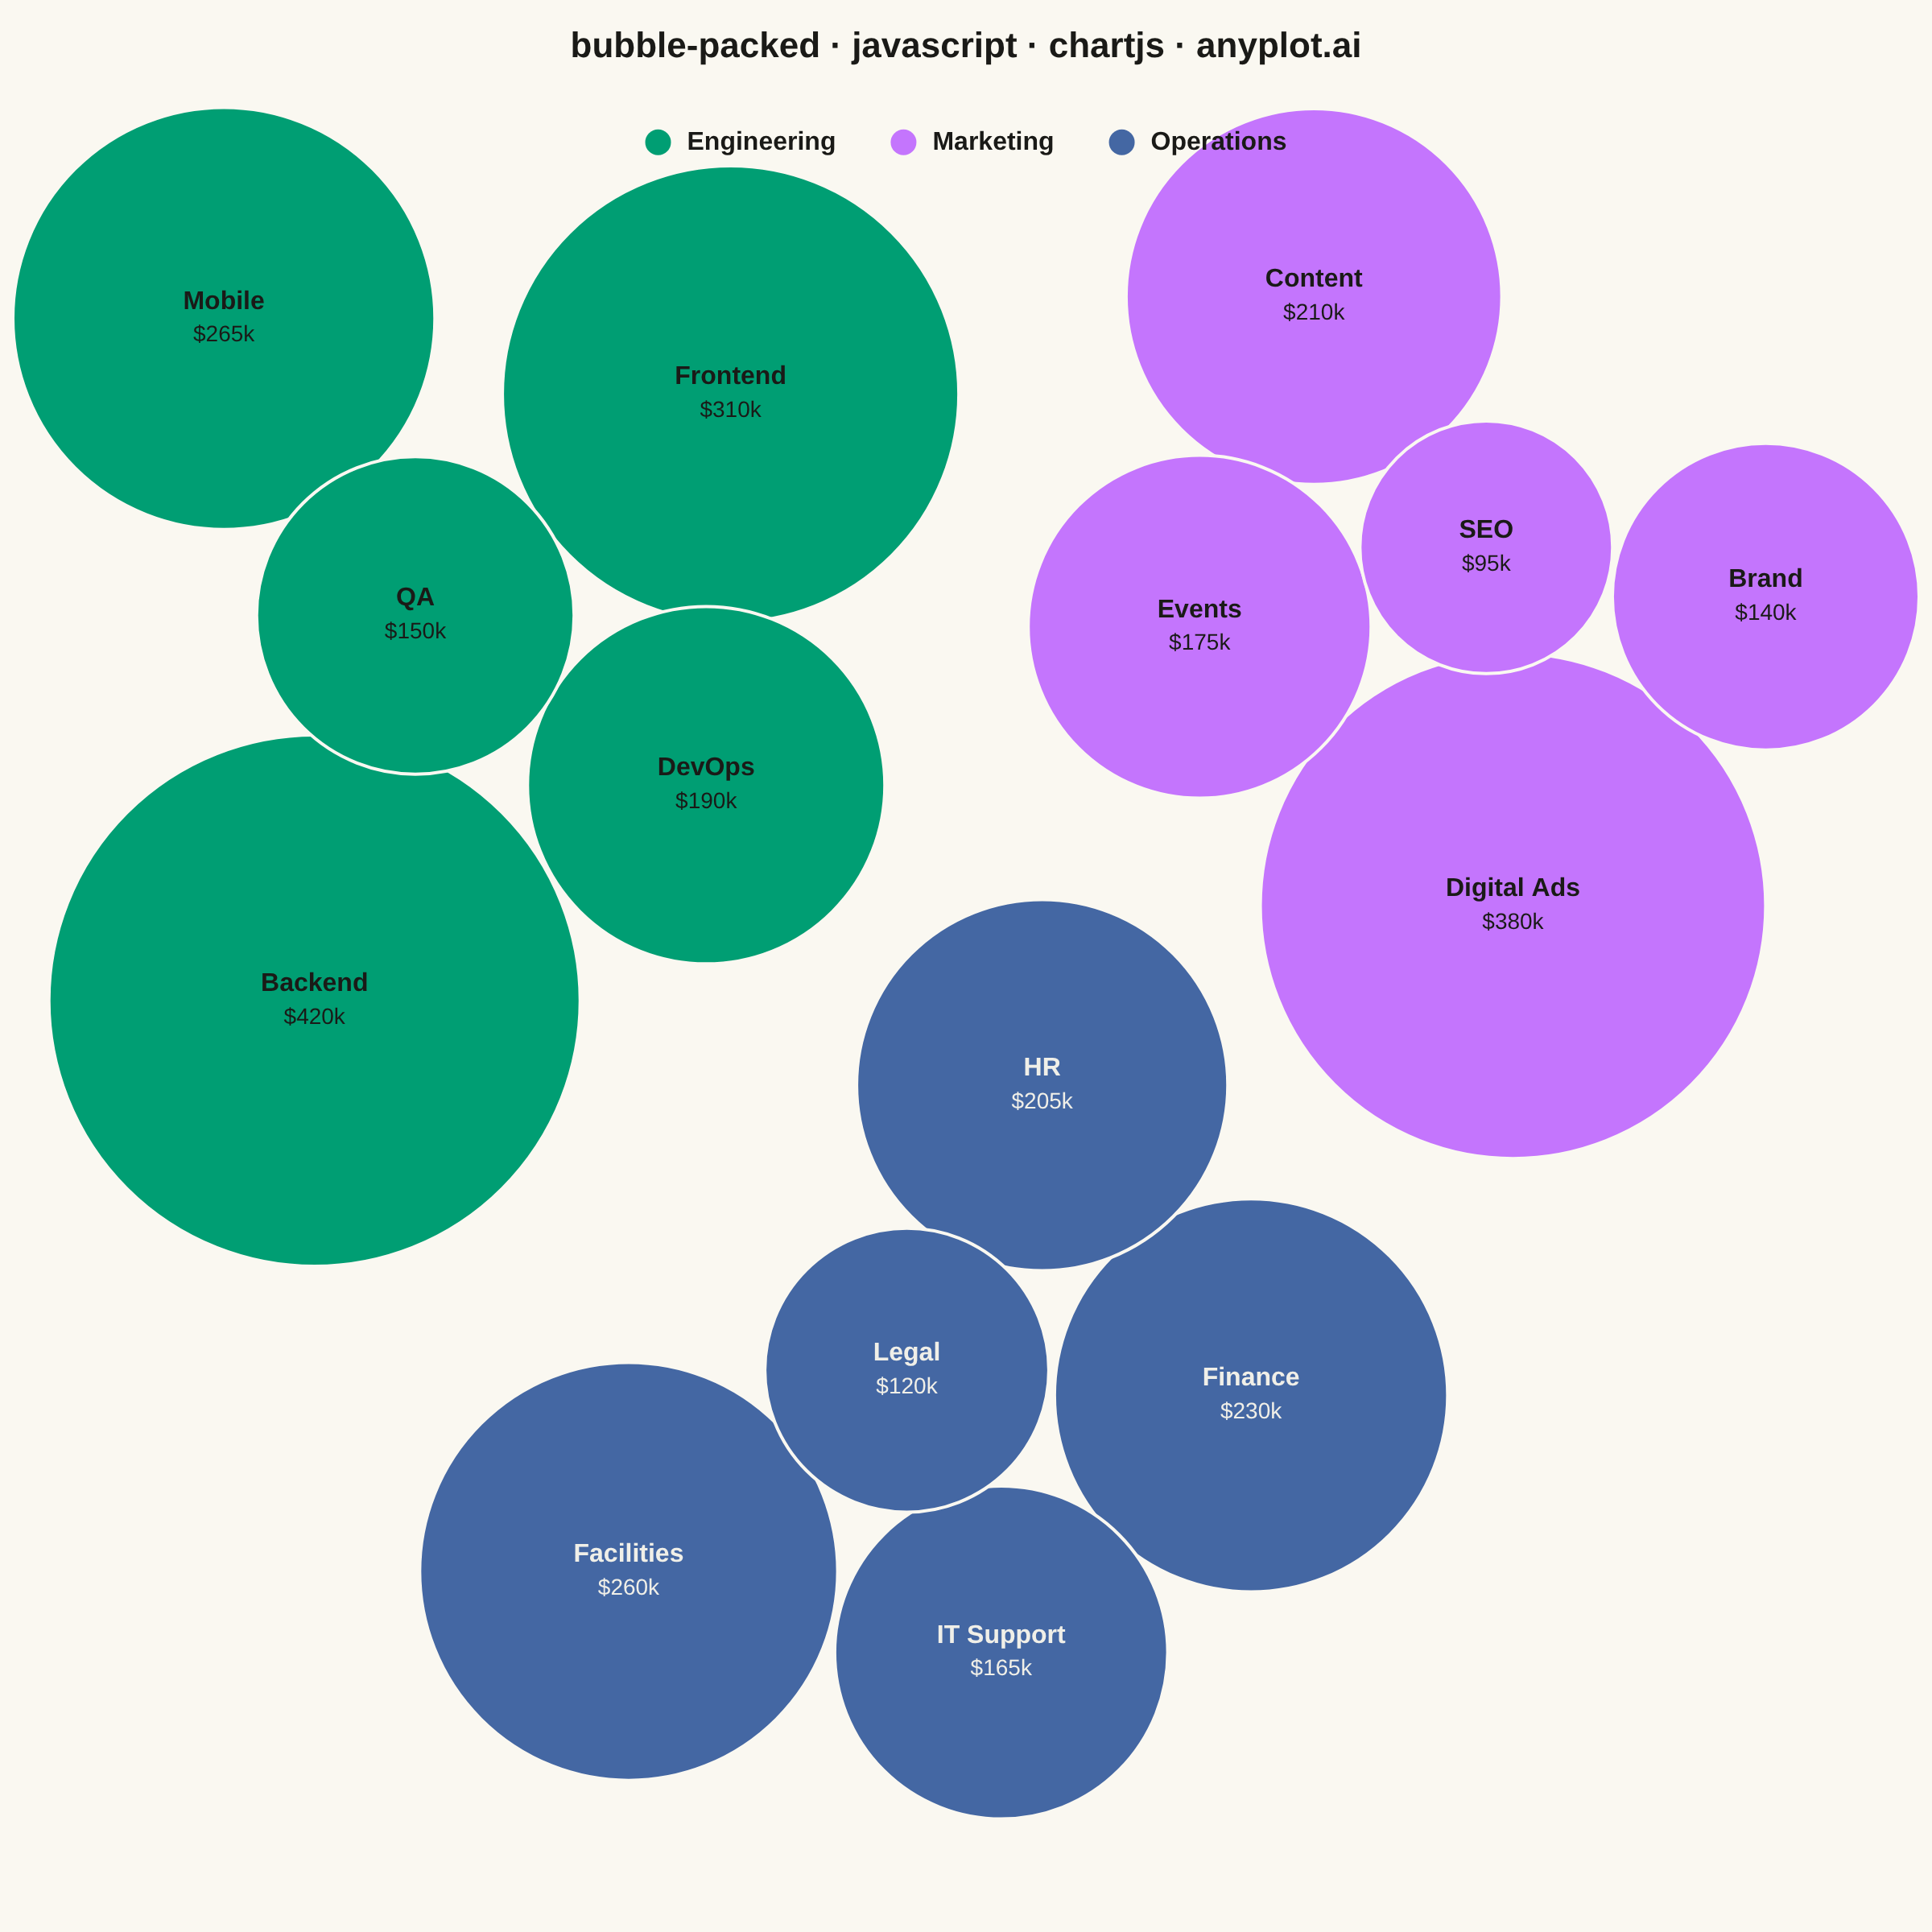
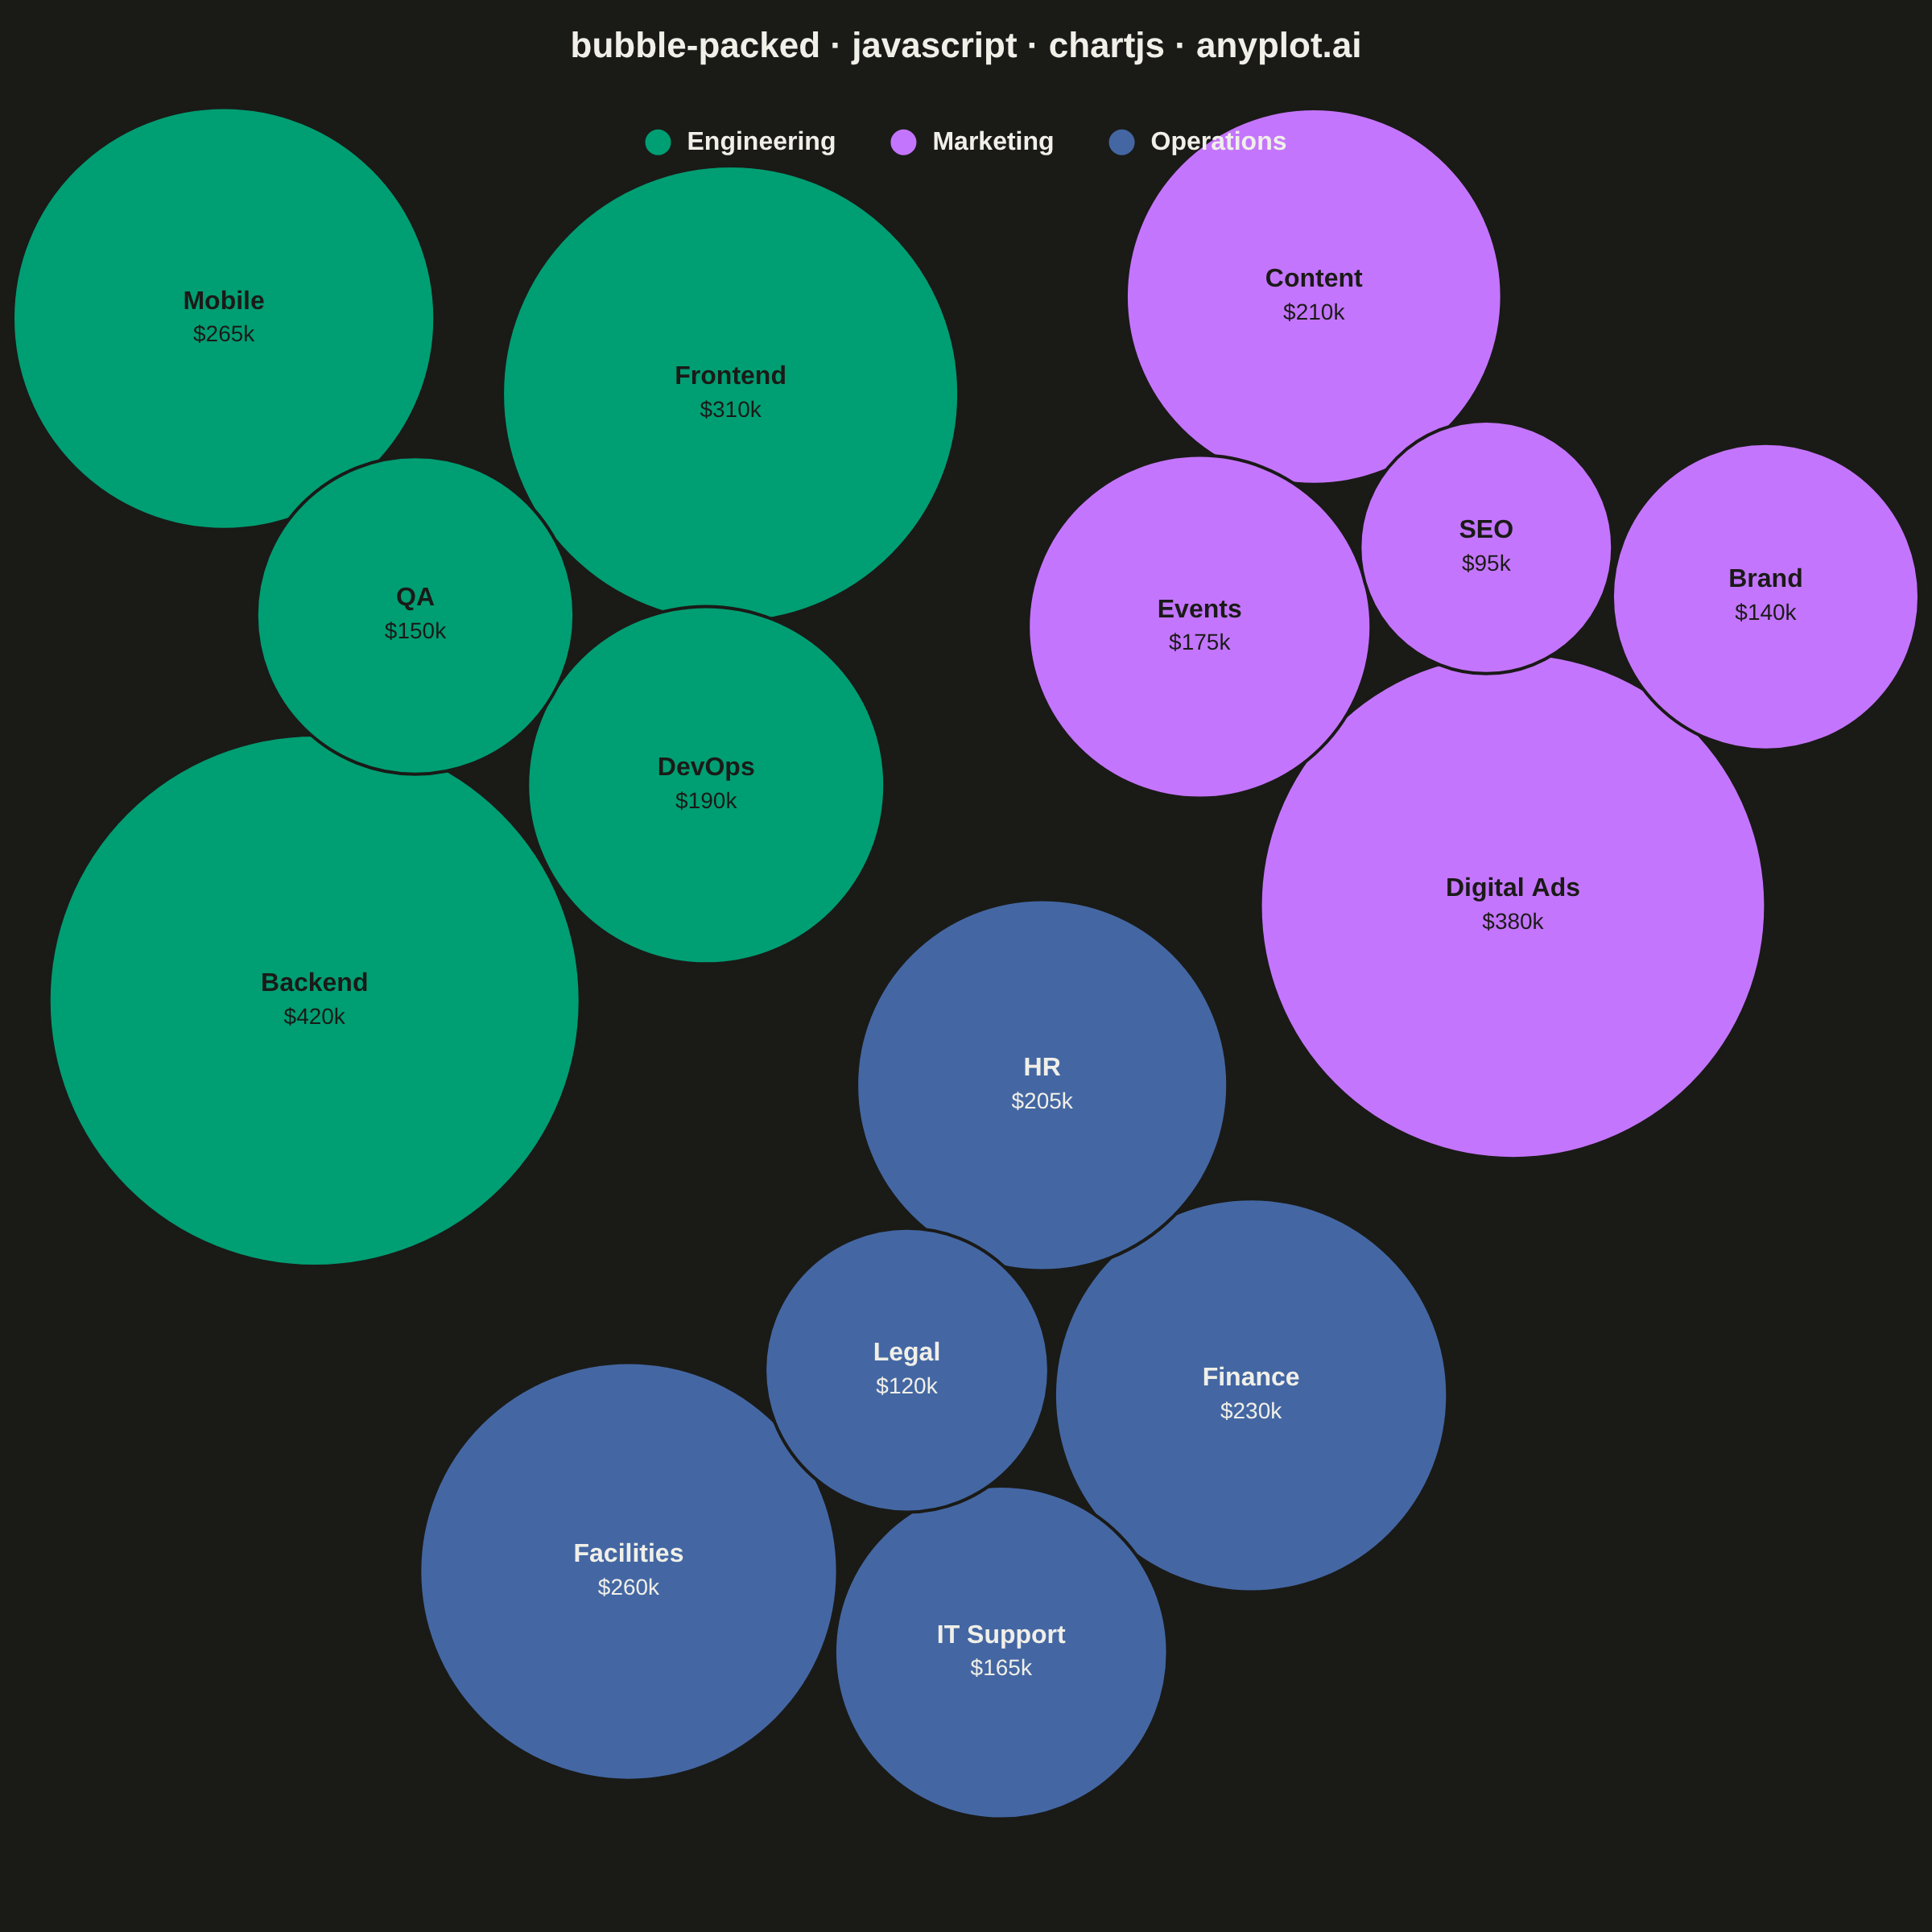
A packed bubble chart displays data as circles where size represents value, and circles are packed together without overlap using physics simulation. Unlike scatter or traditional bubble charts, position has no meaning - only size and optional grouping matter. This visualization efficiently uses space for comparing values across many categories.
// anyplot.ai
// bubble-packed: Basic Packed Bubble Chart
// Library: chartjs 4.4.7 | JavaScript 22.23.2
// Quality: 90/100 | Created: 2026-08-24

//# anyplot-orientation: square

const t = window.ANYPLOT_TOKENS;

// --- Data: annual department budgets ($k), clustered by division -----------
const departments = [
  { label: "Backend", value: 420, group: "Engineering" },
  { label: "Frontend", value: 310, group: "Engineering" },
  { label: "Mobile", value: 265, group: "Engineering" },
  { label: "DevOps", value: 190, group: "Engineering" },
  { label: "QA", value: 150, group: "Engineering" },
  { label: "Digital Ads", value: 380, group: "Marketing" },
  { label: "Content", value: 210, group: "Marketing" },
  { label: "Events", value: 175, group: "Marketing" },
  { label: "Brand", value: 140, group: "Marketing" },
  { label: "SEO", value: 95, group: "Marketing" },
  { label: "Facilities", value: 260, group: "Operations" },
  { label: "Finance", value: 230, group: "Operations" },
  { label: "HR", value: 205, group: "Operations" },
  { label: "IT Support", value: 165, group: "Operations" },
  { label: "Legal", value: 120, group: "Operations" },
];

const GROUPS = ["Engineering", "Marketing", "Operations"];
const groupColor = Object.fromEntries(GROUPS.map((g, i) => [g, t.palette[i]]));
// Anchors reach toward all four corners of the square canvas (top-left,
// top-right, bottom-center) with the vertical gap between the top row and
// the bottom cluster tightened so bubble ink — not blank margin — dominates.
const groupCenters = {
  Engineering: { x: 290, y: 320 },
  Marketing: { x: 910, y: 320 },
  Operations: { x: 600, y: 860 },
};

// --- Radius by area (not radius) so circle size tracks value linearly ------
const MAX_R = 165;
const maxValue = Math.max(...departments.map((d) => d.value));
const radiusScale = (v) => (MAX_R * Math.sqrt(v)) / Math.sqrt(maxValue);

// --- Circle packing via iterative collision relaxation (no external libs) --
// Deterministic LCG for the initial jitter — the browser has no seeded RNG.
function lcg(seed) {
  let s = seed;
  return () => (s = (s * 1103515245 + 12345) % 2147483648) / 2147483648;
}
const rand = lcg(42);

const LAYOUT_W = 1200;
const LAYOUT_H = 1200;
const SAME_GROUP_GAP = 6;
const CROSS_GROUP_GAP = 22;
const ITERATIONS = 600;
const CENTER_PULL = 0.015;

const nodes = departments.map((d) => {
  const center = groupCenters[d.group];
  const angle = rand() * Math.PI * 2;
  const jitter = rand() * 60;
  return {
    ...d,
    r: radiusScale(d.value),
    x: center.x + Math.cos(angle) * jitter,
    y: center.y + Math.sin(angle) * jitter,
  };
});

for (let iter = 0; iter < ITERATIONS; iter++) {
  for (let i = 0; i < nodes.length; i++) {
    for (let j = i + 1; j < nodes.length; j++) {
      const a = nodes[i];
      const b = nodes[j];
      const dx = b.x - a.x;
      const dy = b.y - a.y;
      const dist = Math.sqrt(dx * dx + dy * dy) || 0.01;
      const gap = a.group === b.group ? SAME_GROUP_GAP : CROSS_GROUP_GAP;
      const minDist = a.r + b.r + gap;
      if (dist < minDist) {
        const overlap = (minDist - dist) / 2;
        const ux = dx / dist;
        const uy = dy / dist;
        a.x -= ux * overlap;
        a.y -= uy * overlap;
        b.x += ux * overlap;
        b.y += uy * overlap;
      }
    }
  }
  for (const n of nodes) {
    const center = groupCenters[n.group];
    n.x += (center.x - n.x) * CENTER_PULL;
    n.y += (center.y - n.y) * CENTER_PULL;
    n.x = Math.min(LAYOUT_W - n.r - 8, Math.max(n.r + 8, n.x));
    n.y = Math.min(LAYOUT_H - n.r - 8, Math.max(n.r + 8, n.y));
  }
}

// --- Label contrast: pick ink-dark or ink-light text per bubble fill -------
function relativeLuminance(r, g, b) {
  const lin = (c) => {
    const s = c / 255;
    return s <= 0.03928 ? s / 12.92 : Math.pow((s + 0.055) / 1.055, 2.4);
  };
  return 0.2126 * lin(r) + 0.7152 * lin(g) + 0.0722 * lin(b);
}
function contrastRatio(l1, l2) {
  const lighter = Math.max(l1, l2);
  const darker = Math.min(l1, l2);
  return (lighter + 0.05) / (darker + 0.05);
}
function labelColorFor(hex) {
  const n = parseInt(hex.slice(1), 16);
  const luminance = relativeLuminance((n >> 16) & 255, (n >> 8) & 255, n & 255);
  const darkContrast = contrastRatio(luminance, relativeLuminance(0x1a, 0x1a, 0x17));
  const lightContrast = contrastRatio(luminance, relativeLuminance(0xf0, 0xef, 0xe8));
  return darkContrast >= lightContrast ? "#1A1A17" : "#F0EFE8";
}

// --- Custom plugin: name+value label inside each bubble (dropping the value
// line below a radius floor so small circles never cram two lines), plus a
// manually-drawn legend key (kept off the Chart.js layout system so the
// hidden x/y scales stay at a 1:1 pixel-to-data ratio and circles stay round).
const VALUE_LINE_MIN_R = 46;
const bubbleLabels = {
  id: "bubbleLabels",
  afterDatasetsDraw(chart) {
    const { ctx } = chart;
    ctx.save();
    ctx.textAlign = "center";
    ctx.textBaseline = "middle";
    chart.data.datasets.forEach((dataset, dsIndex) => {
      const meta = chart.getDatasetMeta(dsIndex);
      meta.data.forEach((element, i) => {
        const point = dataset.data[i];
        const { x, y } = element.getProps(["x", "y"], true);
        const r = element.options.radius;
        const showValue = r >= VALUE_LINE_MIN_R;
        let nameFont = Math.min(16, Math.max(9, Math.round(r * 0.24)));
        ctx.font = `600 ${nameFont}px sans-serif`;
        while (nameFont > 9 && ctx.measureText(point.label).width > r * 1.7) {
          nameFont -= 1;
          ctx.font = `600 ${nameFont}px sans-serif`;
        }
        ctx.fillStyle = dataset.labelColor;
        if (showValue) {
          ctx.fillText(point.label, x, y - nameFont * 0.65);
          const valueFont = Math.max(8, nameFont - 2);
          ctx.font = `400 ${valueFont}px sans-serif`;
          ctx.fillText(`$${point.value}k`, x, y + valueFont * 0.75);
        } else {
          ctx.fillText(point.label, x, y);
        }
      });
    });
    ctx.restore();
  },
  afterDraw(chart) {
    const { ctx, chartArea } = chart;
    ctx.save();
    ctx.font = "600 16px sans-serif";
    ctx.textBaseline = "middle";
    const dotR = 8;
    const dotTextGap = 10;
    const itemGap = 34;
    const widths = GROUPS.map((g) => dotR * 2 + dotTextGap + ctx.measureText(g).width);
    const totalWidth = widths.reduce((a, b) => a + b, 0) + itemGap * (GROUPS.length - 1);
    let lx = (chartArea.left + chartArea.right - totalWidth) / 2;
    const ly = chartArea.top + 22;
    GROUPS.forEach((g, i) => {
      ctx.fillStyle = groupColor[g];
      ctx.beginPath();
      ctx.arc(lx + dotR, ly, dotR, 0, Math.PI * 2);
      ctx.fill();
      ctx.fillStyle = t.ink;
      ctx.textAlign = "left";
      ctx.fillText(g, lx + dotR * 2 + dotTextGap, ly);
      lx += widths[i] + itemGap;
    });
    ctx.restore();
  },
};
Chart.register(bubbleLabels);

// --- Mount -------------------------------------------------------------------
const canvas = document.createElement("canvas");
document.getElementById("container").appendChild(canvas);

// --- Chart: bubble type used purely as a positioned-circle renderer --------
// Position (x, y) carries no meaning — only size (value) and color (group)
// do. Scales are hidden and bounded to the packing layout's own coordinate
// space; layout.autoPadding is off so that space maps 1:1 onto chart pixels
// (Chart.js otherwise reserves extra margin sized to the largest bubble
// radius, which would compress the layout and leave circles under-scaled).
new Chart(canvas, {
  type: "bubble",
  data: {
    datasets: GROUPS.map((g) => ({
      label: g,
      labelColor: labelColorFor(groupColor[g]),
      backgroundColor: groupColor[g],
      borderColor: t.pageBg,
      borderWidth: 2,
      data: nodes
        .filter((n) => n.group === g)
        .map((n) => ({ x: n.x, y: n.y, r: n.r, label: n.label, value: n.value })),
    })),
  },
  options: {
    responsive: true,
    maintainAspectRatio: false,
    animation: false,
    layout: { padding: 0, autoPadding: false },
    plugins: {
      title: {
        display: true,
        text: "bubble-packed · javascript · chartjs · anyplot.ai",
        color: t.ink,
        font: { size: 22 },
        padding: { top: 16, bottom: 24 },
      },
      legend: { display: false },
      tooltip: {
        callbacks: {
          label: (item) => `${item.raw.label}: $${item.raw.value}k`,
        },
      },
    },
    scales: {
      x: { display: false, min: 0, max: LAYOUT_W },
      y: { display: false, min: 0, max: LAYOUT_H, reverse: true },
    },
  },
});
Runnable source as JSON, for any HTTP client: https://api.anyplot.ai/specs/bubble-packed/chartjs/code. Any spec id and library id listed in llms-full.txt fit the same URL shape; every URL below is complete and callable.
{
  "spec_id": "bubble-packed",
  "language": "javascript",
  "library": "chartjs",
  "page": "https://anyplot.ai/bubble-packed/javascript/chartjs",
  "hub": "https://anyplot.ai/bubble-packed",
  "code_json": "https://api.anyplot.ai/specs/bubble-packed/chartjs/code",
  "spec_json": "https://api.anyplot.ai/specs/bubble-packed",
  "render_light_png": "https://storage.googleapis.com/anyplot-images/plots/bubble-packed/javascript/chartjs/plot-light.png",
  "render_dark_png": "https://storage.googleapis.com/anyplot-images/plots/bubble-packed/javascript/chartjs/plot-dark.png",
  "interactive_light_html": "https://storage.googleapis.com/anyplot-images/plots/bubble-packed/javascript/chartjs/plot-light.html",
  "interactive_dark_html": "https://storage.googleapis.com/anyplot-images/plots/bubble-packed/javascript/chartjs/plot-dark.html",
  "quality_score": 90.0,
  "license": "MIT",
  "guide": "https://anyplot.ai/llms.txt"
}
Part of Basic Packed Bubble Chart on anyplot.ai.