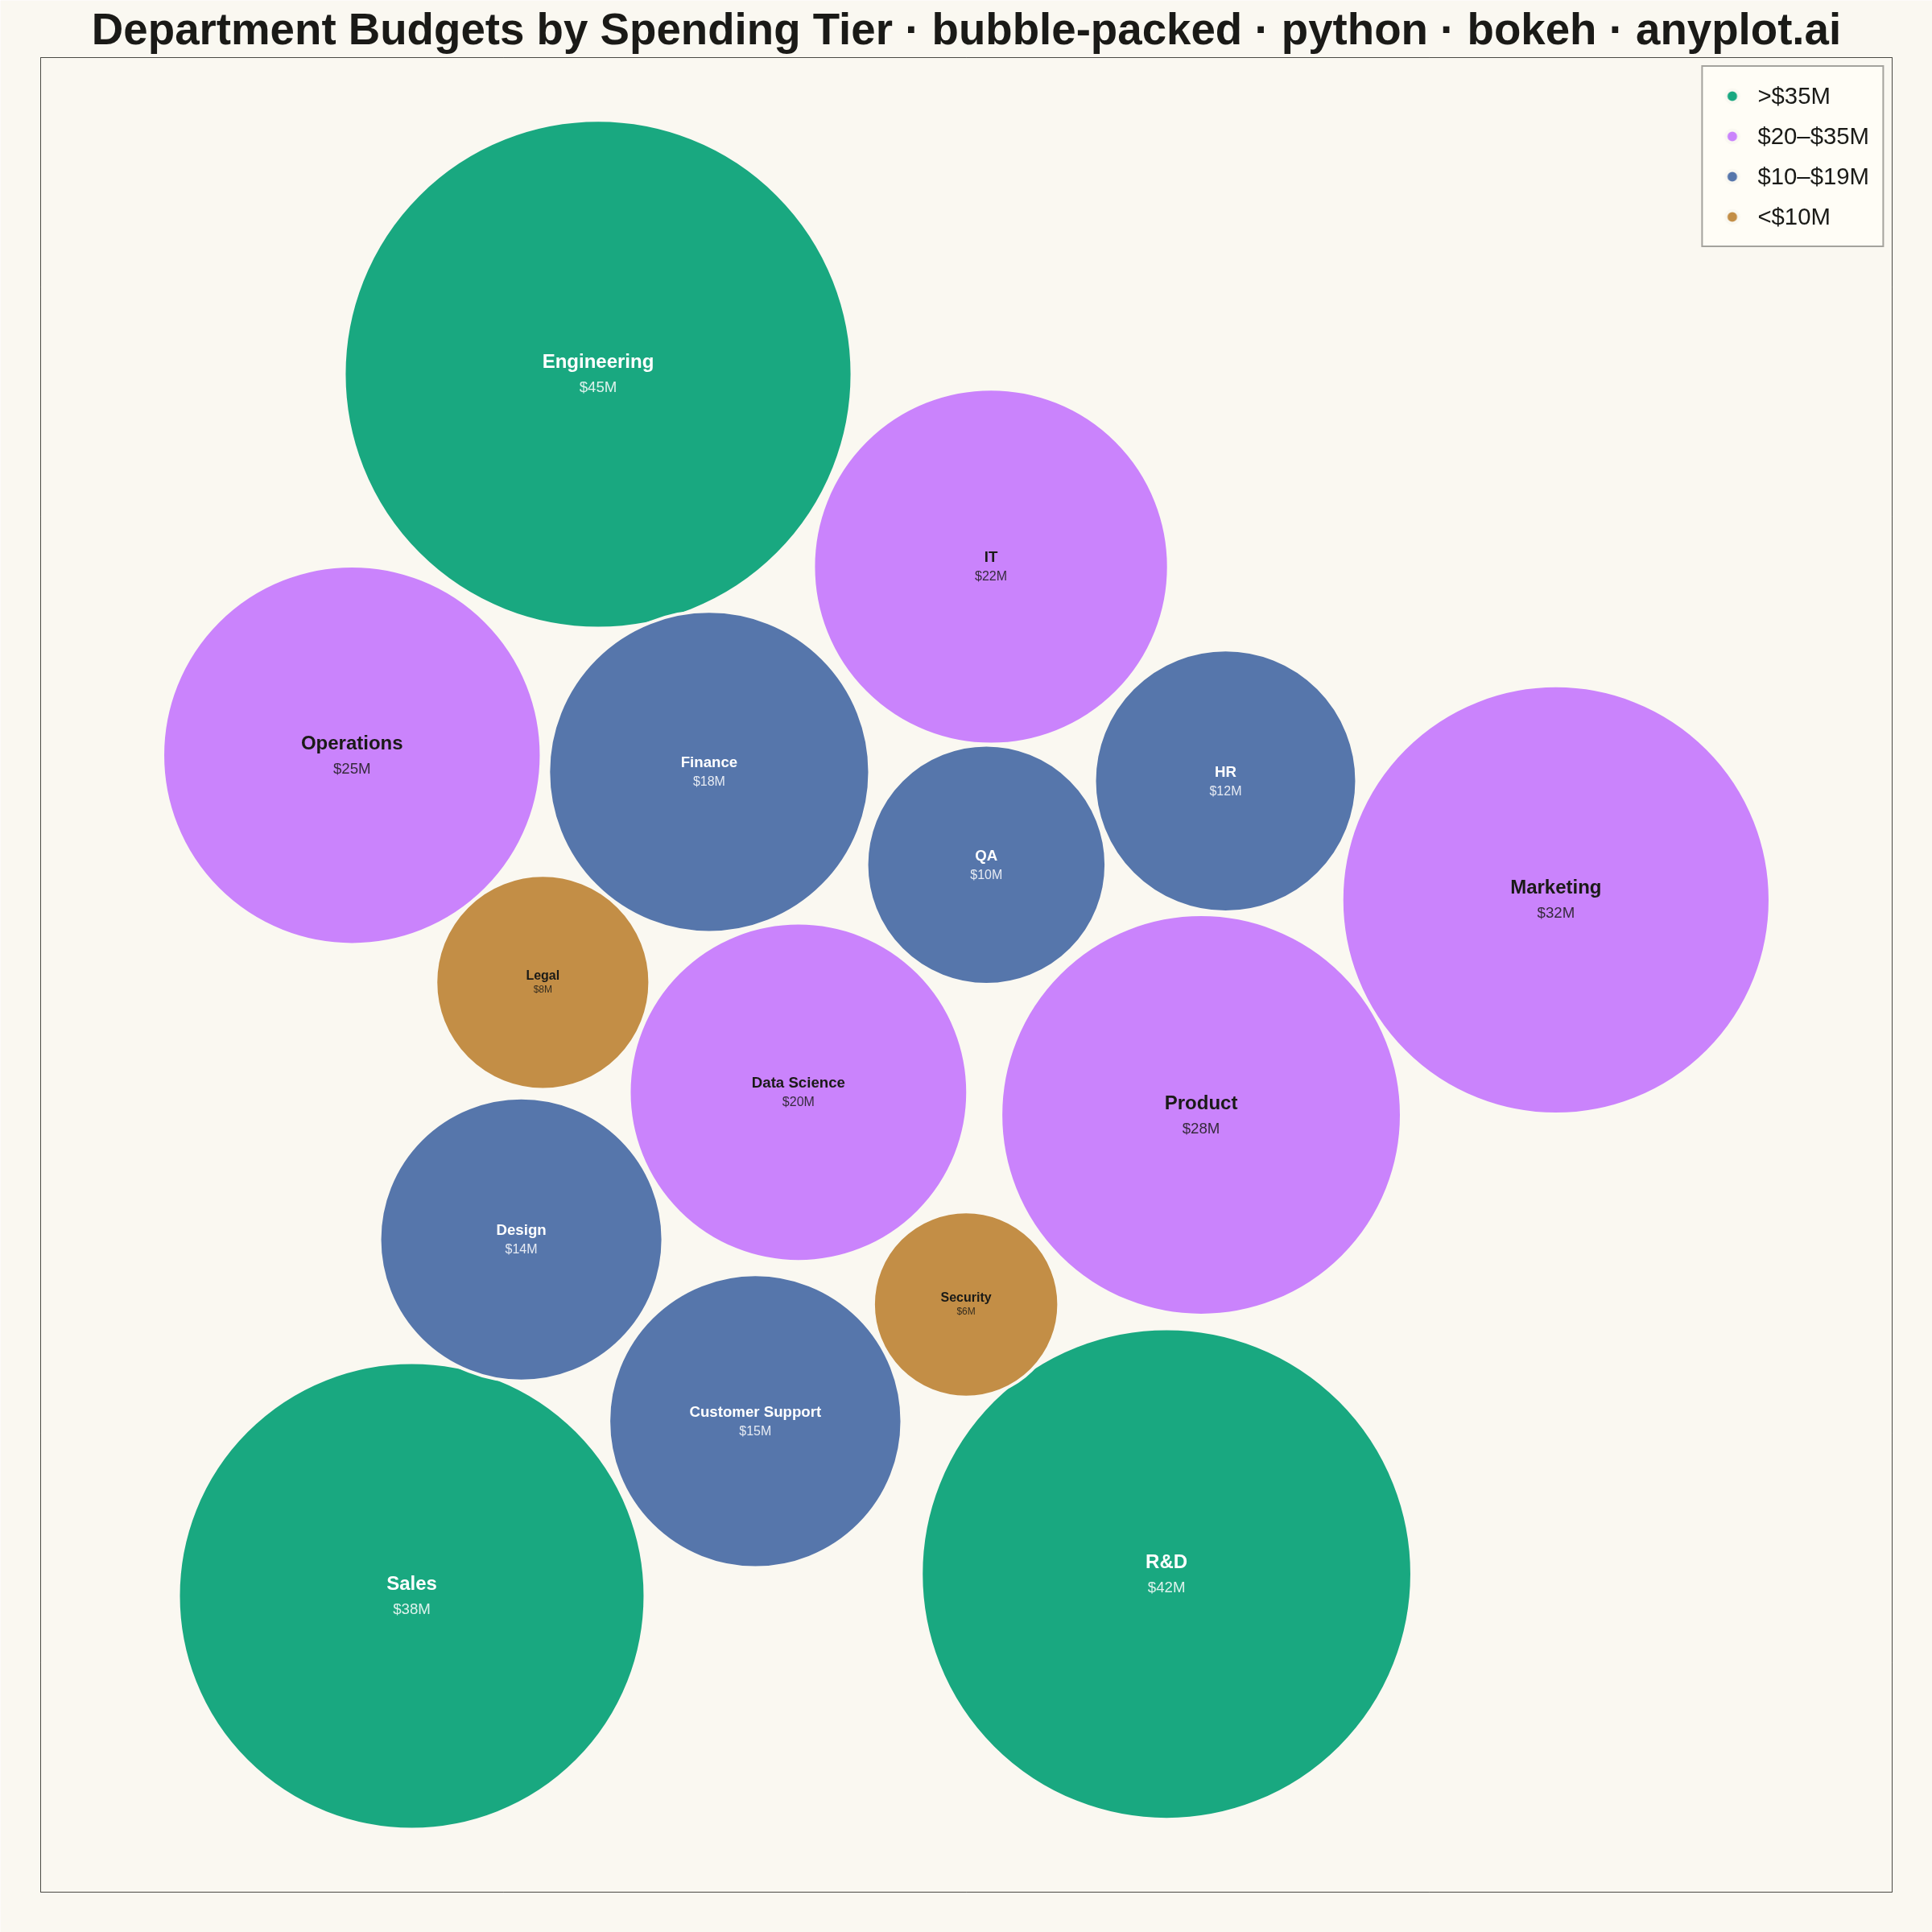
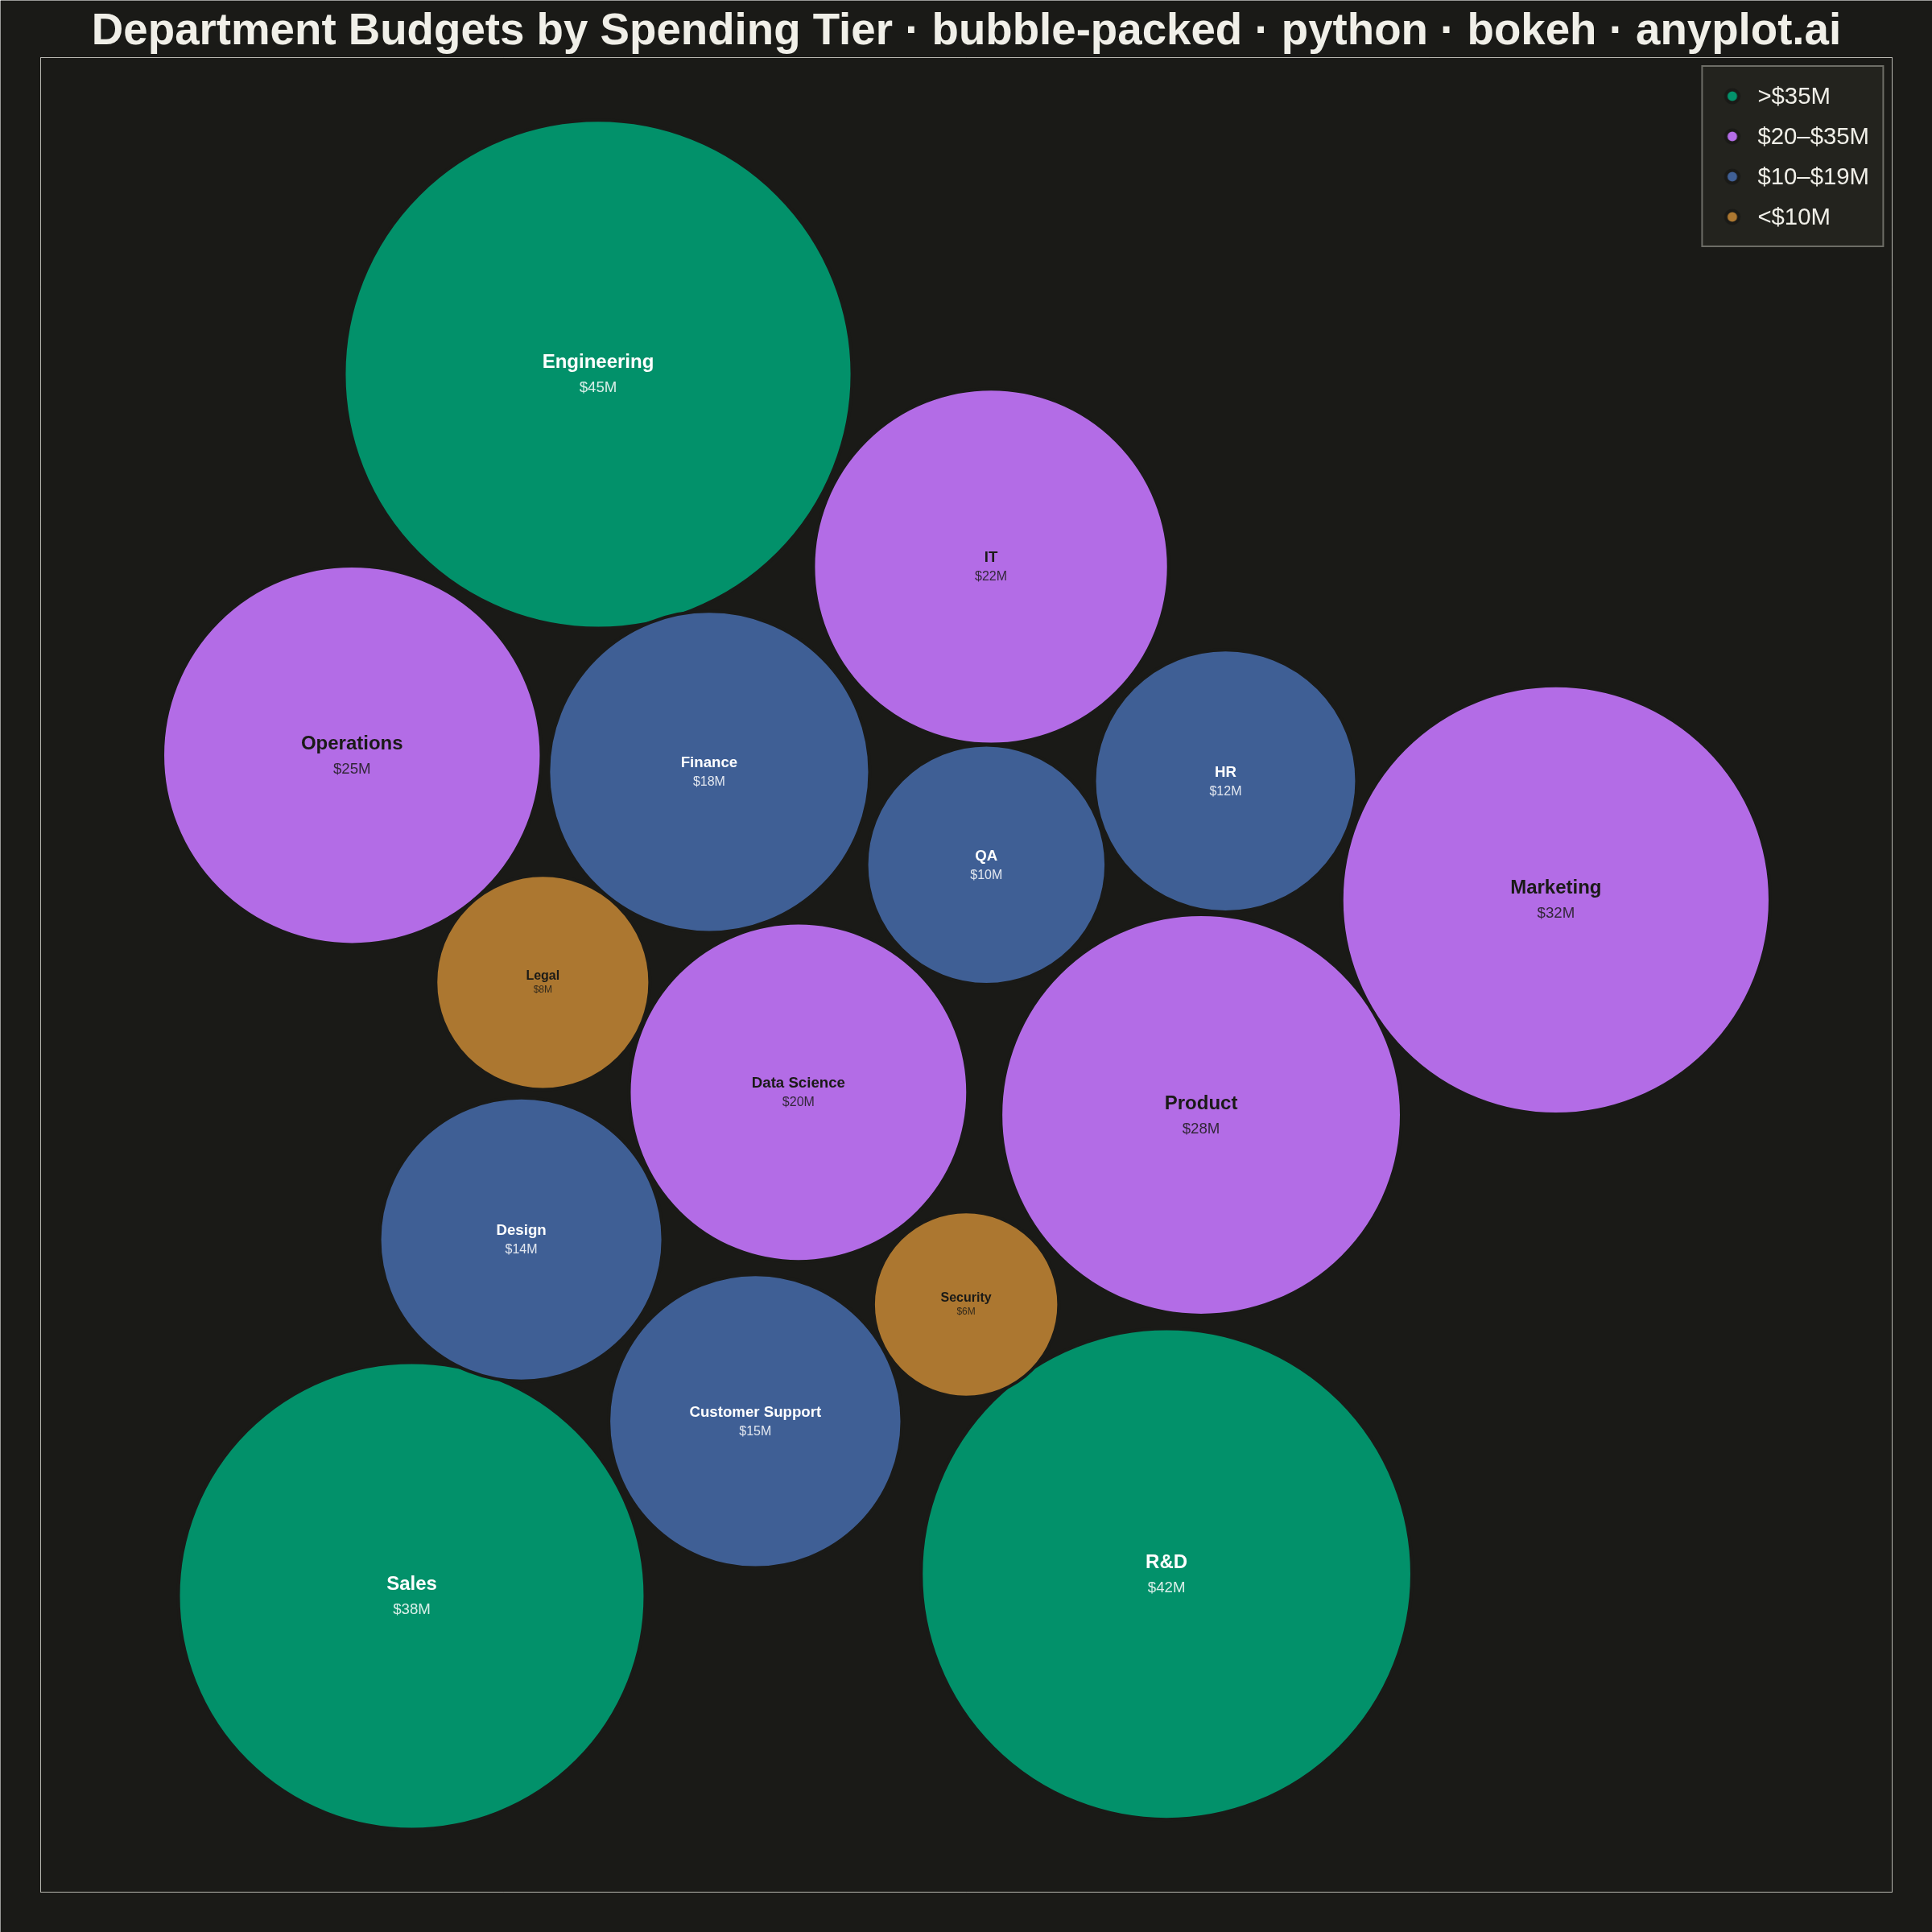
A packed bubble chart displays data as circles where size represents value, and circles are packed together without overlap using physics simulation. Unlike scatter or traditional bubble charts, position has no meaning - only size and optional grouping matter. This visualization efficiently uses space for comparing values across many categories.
""" anyplot.ai
bubble-packed: Basic Packed Bubble Chart
Library: bokeh 3.9.0 | Python 3.13.13
Quality: 87/100 | Updated: 2026-05-29
"""

import os
import time
from pathlib import Path

import numpy as np
from bokeh.io import output_file, save
from bokeh.models import ColumnDataSource, HoverTool, LabelSet
from bokeh.plotting import figure
from selenium import webdriver
from selenium.webdriver.chrome.options import Options


THEME = os.getenv("ANYPLOT_THEME", "light")
PAGE_BG = "#FAF8F1" if THEME == "light" else "#1A1A17"
ELEVATED_BG = "#FFFDF6" if THEME == "light" else "#242420"
INK = "#1A1A17" if THEME == "light" else "#F0EFE8"
INK_SOFT = "#4A4A44" if THEME == "light" else "#B8B7B0"

np.random.seed(42)

# Data — department budgets (millions)
departments = [
    "Engineering",
    "Marketing",
    "Sales",
    "Operations",
    "HR",
    "Finance",
    "R&D",
    "Legal",
    "IT",
    "Customer Support",
    "Product",
    "Design",
    "QA",
    "Data Science",
    "Security",
]
budgets = [45, 32, 38, 25, 12, 18, 42, 8, 22, 15, 28, 14, 10, 20, 6]
n = len(budgets)

# Area-scaled radii (sqrt) for accurate visual perception
vals = np.array(budgets, dtype=float)
max_r = 310
radii = np.sqrt(vals / vals.max()) * max_r

# Force-directed circle packing in 2400×2400 coordinate space
W, H = 2400, 2400
center = np.array([W / 2.0, H / 2.0])
pos = center + (np.random.rand(n, 2) - 0.5) * 400
pad = 12

for step in range(600):
    pos += (center - pos) * 0.012
    total_shift = 0.0
    for i in range(n):
        for j in range(i + 1, n):
            d = pos[j] - pos[i]
            dist = np.linalg.norm(d) + 1e-6
            gap = radii[i] + radii[j] + pad
            if dist < gap:
                s = d / dist * (gap - dist) * 0.5
                pos[i] -= s
                pos[j] += s
                total_shift += gap - dist
    pos[:, 0] = np.clip(pos[:, 0], radii + 50, W - radii - 50)
    pos[:, 1] = np.clip(pos[:, 1], radii + 50, H - radii - 50)
    if step > 200 and total_shift < 1.0:
        break

# Recenter cluster
x_lo = (pos[:, 0] - radii).min()
x_hi = (pos[:, 0] + radii).max()
y_lo = (pos[:, 1] - radii).min()
y_hi = (pos[:, 1] + radii).max()
pos[:, 0] += (W - (x_lo + x_hi)) / 2
pos[:, 1] += (H - (y_lo + y_hi)) / 2

# Equal x/y range so data-unit circles render as true circles on square canvas
margin = 80
x_lo = (pos[:, 0] - radii).min() - margin
x_hi = (pos[:, 0] + radii).max() + margin
y_lo = (pos[:, 1] - radii).min() - margin
y_hi = (pos[:, 1] + radii).max() + margin
cx = (x_lo + x_hi) / 2
cy = (y_lo + y_hi) / 2
half = max(x_hi - x_lo, y_hi - y_lo) / 2
xr = (cx - half, cx + half)
yr = (cy - half, cy + half)

# Imprint palette tier colors (canonical order: #009E73, #C475FD, #4467A3, #BD8233)
# Text color fixed per-tier based on fill luminance — circle fills don't change between themes
tier_defs = [
    (">$35M", "#009E73", "#FFFFFF", [i for i in range(n) if budgets[i] > 35]),
    ("$20–$35M", "#C475FD", "#1A1A17", [i for i in range(n) if 20 <= budgets[i] <= 35]),
    ("$10–$19M", "#4467A3", "#FFFFFF", [i for i in range(n) if 10 <= budgets[i] < 20]),
    ("<$10M", "#BD8233", "#1A1A17", [i for i in range(n) if budgets[i] < 10]),
]

p = figure(
    width=W,
    height=H,
    title="Department Budgets by Spending Tier · bubble-packed · python · bokeh · anyplot.ai",
    x_range=xr,
    y_range=yr,
    tools="",
    toolbar_location=None,
)

renderers = []
for tier_name, color, _text_color, idx in tier_defs:
    if not idx:
        continue
    src = ColumnDataSource(
        data={
            "x": pos[idx, 0].tolist(),
            "y": pos[idx, 1].tolist(),
            "radius": radii[idx].tolist(),
            "dept": [departments[i] for i in idx],
            "budget": [f"${budgets[i]}M" for i in idx],
            "tier": [tier_name for _ in idx],
        }
    )
    r = p.circle(
        x="x",
        y="y",
        radius="radius",
        source=src,
        fill_color=color,
        fill_alpha=0.90,
        line_color=PAGE_BG,
        line_width=4,
        legend_label=tier_name,
    )
    renderers.append(r)

# Adaptive label sizes by radius bracket (scaled for 2400×2400 canvas)
# y_offset is in screen pixels, separating department name (above) and value (below)
brackets = [(225, float("inf"), "18pt", "14pt", 16), (135, 225, "14pt", "12pt", 12), (0, 135, "12pt", "9pt", 9)]

for lo, hi, name_fs, val_fs, y_off in brackets:
    for _tier, _color, text_color, tier_idx in tier_defs:
        idx = [i for i in tier_idx if lo <= radii[i] < hi]
        if not idx:
            continue
        src = ColumnDataSource(
            data={
                "x": pos[idx, 0].tolist(),
                "y": pos[idx, 1].tolist(),
                "name": [departments[i] for i in idx],
                "val": [f"${budgets[i]}M" for i in idx],
            }
        )
        p.add_layout(
            LabelSet(
                x="x",
                y="y",
                text="name",
                source=src,
                text_align="center",
                text_baseline="middle",
                text_font_size=name_fs,
                text_color=text_color,
                text_font_style="bold",
                y_offset=y_off,
            )
        )
        p.add_layout(
            LabelSet(
                x="x",
                y="y",
                text="val",
                source=src,
                text_align="center",
                text_baseline="middle",
                text_font_size=val_fs,
                text_color=text_color,
                text_alpha=0.85,
                y_offset=-y_off,
            )
        )

# Theme-adaptive chrome
p.title.text_font_size = "41pt"
p.title.align = "center"
p.title.text_color = INK
p.xaxis.visible = False
p.yaxis.visible = False
p.xgrid.visible = False
p.ygrid.visible = False
p.background_fill_color = PAGE_BG
p.border_fill_color = PAGE_BG
p.outline_line_color = INK_SOFT
p.min_border = 50

# Legend — theme-adaptive styling with improved sizing for 2400px canvas
p.legend.location = "top_right"
p.legend.label_text_font_size = "22pt"
p.legend.label_text_color = INK
p.legend.glyph_height = 40
p.legend.glyph_width = 40
p.legend.background_fill_color = ELEVATED_BG
p.legend.background_fill_alpha = 0.92
p.legend.border_line_color = INK_SOFT
p.legend.border_line_width = 2
p.legend.padding = 16
p.legend.spacing = 10
p.legend.label_standoff = 12
p.legend.click_policy = "hide"

# HoverTool — active in the HTML artifact
p.add_tools(
    HoverTool(tooltips=[("Department", "@dept"), ("Budget", "@budget"), ("Tier", "@tier")], renderers=renderers)
)

# Save interactive HTML (catalog artifact)
output_file(f"plot-{THEME}.html")
save(p)

# Screenshot with headless Chrome via Selenium (export_png uses snap chromedriver which fails)
# CDP setDeviceMetricsOverride forces the exact inner viewport — --window-size alone is
# consumed by browser chrome in headless mode and shrinks the rendered height.
opts = Options()
for arg in (
    "--headless=new",
    "--no-sandbox",
    "--disable-dev-shm-usage",
    "--disable-gpu",
    f"--window-size={W},{H}",
    "--hide-scrollbars",
):
    opts.add_argument(arg)

driver = webdriver.Chrome(options=opts)
driver.execute_cdp_cmd(
    "Emulation.setDeviceMetricsOverride", {"width": W, "height": H, "deviceScaleFactor": 1, "mobile": False}
)
driver.get(f"file://{Path(f'plot-{THEME}.html').resolve()}")
time.sleep(3)
driver.save_screenshot(f"plot-{THEME}.png")
driver.quit()

# Belt-and-braces: pad/crop to exact dims so the post-render gate always passes
from PIL import Image as _PILImage


_img = _PILImage.open(f"plot-{THEME}.png").convert("RGB")
if _img.size != (W, H):
    _norm = _PILImage.new("RGB", (W, H), PAGE_BG)
    _norm.paste(_img, ((W - _img.size[0]) // 2, (H - _img.size[1]) // 2))
    _norm.save(f"plot-{THEME}.png")
Runnable source as JSON, for any HTTP client: https://api.anyplot.ai/specs/bubble-packed/bokeh/code. Any spec id and library id listed in llms-full.txt fit the same URL shape; every URL below is complete and callable.
{
  "spec_id": "bubble-packed",
  "language": "python",
  "library": "bokeh",
  "page": "https://anyplot.ai/bubble-packed/python/bokeh",
  "hub": "https://anyplot.ai/bubble-packed",
  "code_json": "https://api.anyplot.ai/specs/bubble-packed/bokeh/code",
  "spec_json": "https://api.anyplot.ai/specs/bubble-packed",
  "render_light_png": "https://storage.googleapis.com/anyplot-images/plots/bubble-packed/python/bokeh/plot-light.png",
  "render_dark_png": "https://storage.googleapis.com/anyplot-images/plots/bubble-packed/python/bokeh/plot-dark.png",
  "interactive_light_html": "https://storage.googleapis.com/anyplot-images/plots/bubble-packed/python/bokeh/plot-light.html",
  "interactive_dark_html": "https://storage.googleapis.com/anyplot-images/plots/bubble-packed/python/bokeh/plot-dark.html",
  "quality_score": 87.0,
  "license": "MIT",
  "guide": "https://anyplot.ai/llms.txt"
}
Part of Basic Packed Bubble Chart on anyplot.ai.