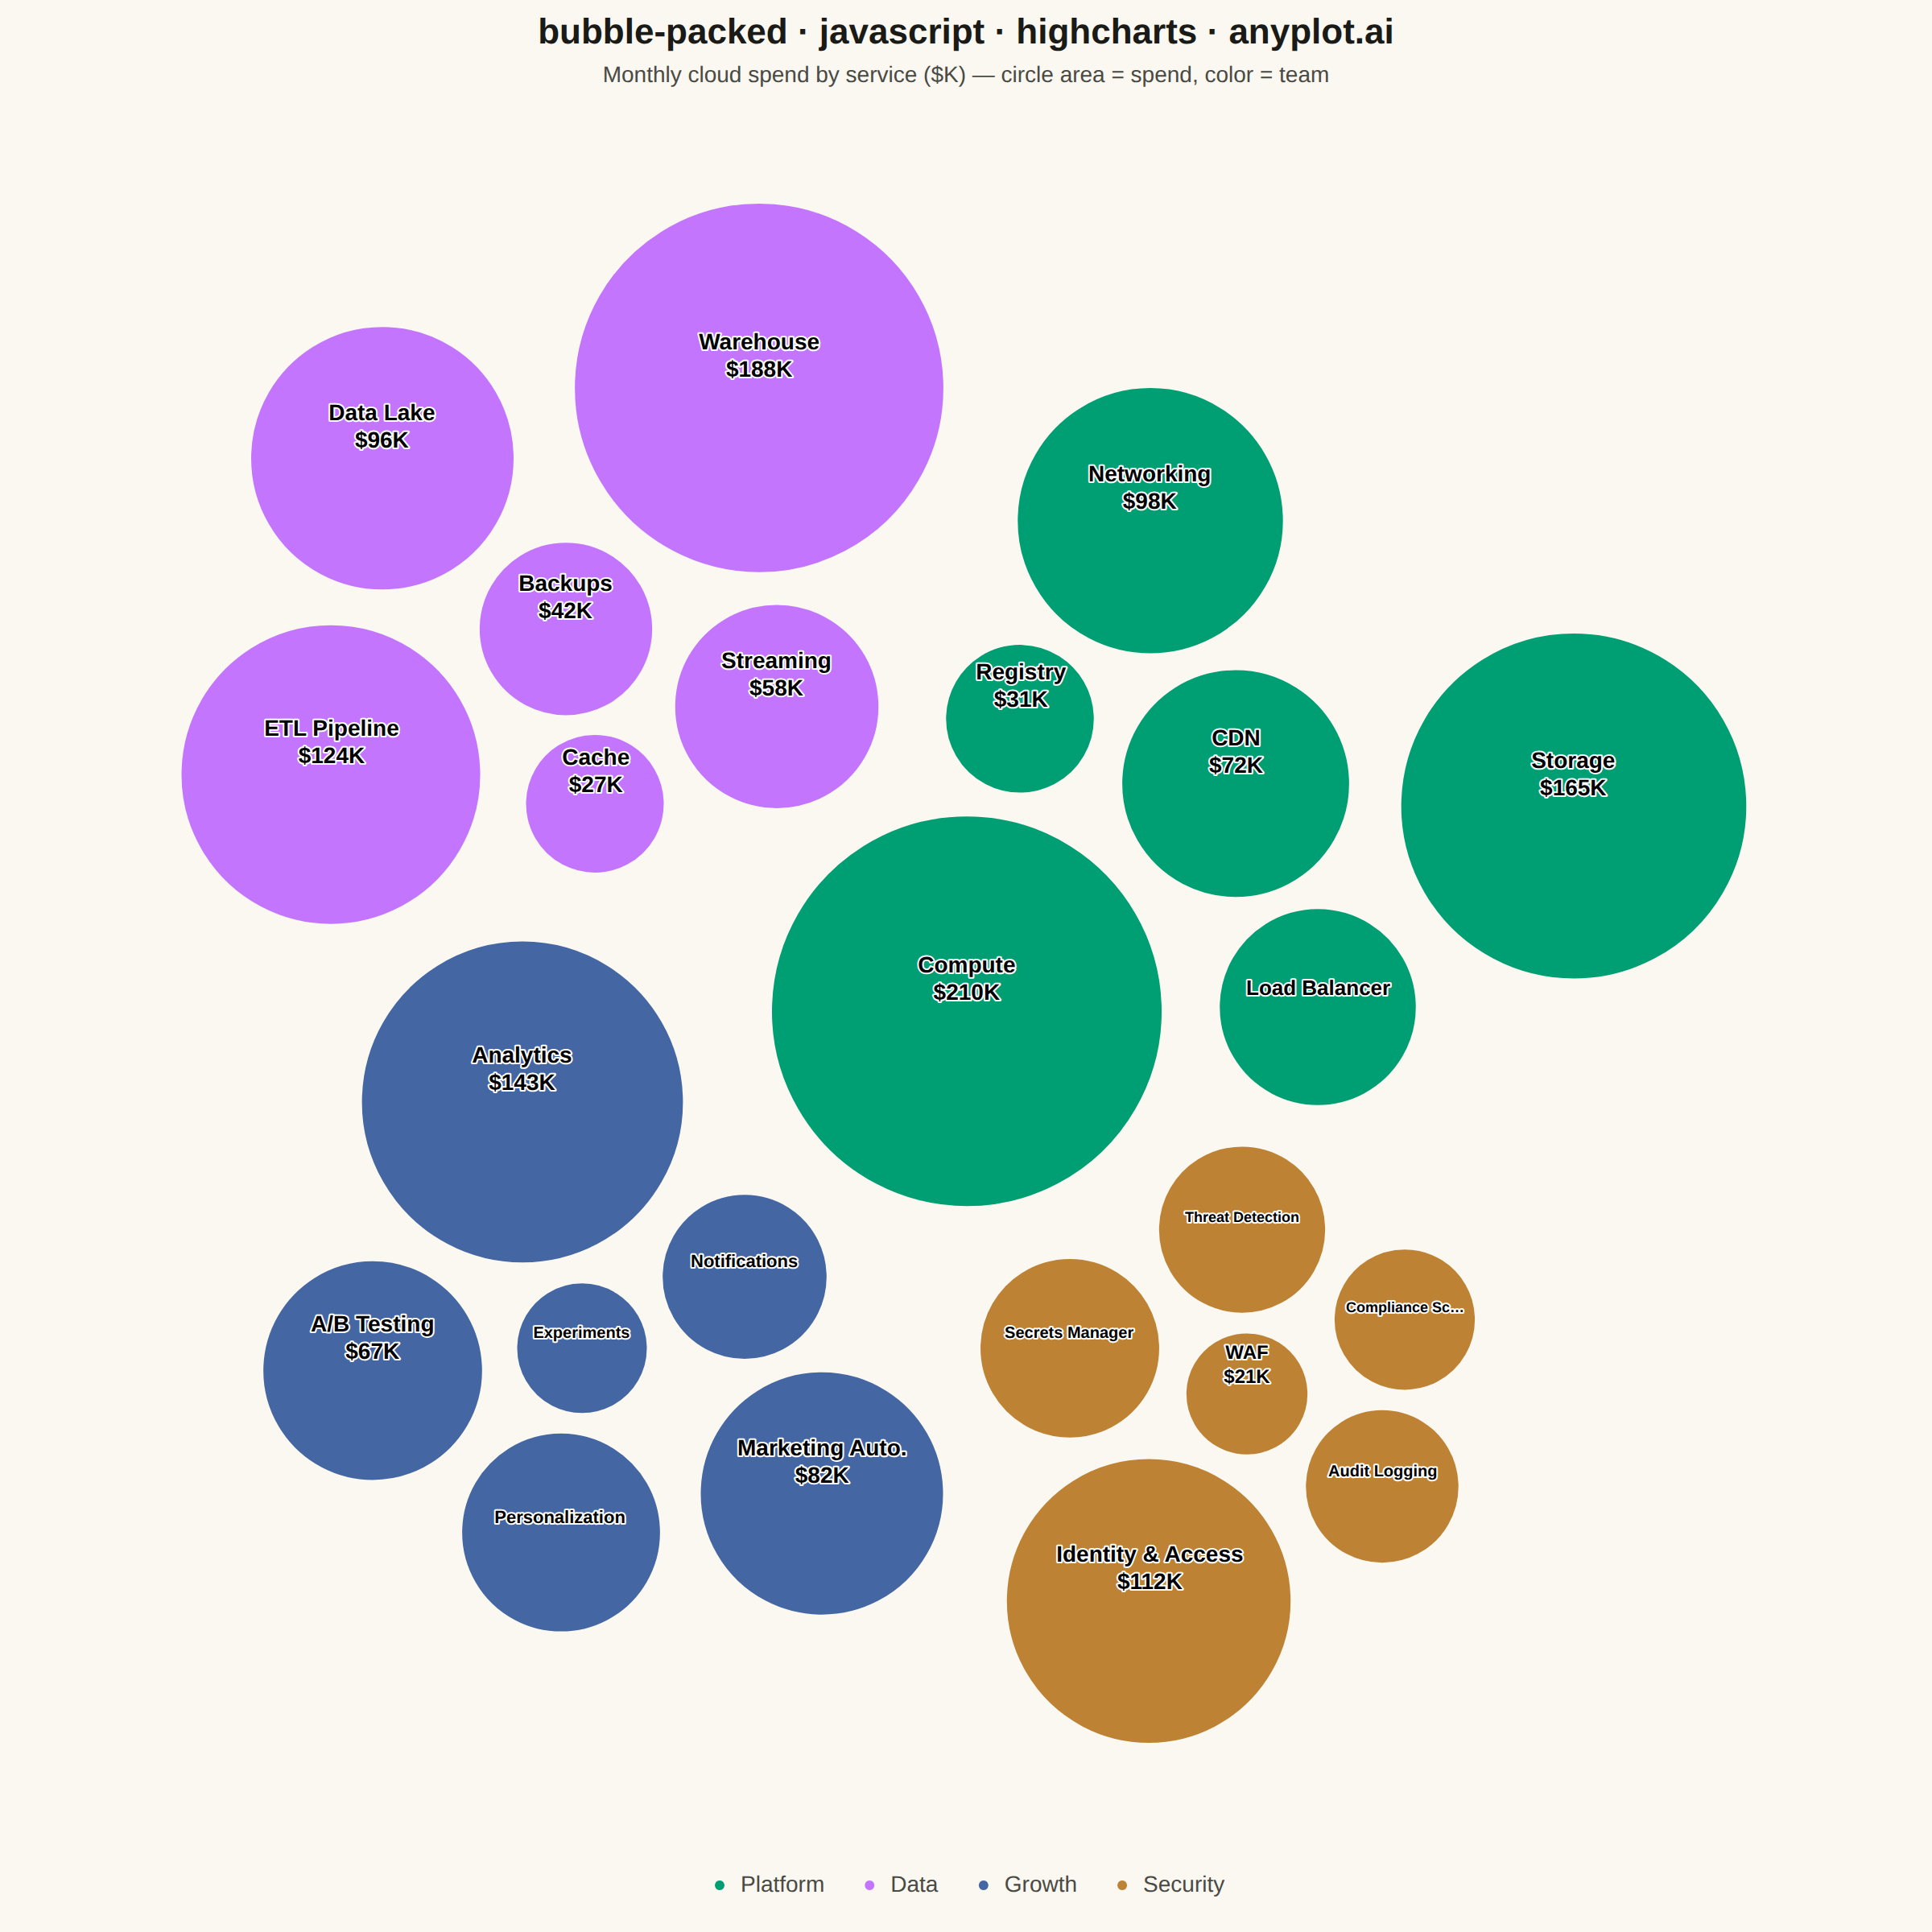
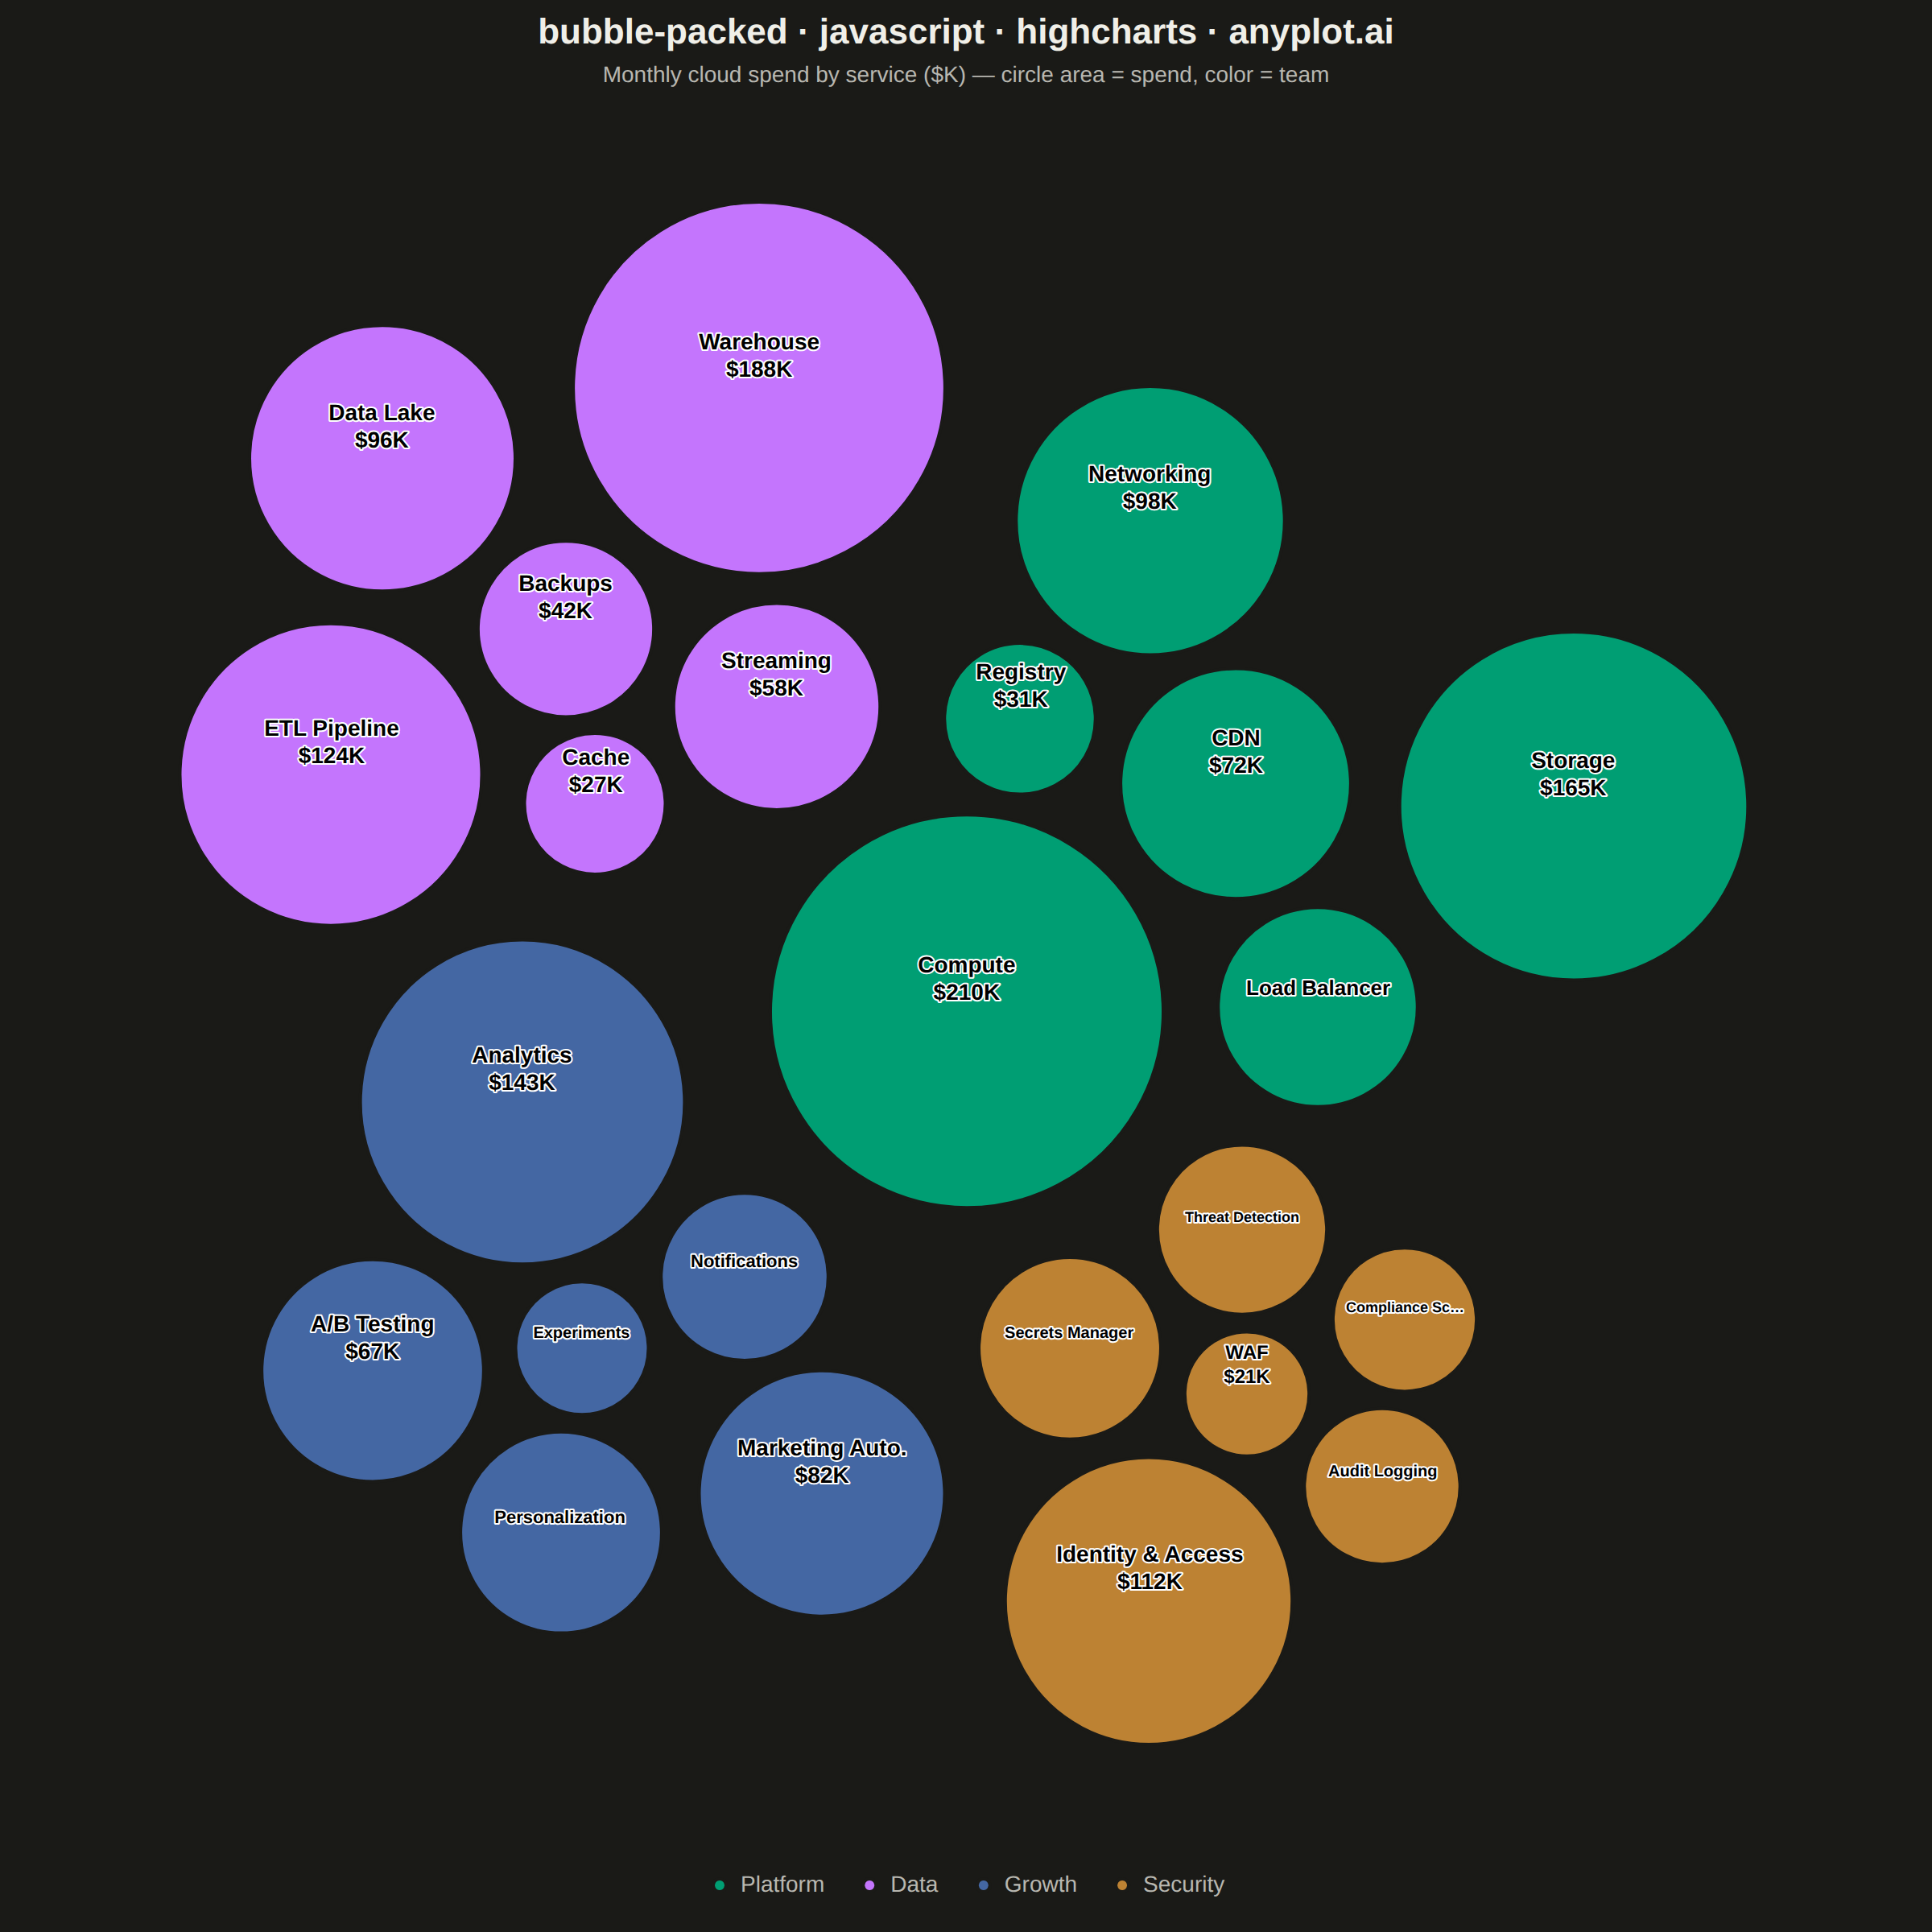
The same plot in 14 other libraries — JavaScript: Chart.js, D3.js, Apache ECharts, MUI X Charts; Python: Altair, Bokeh, lets-plot, Matplotlib, Plotly, plotnine, Pygal, Seaborn; R: ggplot2; Julia: Makie.jl. Compare all 15 side by side: Basic Packed Bubble Chart in Python, R, Julia and JavaScript.
A packed bubble chart displays data as circles where size represents value, and circles are packed together without overlap using physics simulation. Unlike scatter or traditional bubble charts, position has no meaning - only size and optional grouping matter. This visualization efficiently uses space for comparing values across many categories.
// anyplot.ai
// bubble-packed: Basic Packed Bubble Chart
// Library: highcharts 12.6.0 | JavaScript 22.23.2
// Quality: 88/100 | Created: 2026-08-24
//# anyplot-orientation: square

const t = window.ANYPLOT_TOKENS;

// --- Data (in-memory, deterministic LCG) ------------------------------------
// Monthly cloud infrastructure spend by service, grouped by owning team.
let seed = 42;
function rand() {
  seed = (seed * 1103515245 + 12345) & 0x7fffffff;
  return seed / 0x7fffffff;
}

const GROUPS = ["Platform", "Data", "Growth", "Security"];
const ITEMS = [
  { label: "Compute", value: 210, group: "Platform" },
  { label: "Storage", value: 165, group: "Platform" },
  { label: "Networking", value: 98, group: "Platform" },
  { label: "Load Balancer", value: 54, group: "Platform" },
  { label: "CDN", value: 72, group: "Platform" },
  { label: "Registry", value: 31, group: "Platform" },
  { label: "Warehouse", value: 188, group: "Data" },
  { label: "ETL Pipeline", value: 124, group: "Data" },
  { label: "Data Lake", value: 96, group: "Data" },
  { label: "Streaming", value: 58, group: "Data" },
  { label: "Backups", value: 42, group: "Data" },
  { label: "Cache", value: 27, group: "Data" },
  { label: "Analytics", value: 143, group: "Growth" },
  { label: "Marketing Auto.", value: 82, group: "Growth" },
  { label: "A/B Testing", value: 67, group: "Growth" },
  { label: "Personalization", value: 55, group: "Growth" },
  { label: "Notifications", value: 38, group: "Growth" },
  { label: "Experiments", value: 24, group: "Growth" },
  { label: "Identity & Access", value: 112, group: "Security" },
  { label: "Secrets Manager", value: 45, group: "Security" },
  { label: "Threat Detection", value: 39, group: "Security" },
  { label: "Audit Logging", value: 33, group: "Security" },
  { label: "Compliance Scans", value: 28, group: "Security" },
  { label: "WAF", value: 21, group: "Security" },
];

// --- Layout: pack circles via a small force simulation -----------------------
// Radius scales with sqrt(value) so circle AREA (not radius) is proportional
// to spend, then positions relax so same-group circles nestle tightly while
// different-group circles keep a visible gap — a manual stand-in for the
// packedbubble series type, which lives in highcharts-more and isn't loaded.
const MAX_VALUE = Math.max(...ITEMS.map((d) => d.value));
const RADIUS_SCALE = 122 / Math.sqrt(MAX_VALUE);
const radiusFor = (value) => RADIUS_SCALE * Math.sqrt(value);

// Fit a data label to its circle: prefer a two-line "name + value" label,
// fall back to a single shrunk-to-fit line, then an ellipsis-truncated line,
// so text never spills past the bubble's edge regardless of radius.
const LABEL_PAD = 0.86;
const AVG_CHAR_WIDTH = 0.6;
const MIN_FONT = 9;
const MAX_FONT = 14;
function fitLabel(name, value, radius) {
  const usableWidth = radius * 2 * LABEL_PAD;
  const fits = (text, fontSize) => text.length * fontSize * AVG_CHAR_WIDTH <= usableWidth;

  let fontSize = Math.min(MAX_FONT, Math.max(MIN_FONT, Math.round(radius * 2 * 0.16)));
  const valueLine = `$${value}K`;
  const twoLineHeight = fontSize * 1.15 * 2;
  if (twoLineHeight <= usableWidth && fits(name, fontSize) && fits(valueLine, fontSize)) {
    return { text: `${name}<br/>${valueLine}`, fontSize };
  }

  while (fontSize > MIN_FONT && !fits(name, fontSize)) {
    fontSize -= 1;
  }
  if (fits(name, fontSize)) {
    return { text: name, fontSize };
  }

  const maxChars = Math.floor(usableWidth / (fontSize * AVG_CHAR_WIDTH));
  if (maxChars < 3) return null;
  return { text: `${name.slice(0, maxChars - 1)}…`, fontSize };
}

const GROUP_START_RADIUS = 220;
const nodes = ITEMS.map((item) => {
  const groupIndex = GROUPS.indexOf(item.group);
  const theta = Math.PI / 4 + groupIndex * (Math.PI / 2);
  const cx = GROUP_START_RADIUS * Math.cos(theta);
  const cy = GROUP_START_RADIUS * Math.sin(theta);
  const r = radiusFor(item.value);
  return {
    ...item,
    groupIndex,
    r,
    labelPlan: fitLabel(item.label, item.value, r),
    x: cx + (rand() - 0.5) * 160,
    y: cy + (rand() - 0.5) * 160,
  };
});

const ITERATIONS = 480;
const GROUP_PULL = 0.04;
const CENTER_PULL = 0.006;
const SAME_GROUP_GAP = 4;
const DIFF_GROUP_GAP = 22;

for (let iter = 0; iter < ITERATIONS; iter += 1) {
  const centroids = GROUPS.map((_, gi) => {
    const members = nodes.filter((n) => n.groupIndex === gi);
    const sx = members.reduce((s, n) => s + n.x, 0) / members.length;
    const sy = members.reduce((s, n) => s + n.y, 0) / members.length;
    return { x: sx, y: sy };
  });

  nodes.forEach((n) => {
    const c = centroids[n.groupIndex];
    n.x += (c.x - n.x) * GROUP_PULL;
    n.y += (c.y - n.y) * GROUP_PULL;
    n.x += (0 - n.x) * CENTER_PULL;
    n.y += (0 - n.y) * CENTER_PULL;
  });

  for (let pass = 0; pass < 3; pass += 1) {
    for (let i = 0; i < nodes.length; i += 1) {
      for (let j = i + 1; j < nodes.length; j += 1) {
        const a = nodes[i];
        const b = nodes[j];
        let dx = b.x - a.x;
        let dy = b.y - a.y;
        let dist = Math.sqrt(dx * dx + dy * dy);
        if (dist < 1e-3) {
          dx = (rand() - 0.5) * 0.5;
          dy = (rand() - 0.5) * 0.5;
          dist = Math.sqrt(dx * dx + dy * dy) || 1e-3;
        }
        const gap = a.groupIndex === b.groupIndex ? SAME_GROUP_GAP : DIFF_GROUP_GAP;
        const minDist = a.r + b.r + gap;
        if (dist < minDist) {
          const overlap = (minDist - dist) / 2;
          const ux = dx / dist;
          const uy = dy / dist;
          a.x -= ux * overlap;
          a.y -= uy * overlap;
          b.x += ux * overlap;
          b.y += uy * overlap;
        }
      }
    }
  }
}

// Center the packed cluster on the origin using its true bounding box.
const minX = Math.min(...nodes.map((n) => n.x - n.r));
const maxX = Math.max(...nodes.map((n) => n.x + n.r));
const minY = Math.min(...nodes.map((n) => n.y - n.r));
const maxY = Math.max(...nodes.map((n) => n.y + n.r));
const offsetX = (minX + maxX) / 2;
const offsetY = (minY + maxY) / 2;
nodes.forEach((n) => {
  n.x -= offsetX;
  n.y -= offsetY;
});
const clusterWidth = maxX - minX;
const clusterHeight = maxY - minY;

// --- Chart -------------------------------------------------------------------
// Position carries no meaning here — only size (area = spend) and color
// (team) do. Core bundle has no packedbubble series (that lives in a module
// that isn't loaded), so the pack above feeds plain "scatter" points with a
// per-point marker.radius, one series per group for a clean color legend.
const series = GROUPS.map((group, gi) => ({
  name: group,
  type: "scatter",
  color: t.palette[gi],
  data: nodes
    .filter((n) => n.groupIndex === gi)
    .map((n) => ({
      x: n.x,
      y: n.y,
      name: n.label,
      marker: { radius: n.r },
      custom: { value: n.value, radius: n.r },
      dataLabels: n.labelPlan
        ? { enabled: true, format: n.labelPlan.text, style: { fontSize: `${n.labelPlan.fontSize}px` } }
        : { enabled: false },
    })),
}));

Highcharts.chart(
  "container",
  {
    chart: {
      type: "scatter",
      backgroundColor: "transparent",
      animation: false,
      style: { fontFamily: "inherit" },
    },
    credits: { enabled: false },
    colors: t.palette,
    title: {
      text: "bubble-packed · javascript · highcharts · anyplot.ai",
      style: { color: t.ink, fontSize: "22px", fontWeight: "600" },
    },
    subtitle: {
      text: "Monthly cloud spend by service ($K) — circle area = spend, color = team",
      style: { color: t.inkSoft, fontSize: "14px" },
    },
    xAxis: { visible: false },
    yAxis: { visible: false },
    legend: {
      enabled: true,
      layout: "horizontal",
      align: "center",
      verticalAlign: "bottom",
      itemStyle: { color: t.inkSoft, fontSize: "14px" },
      itemHoverStyle: { color: t.ink },
    },
    tooltip: {
      useHTML: true,
      backgroundColor: t.elevatedBg,
      borderColor: t.grid,
      style: { color: t.ink, fontSize: "13px" },
      pointFormatter: function pointFormatter() {
        const swatch =
          `<span style="display:inline-block;width:9px;height:9px;border-radius:50%;` +
          `background:${this.color};margin-right:5px;"></span>`;
        return (
          `<b>${this.name}</b><br/>${swatch}${this.series.name}<br/>` + `$${this.custom.value}K / month`
        );
      },
    },
    plotOptions: {
      series: {
        animation: false,
        marker: {
          symbol: "circle",
          lineColor: t.pageBg,
          lineWidth: 2,
          states: { hover: { lineWidthPlus: 2 } },
        },
        dataLabels: {
          style: { color: "contrast", textOutline: "1px contrast", fontWeight: "600" },
        },
      },
    },
    series,
  },
  function onLoad(chart) {
    // marker.radius is fixed CSS px regardless of axis scale, so spacing may
    // only ever be spread OUT (scale >= 1) to use the plot area — shrinking
    // (scale < 1) would pull circle centers closer than their fixed radii
    // and create real overlaps. The pack was sized to comfortably undershoot
    // the plot area, so the fitted scale below is expected to land above 1.
    const fitScale = Math.min(chart.plotWidth / clusterWidth, chart.plotHeight / clusterHeight);
    const scale = Math.max(1, fitScale * 0.97);
    const halfW = chart.plotWidth / (2 * scale);
    const halfH = chart.plotHeight / (2 * scale);
    chart.xAxis[0].setExtremes(-halfW, halfW, false);
    chart.yAxis[0].setExtremes(-halfH, halfH, true);
  },
);
Runnable source as JSON, for any HTTP client: https://api.anyplot.ai/specs/bubble-packed/highcharts/code. Any spec id and library id listed in llms-full.txt fit the same URL shape; every URL below is complete and callable.
{
  "spec_id": "bubble-packed",
  "language": "javascript",
  "library": "highcharts",
  "page": "https://anyplot.ai/bubble-packed/javascript/highcharts",
  "hub": "https://anyplot.ai/bubble-packed",
  "code_json": "https://api.anyplot.ai/specs/bubble-packed/highcharts/code",
  "spec_json": "https://api.anyplot.ai/specs/bubble-packed",
  "render_light_png": "https://storage.googleapis.com/anyplot-images/plots/bubble-packed/javascript/highcharts/plot-light.png",
  "render_dark_png": "https://storage.googleapis.com/anyplot-images/plots/bubble-packed/javascript/highcharts/plot-dark.png",
  "interactive_light_html": "https://storage.googleapis.com/anyplot-images/plots/bubble-packed/javascript/highcharts/plot-light.html",
  "interactive_dark_html": "https://storage.googleapis.com/anyplot-images/plots/bubble-packed/javascript/highcharts/plot-dark.html",
  "quality_score": 88.0,
  "license": "MIT",
  "guide": "https://anyplot.ai/llms.txt"
}
Part of Basic Packed Bubble Chart on anyplot.ai.