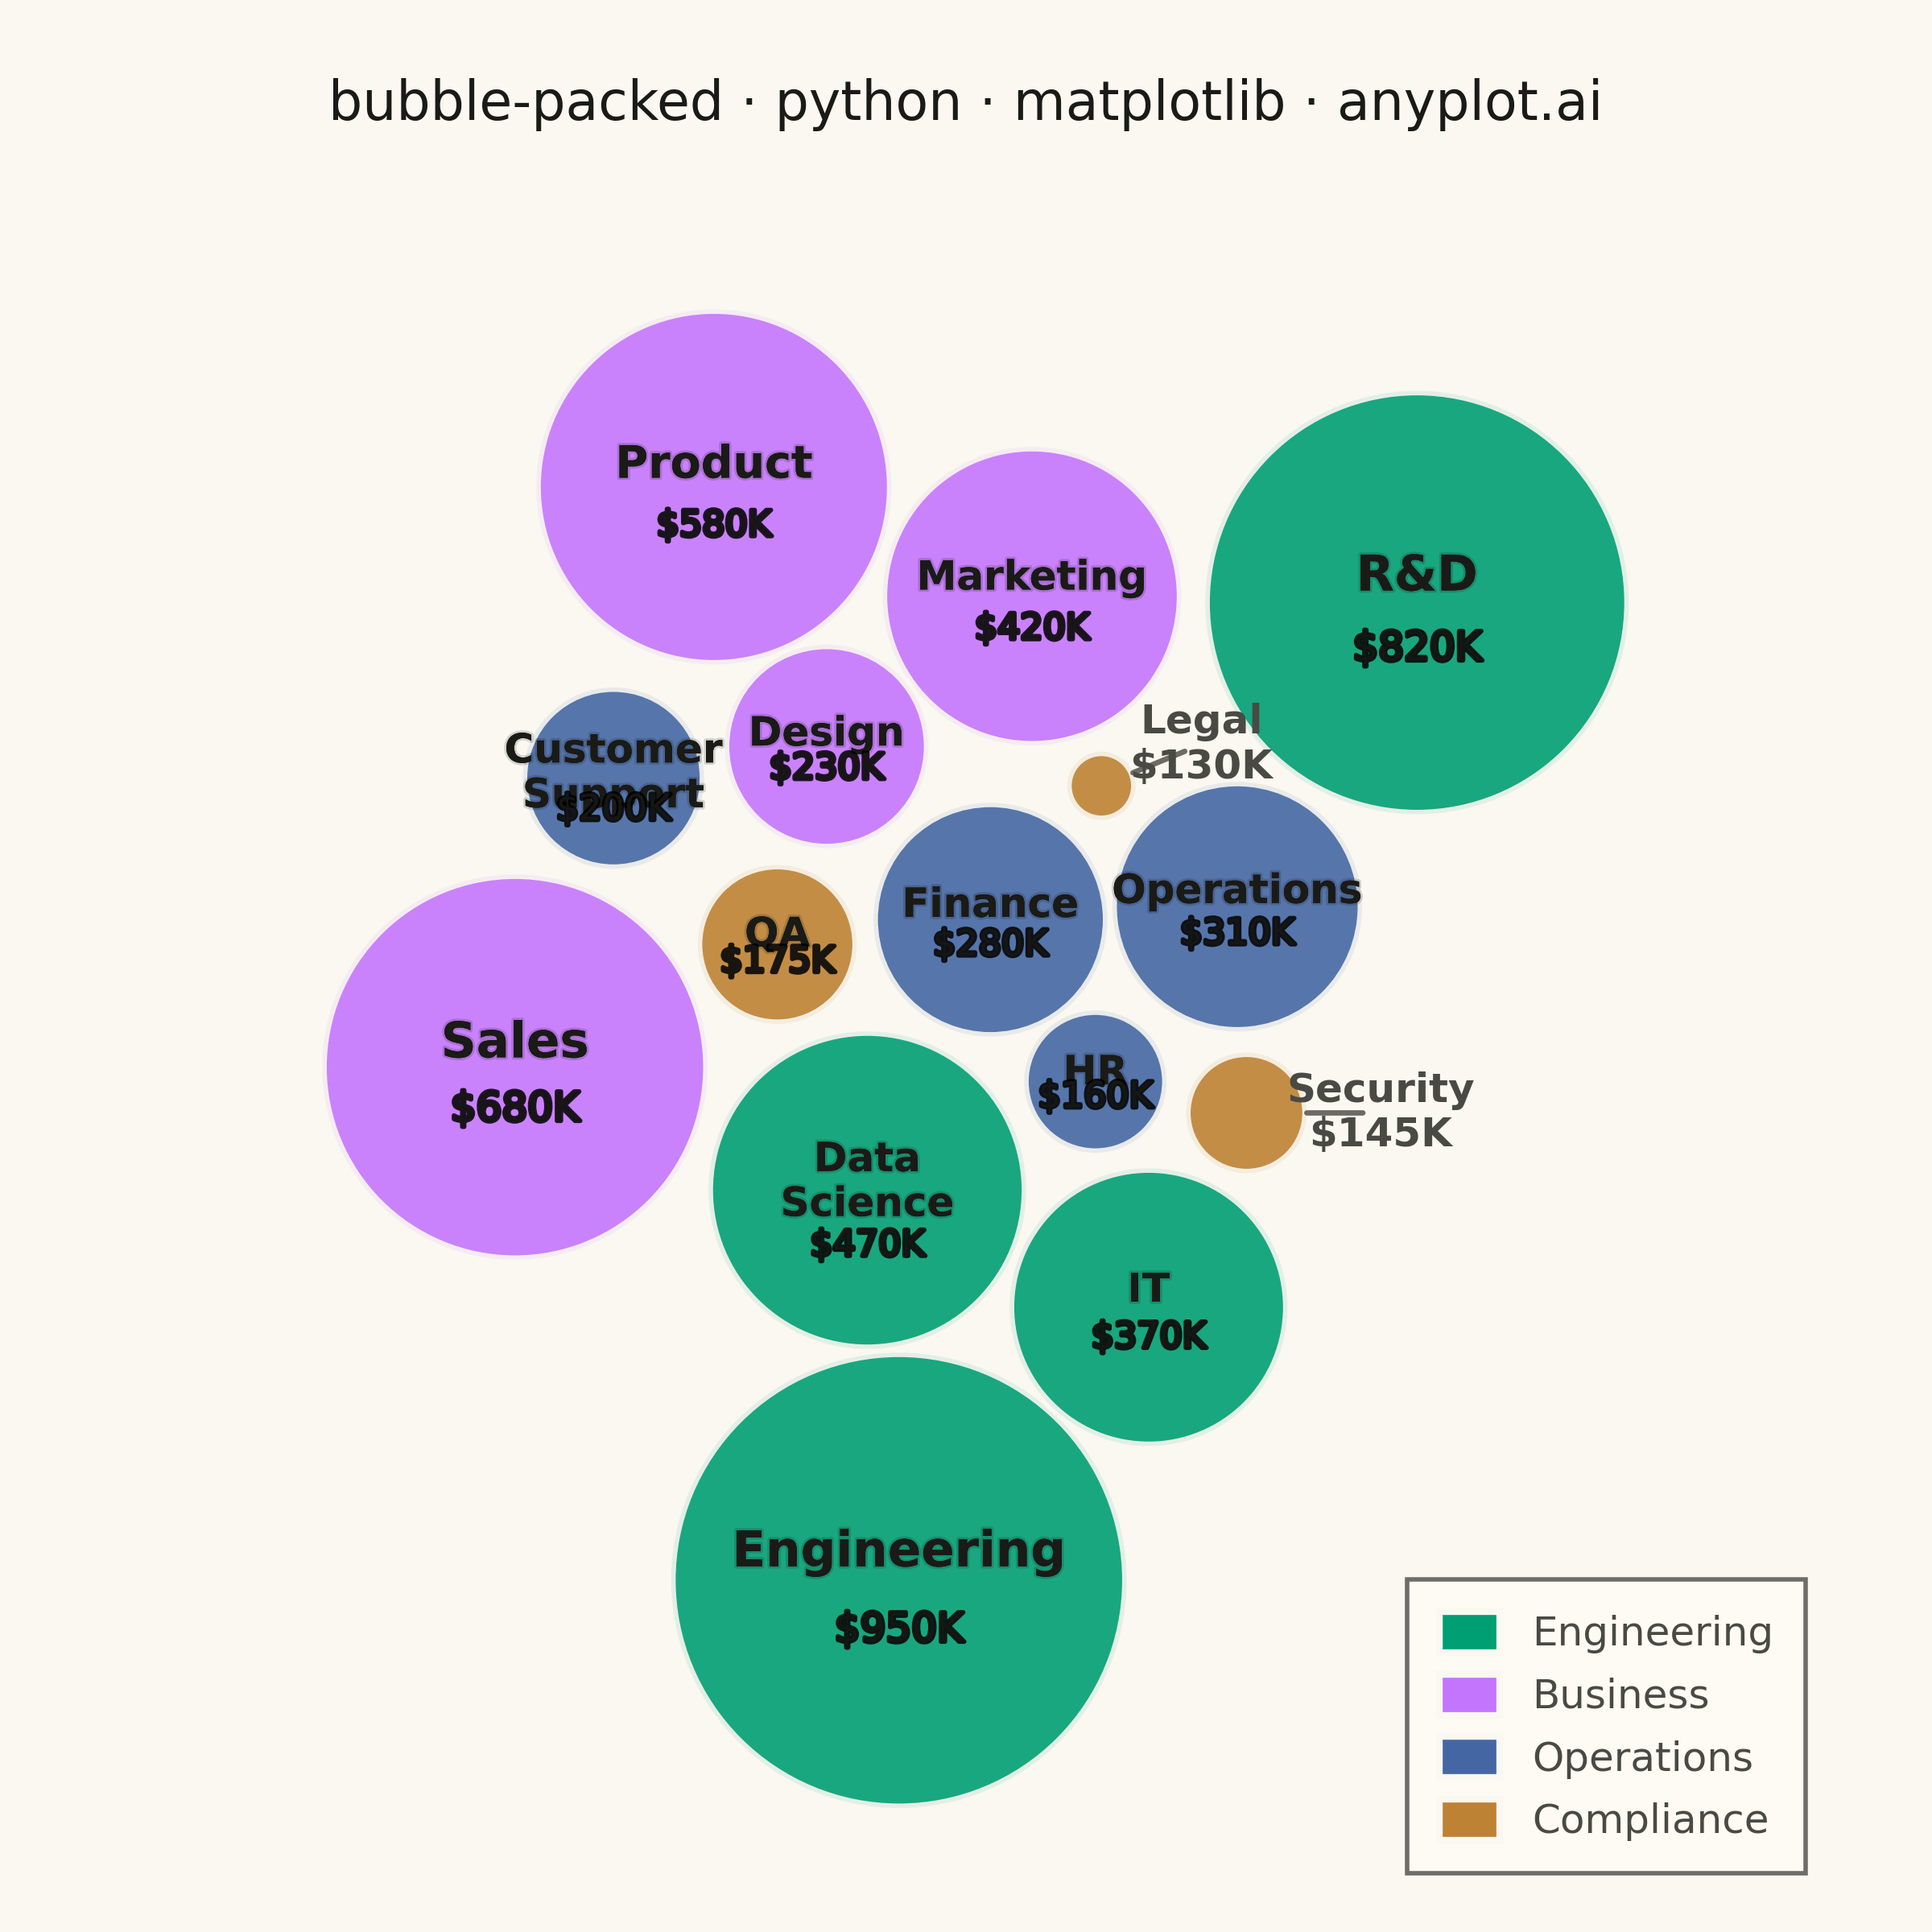
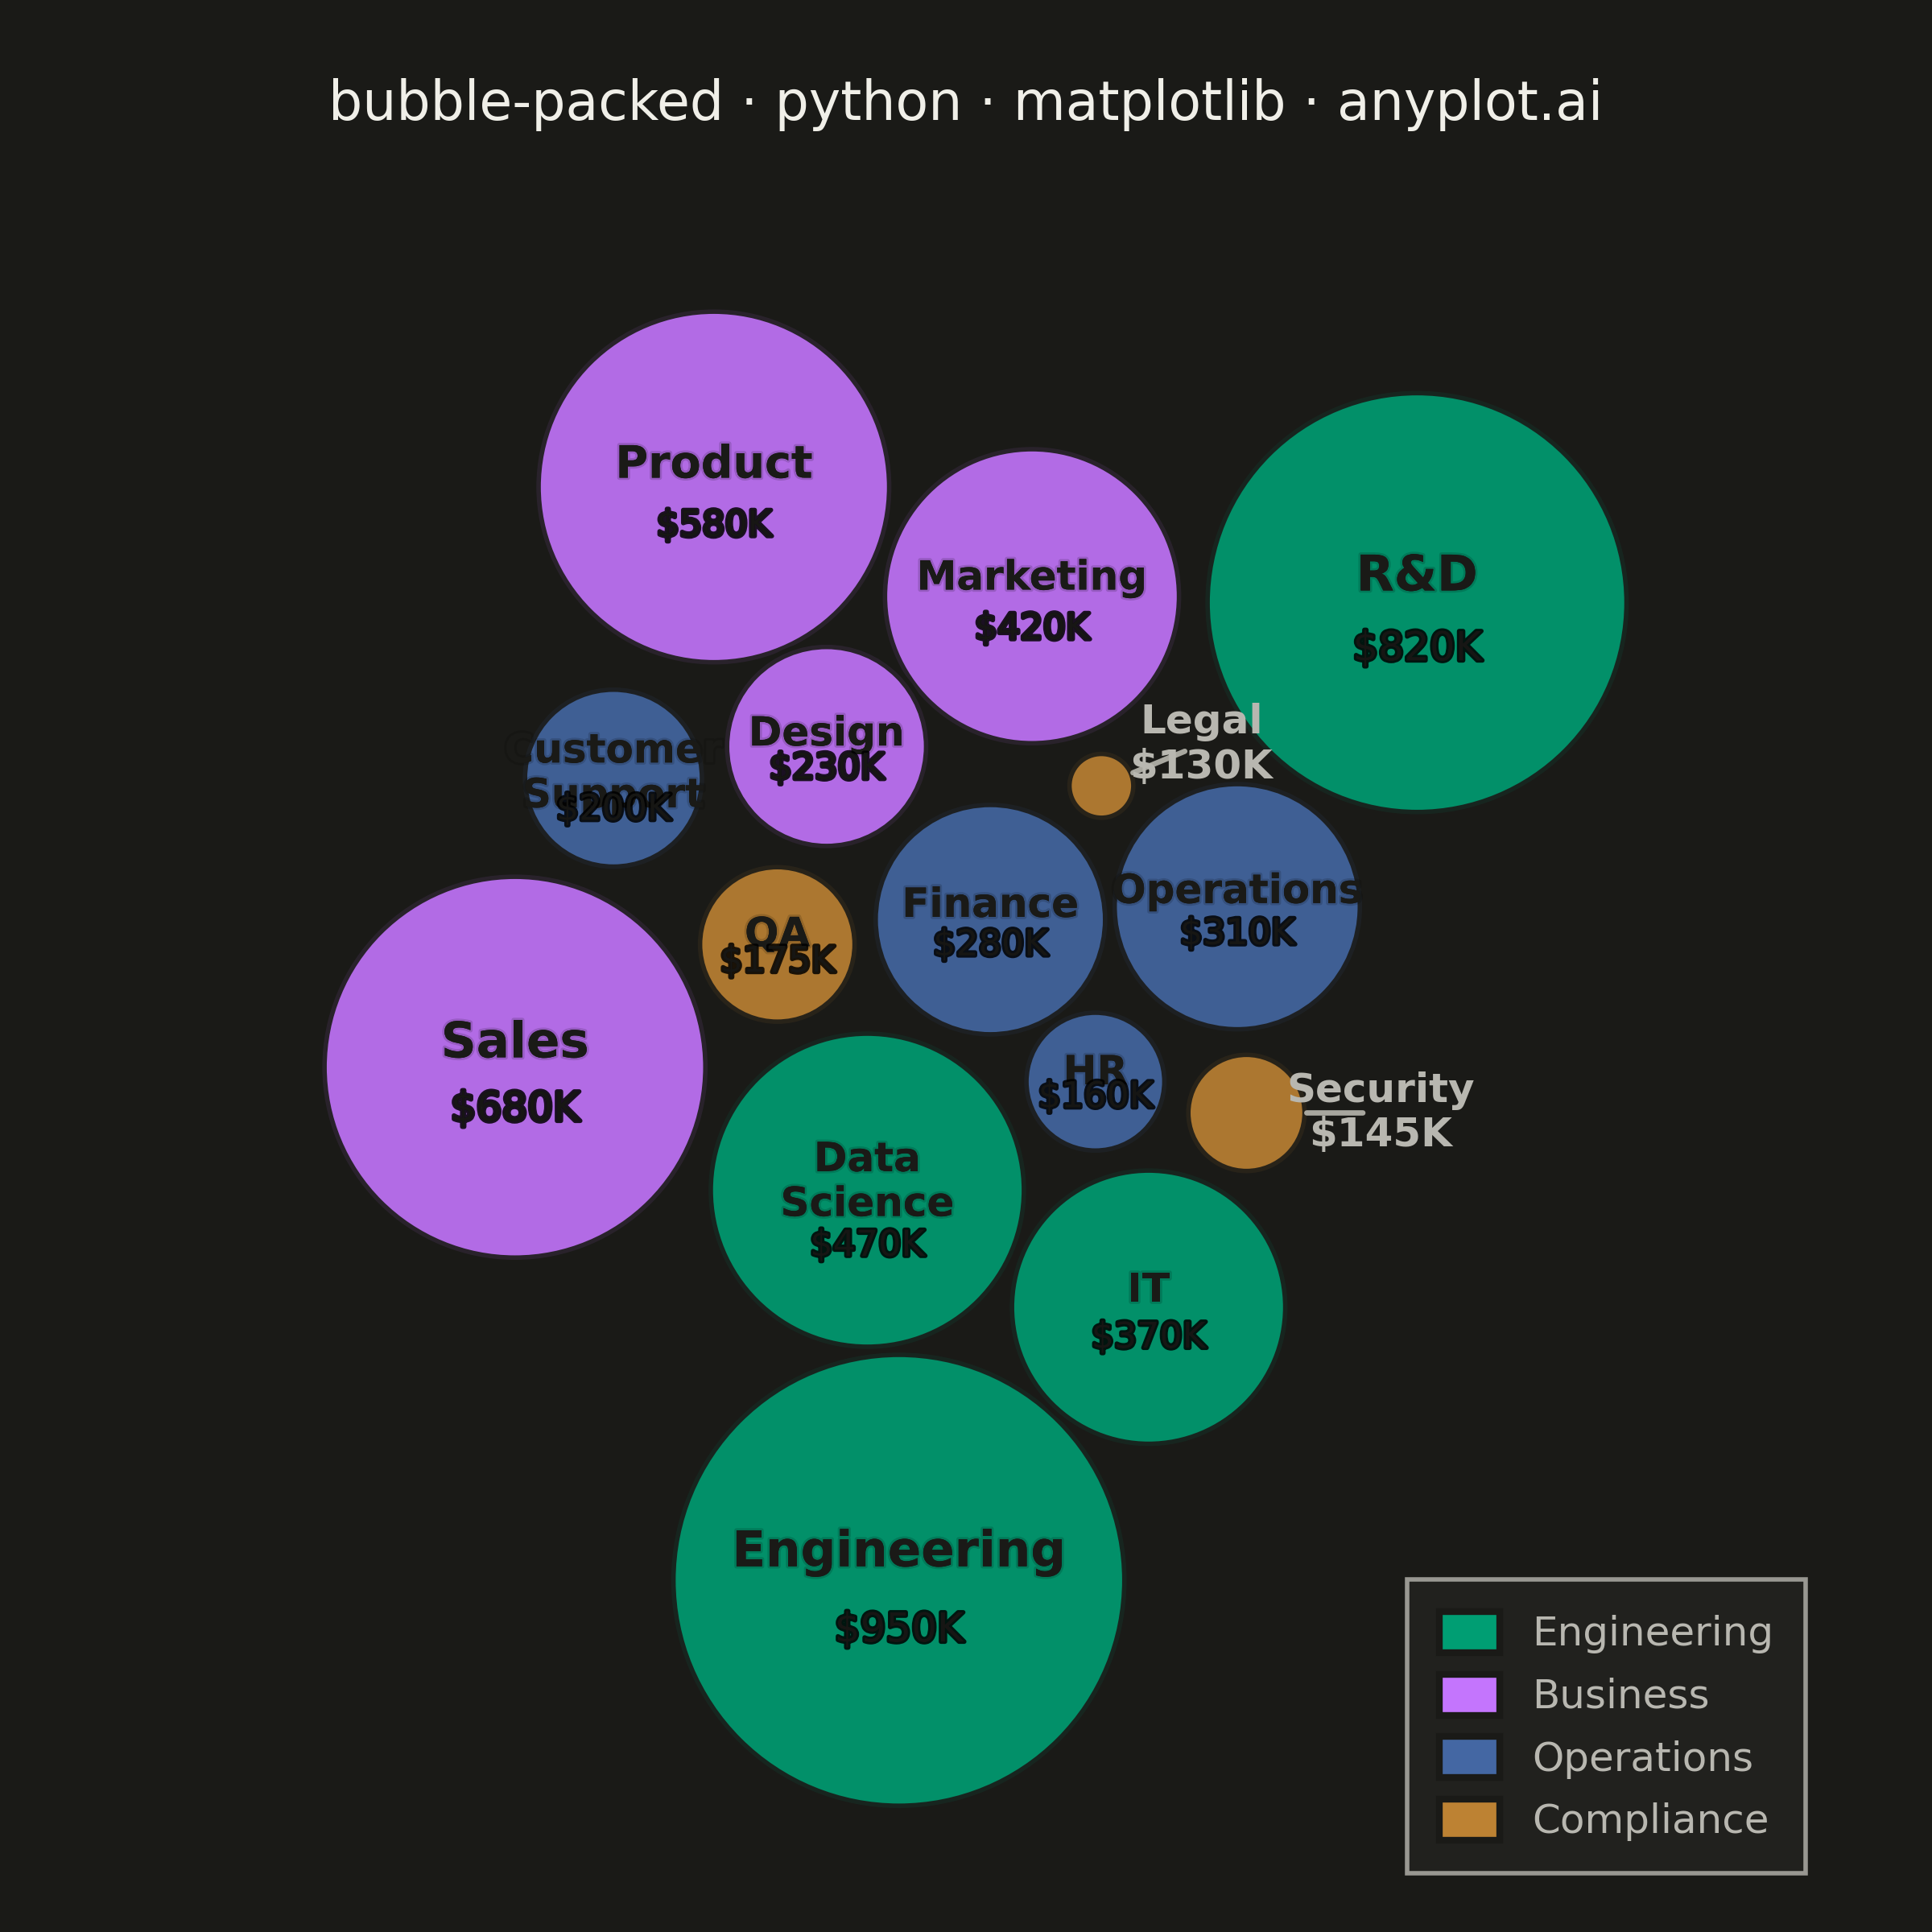
A packed bubble chart displays data as circles where size represents value, and circles are packed together without overlap using physics simulation. Unlike scatter or traditional bubble charts, position has no meaning - only size and optional grouping matter. This visualization efficiently uses space for comparing values across many categories.
""" anyplot.ai
bubble-packed: Basic Packed Bubble Chart
Library: matplotlib 3.10.9 | Python 3.13.13
Quality: 85/100 | Updated: 2026-05-29
"""

import os

import matplotlib.collections as mcoll
import matplotlib.patches as mpatches
import matplotlib.patheffects as pe
import matplotlib.pyplot as plt
import numpy as np


# Theme tokens — Imprint palette, theme-adaptive chrome
THEME = os.getenv("ANYPLOT_THEME", "light")
PAGE_BG = "#FAF8F1" if THEME == "light" else "#1A1A17"
ELEVATED_BG = "#FFFDF6" if THEME == "light" else "#242420"
INK = "#1A1A17" if THEME == "light" else "#F0EFE8"
INK_SOFT = "#4A4A44" if THEME == "light" else "#B8B7B0"
INK_MUTED = "#6B6A63" if THEME == "light" else "#A8A79F"

# Imprint palette — 8 hues, canonical order
IMPRINT_PALETTE = ["#009E73", "#C475FD", "#4467A3", "#BD8233", "#AE3030", "#2ABCCD", "#954477", "#99B314"]

# Data — department budget allocation (in thousands USD)
labels = [
    "Engineering",
    "Marketing",
    "Sales",
    "Operations",
    "HR",
    "Finance",
    "R&D",
    "Customer Support",
    "Legal",
    "IT",
    "Design",
    "Product",
    "Data Science",
    "Security",
    "QA",
]
values = [950, 420, 680, 310, 160, 280, 820, 200, 130, 370, 230, 580, 470, 145, 175]

# Group assignments — organizational structure
group_map = {
    "Engineering": "Engineering",
    "IT": "Engineering",
    "Data Science": "Engineering",
    "R&D": "Engineering",
    "Marketing": "Business",
    "Sales": "Business",
    "Product": "Business",
    "Design": "Business",
    "Operations": "Operations",
    "HR": "Operations",
    "Finance": "Operations",
    "Customer Support": "Operations",
    "Legal": "Compliance",
    "Security": "Compliance",
    "QA": "Compliance",
}

# Groups mapped to first 4 Imprint palette positions (canonical order)
group_order = ["Engineering", "Business", "Operations", "Compliance"]
group_colors = {g: IMPRINT_PALETTE[i] for i, g in enumerate(group_order)}
colors = [group_colors[group_map[label]] for label in labels]

# Scale values to radius (sqrt for area-proportional sizing)
min_radius = 0.30
max_radius = 2.0
values_array = np.array(values, dtype=float)
radii = min_radius + (max_radius - min_radius) * np.sqrt(
    (values_array - values_array.min()) / (values_array.max() - values_array.min())
)

# Sort by size (largest first) for better packing
n = len(labels)
order = np.argsort(-radii)
radii_sorted = radii[order]
labels_sorted = [labels[i] for i in order]
values_sorted = [values[i] for i in order]
colors_sorted = [colors[i] for i in order]
groups_sorted = [group_map[labels[i]] for i in order]

unique_groups = group_order
group_ids = np.array([unique_groups.index(g) for g in groups_sorted])

# Initial positions in spiral pattern for tighter convergence
angles = np.linspace(0, 4 * np.pi, n)
spiral_r = np.linspace(0, 3, n)
positions = np.column_stack([spiral_r * np.cos(angles), spiral_r * np.sin(angles)])

# Physics simulation with group-aware clustering
for iteration in range(500):
    progress = iteration / 500
    pull_strength = 0.06 * (1 - progress * 0.8)
    group_pull = 0.04 * (1 - progress * 0.5)

    group_centers = {}
    for gid in range(len(unique_groups)):
        mask = group_ids == gid
        if np.any(mask):
            group_centers[gid] = positions[mask].mean(axis=0)

    for i in range(n):
        dist = np.linalg.norm(positions[i])
        if dist > 0.01:
            positions[i] -= pull_strength * positions[i] / dist
        gc = group_centers[group_ids[i]]
        to_group = gc - positions[i]
        gd = np.linalg.norm(to_group)
        if gd > 0.01:
            positions[i] += group_pull * to_group / gd

    for i in range(n):
        for j in range(i + 1, n):
            delta = positions[j] - positions[i]
            dist = np.linalg.norm(delta)
            same_group = group_ids[i] == group_ids[j]
            gap = 0.06 if same_group else 0.20
            min_dist = radii_sorted[i] + radii_sorted[j] + gap
            if dist < min_dist and dist > 0.001:
                overlap = (min_dist - dist) / 2
                direction = delta / dist
                positions[i] -= overlap * direction
                positions[j] += overlap * direction

# Center the layout
bbox_min = positions.min(axis=0) - radii_sorted.max()
bbox_max = positions.max(axis=0) + radii_sorted.max()
positions -= (bbox_min + bbox_max) / 2

# Plot — square canvas for symmetric bubble chart (2400×2400 px at 400 dpi)
fig, ax = plt.subplots(figsize=(6, 6), dpi=400, facecolor=PAGE_BG)
ax.set_facecolor(PAGE_BG)

# Draw circles with PatchCollection for efficient batch rendering
circles = [mpatches.Circle((positions[i, 0], positions[i, 1]), radii_sorted[i]) for i in range(n)]
collection = mcoll.PatchCollection(
    circles, facecolors=colors_sorted, edgecolors=PAGE_BG, linewidths=2.0, alpha=0.90, zorder=2
)
ax.add_collection(collection)

# Labels inside circles (if large enough)
small_circles = []
for i in range(n):
    label_chars = len(labels_sorted[i])
    min_r_for_label = 0.48 + label_chars * 0.018
    if radii_sorted[i] > min_r_for_label:
        font_scale = min(1.0, radii_sorted[i] / 1.6)
        label_fontsize = max(9, int(11 * font_scale))
        value_fontsize = max(8, int(9 * font_scale))

        # Contrast-appropriate text color (WCAG relative luminance)
        bg_hex = colors_sorted[i]
        rgb = [int(bg_hex[j : j + 2], 16) / 255 for j in (1, 3, 5)]
        luminance = 0.2126 * rgb[0] + 0.7152 * rgb[1] + 0.0722 * rgb[2]
        text_color = "#1A1A17" if luminance > 0.35 else "#F0EFE8"
        # RGBA tuples — portable across matplotlib versions
        stroke_fg = (0, 0, 0, 0.15) if luminance > 0.35 else (1, 1, 1, 0.15)
        # linewidth=1.0 at 400 dpi ≈ 6 px — crisp without garish stroke
        stroke = pe.withStroke(linewidth=1.0, foreground=stroke_fg)

        # Wrap multi-word labels to reduce horizontal text extent within the circle
        words = labels_sorted[i].split(" ")
        if len(words) > 1:
            display_label = "\n".join(words)
            label_y_offset = 0.05
            value_y_offset = -0.35
        else:
            display_label = labels_sorted[i]
            label_y_offset = 0.12
            value_y_offset = -0.22

        ax.text(
            positions[i, 0],
            positions[i, 1] + radii_sorted[i] * label_y_offset,
            display_label,
            ha="center",
            va="center",
            fontsize=label_fontsize,
            fontweight="bold",
            color=text_color,
            path_effects=[stroke],
            zorder=3,
        )
        ax.text(
            positions[i, 0],
            positions[i, 1] + radii_sorted[i] * value_y_offset,
            f"${values_sorted[i]}K",
            ha="center",
            va="center",
            fontsize=value_fontsize,
            color=text_color,
            alpha=0.85,
            path_effects=[stroke],
            zorder=3,
        )
    else:
        small_circles.append(i)

# External labels with leader lines for small circles
# Scan 16 candidate angles and pick the direction with maximum clearance from
# all other circle edges — avoids the angle-from-origin pitfall where a small
# circle near the cluster centre gets a label that points into a large neighbor.
for i in small_circles:
    cx, cy = positions[i, 0], positions[i, 1]
    r = radii_sorted[i]
    offset_dist = r + 0.65
    best_angle = np.arctan2(cy, cx)
    best_clearance = -np.inf
    for test_angle in np.linspace(0, 2 * np.pi, 16, endpoint=False):
        lx = cx + offset_dist * np.cos(test_angle)
        ly = cy + offset_dist * np.sin(test_angle)
        clearance = min(
            np.sqrt((lx - positions[j, 0]) ** 2 + (ly - positions[j, 1]) ** 2) - radii_sorted[j]
            for j in range(n)
            if j != i
        )
        if clearance > best_clearance:
            best_clearance = clearance
            best_angle = test_angle
    angle = best_angle
    lx = cx + offset_dist * np.cos(angle)
    ly = cy + offset_dist * np.sin(angle)
    ax.annotate(
        f"{labels_sorted[i]}\n${values_sorted[i]}K",
        xy=(cx + r * np.cos(angle), cy + r * np.sin(angle)),
        xytext=(lx, ly),
        fontsize=9,
        fontweight="bold",
        color=INK_SOFT,
        ha="center",
        va="center",
        arrowprops={"arrowstyle": "-", "color": INK_MUTED, "lw": 1.2, "shrinkA": 4, "shrinkB": 0},
        zorder=4,
    )

# Symmetric axis limits centered at origin
all_x, all_y = positions[:, 0], positions[:, 1]
max_r = radii_sorted.max()
half_extent = max(all_x.max() - all_x.min(), all_y.max() - all_y.min()) / 2 + max_r + 0.75
ax.set_xlim(-half_extent, half_extent)
ax.set_ylim(-half_extent, half_extent)
ax.set_aspect("equal")
ax.axis("off")

# Title
title = "bubble-packed · python · matplotlib · anyplot.ai"
title_fontsize = max(8, round(12 * 67 / len(title))) if len(title) > 67 else 12
ax.set_title(title, fontsize=title_fontsize, fontweight="medium", color=INK, pad=12)

# Legend for group colors with theme-adaptive frame
legend_handles = [
    mpatches.Patch(facecolor=color, edgecolor=PAGE_BG, linewidth=1.5, label=group)
    for group, color in group_colors.items()
]
leg = ax.legend(
    handles=legend_handles,
    loc="lower right",
    fontsize=9,
    fancybox=False,
    borderpad=0.8,
    handlelength=1.5,
    handleheight=1.2,
)
leg.get_frame().set_facecolor(ELEVATED_BG)
leg.get_frame().set_edgecolor(INK_SOFT)
plt.setp(leg.get_texts(), color=INK_SOFT)

fig.subplots_adjust(left=0.02, right=0.98, top=0.91, bottom=0.02)
plt.savefig(f"plot-{THEME}.png", dpi=400, facecolor=PAGE_BG)
Runnable source as JSON, for any HTTP client: https://api.anyplot.ai/specs/bubble-packed/matplotlib/code. Any spec id and library id listed in llms-full.txt fit the same URL shape; every URL below is complete and callable.
{
  "spec_id": "bubble-packed",
  "language": "python",
  "library": "matplotlib",
  "page": "https://anyplot.ai/bubble-packed/python/matplotlib",
  "hub": "https://anyplot.ai/bubble-packed",
  "code_json": "https://api.anyplot.ai/specs/bubble-packed/matplotlib/code",
  "spec_json": "https://api.anyplot.ai/specs/bubble-packed",
  "render_light_png": "https://storage.googleapis.com/anyplot-images/plots/bubble-packed/python/matplotlib/plot-light.png",
  "render_dark_png": "https://storage.googleapis.com/anyplot-images/plots/bubble-packed/python/matplotlib/plot-dark.png",
  "quality_score": 85.0,
  "license": "MIT",
  "guide": "https://anyplot.ai/llms.txt"
}
Part of Basic Packed Bubble Chart on anyplot.ai.