The same plot in 14 other libraries — JavaScript: Chart.js, D3.js, Apache ECharts, Highcharts; Python: Altair, Bokeh, lets-plot, Matplotlib, Plotly, plotnine, Pygal, Seaborn; R: ggplot2; Julia: Makie.jl. Compare all 15 side by side: Basic Packed Bubble Chart in Python, R, Julia and JavaScript.
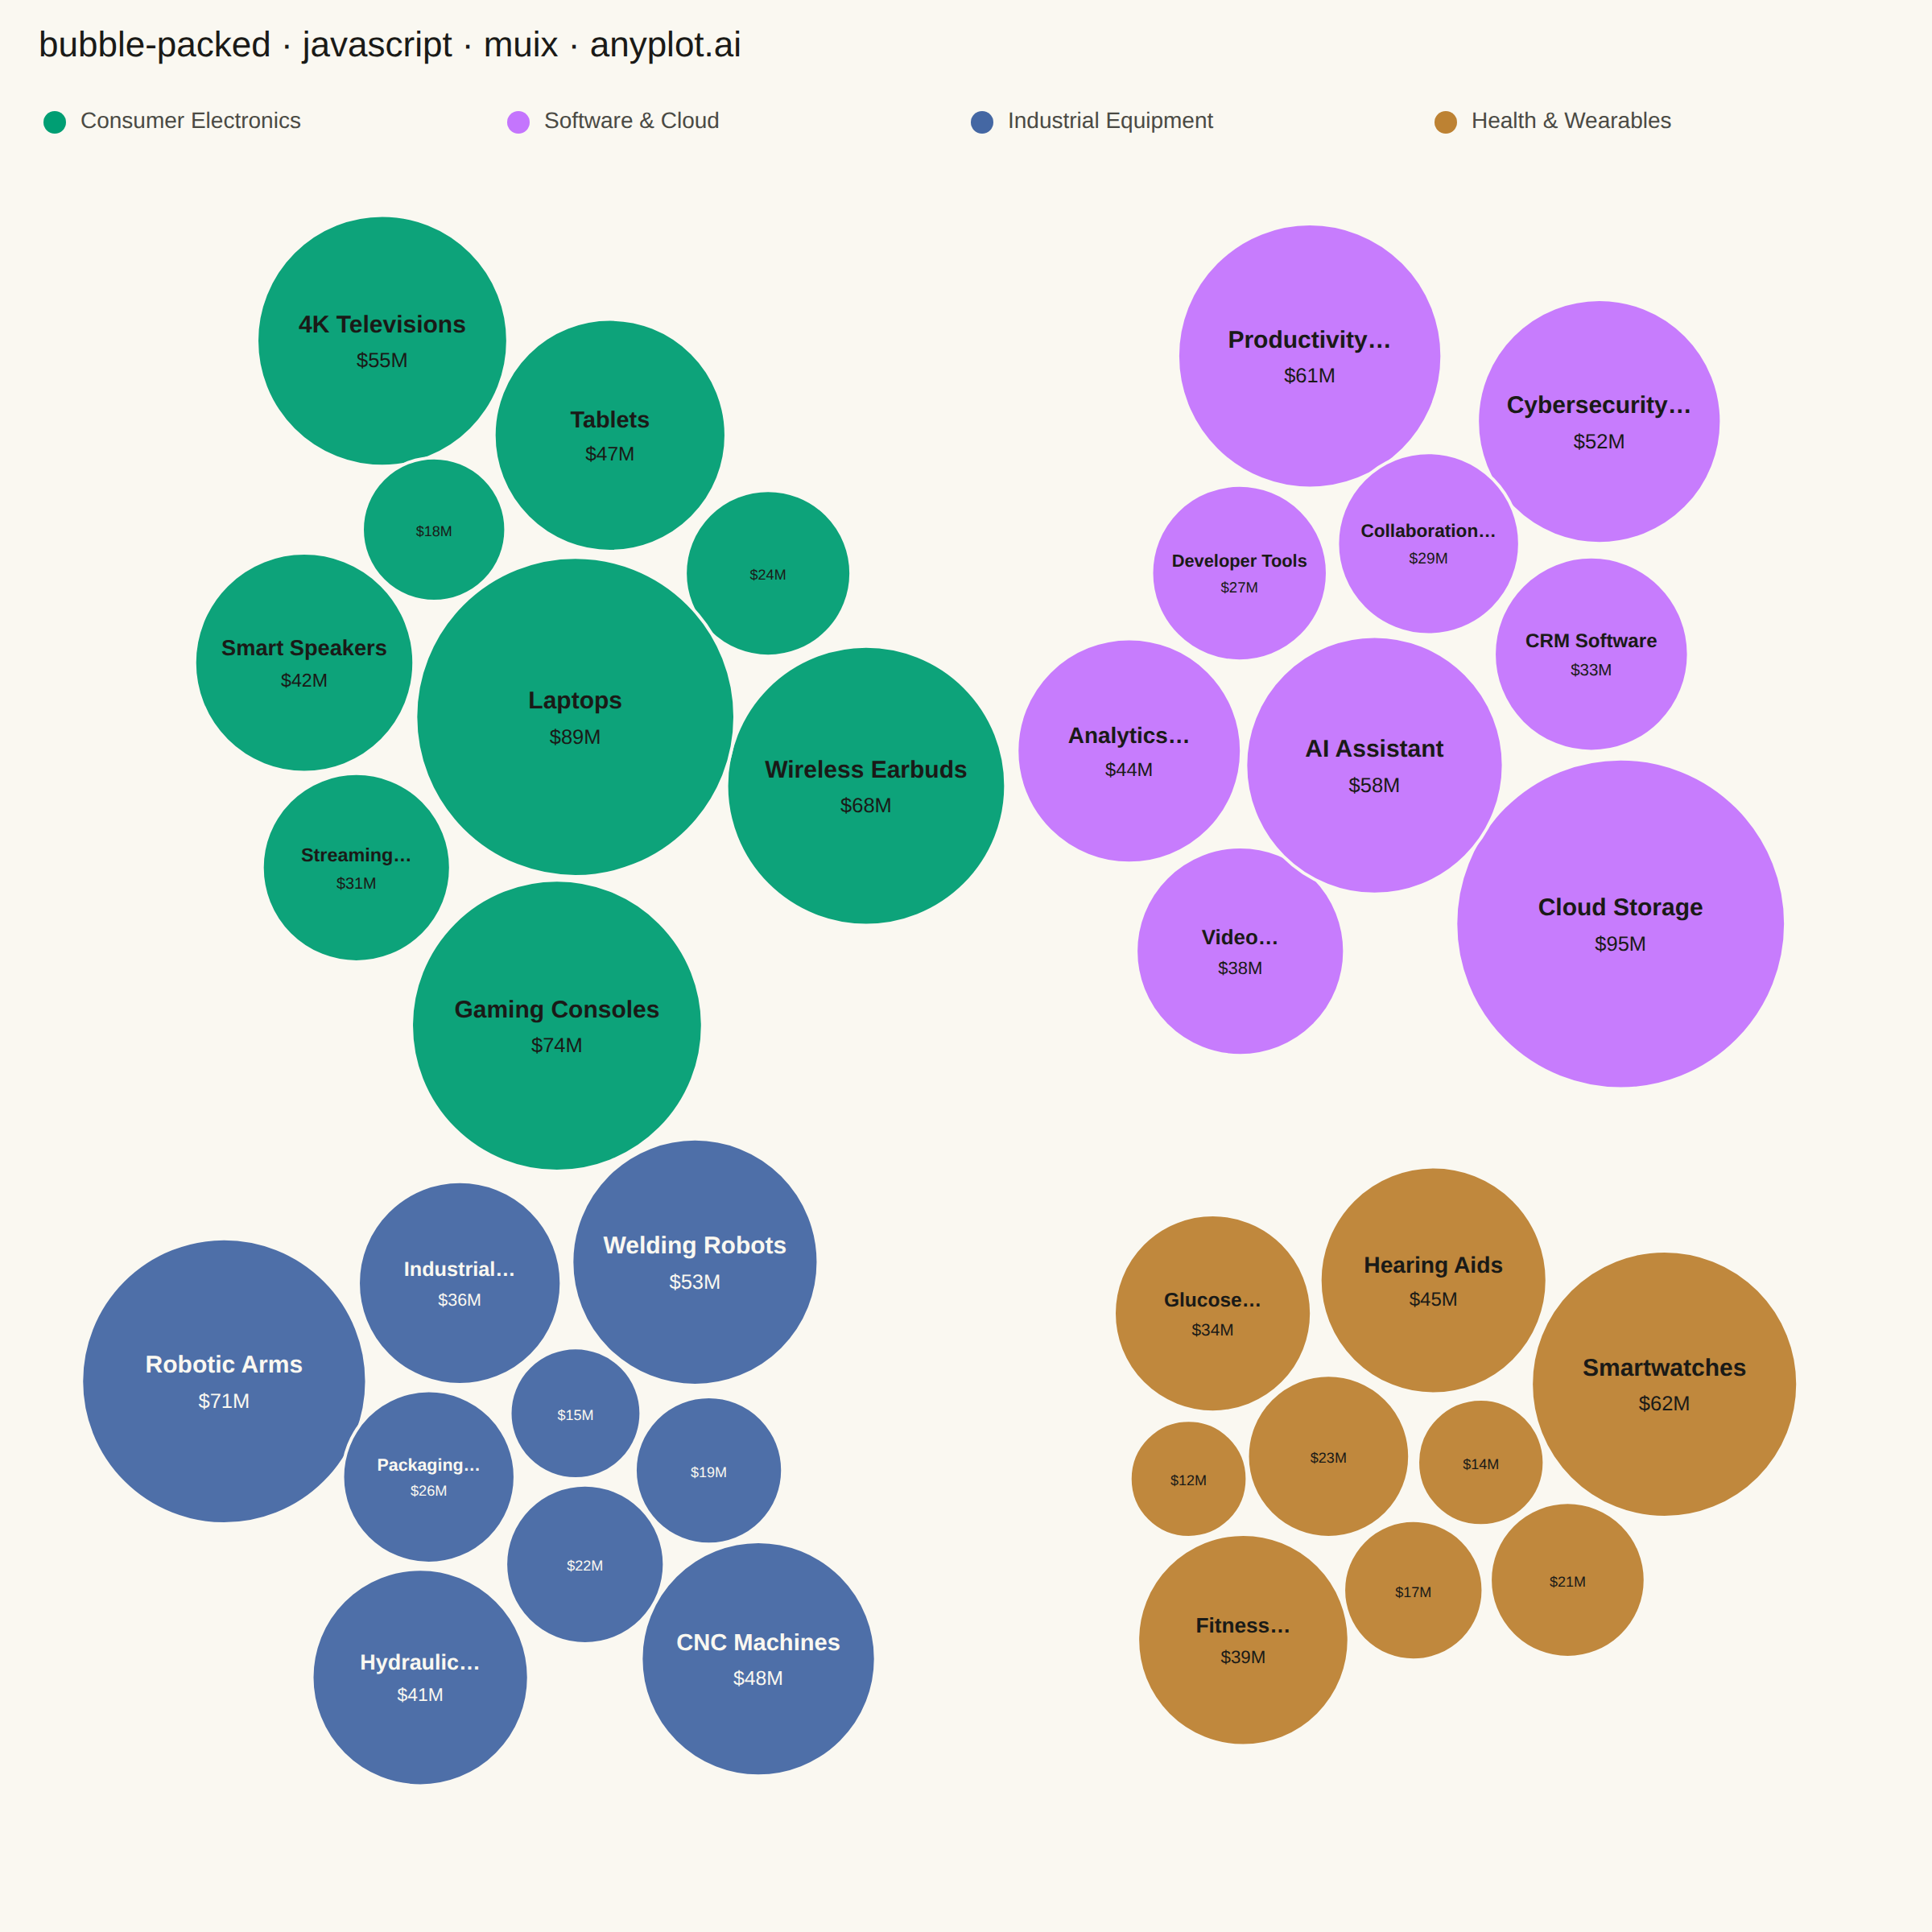
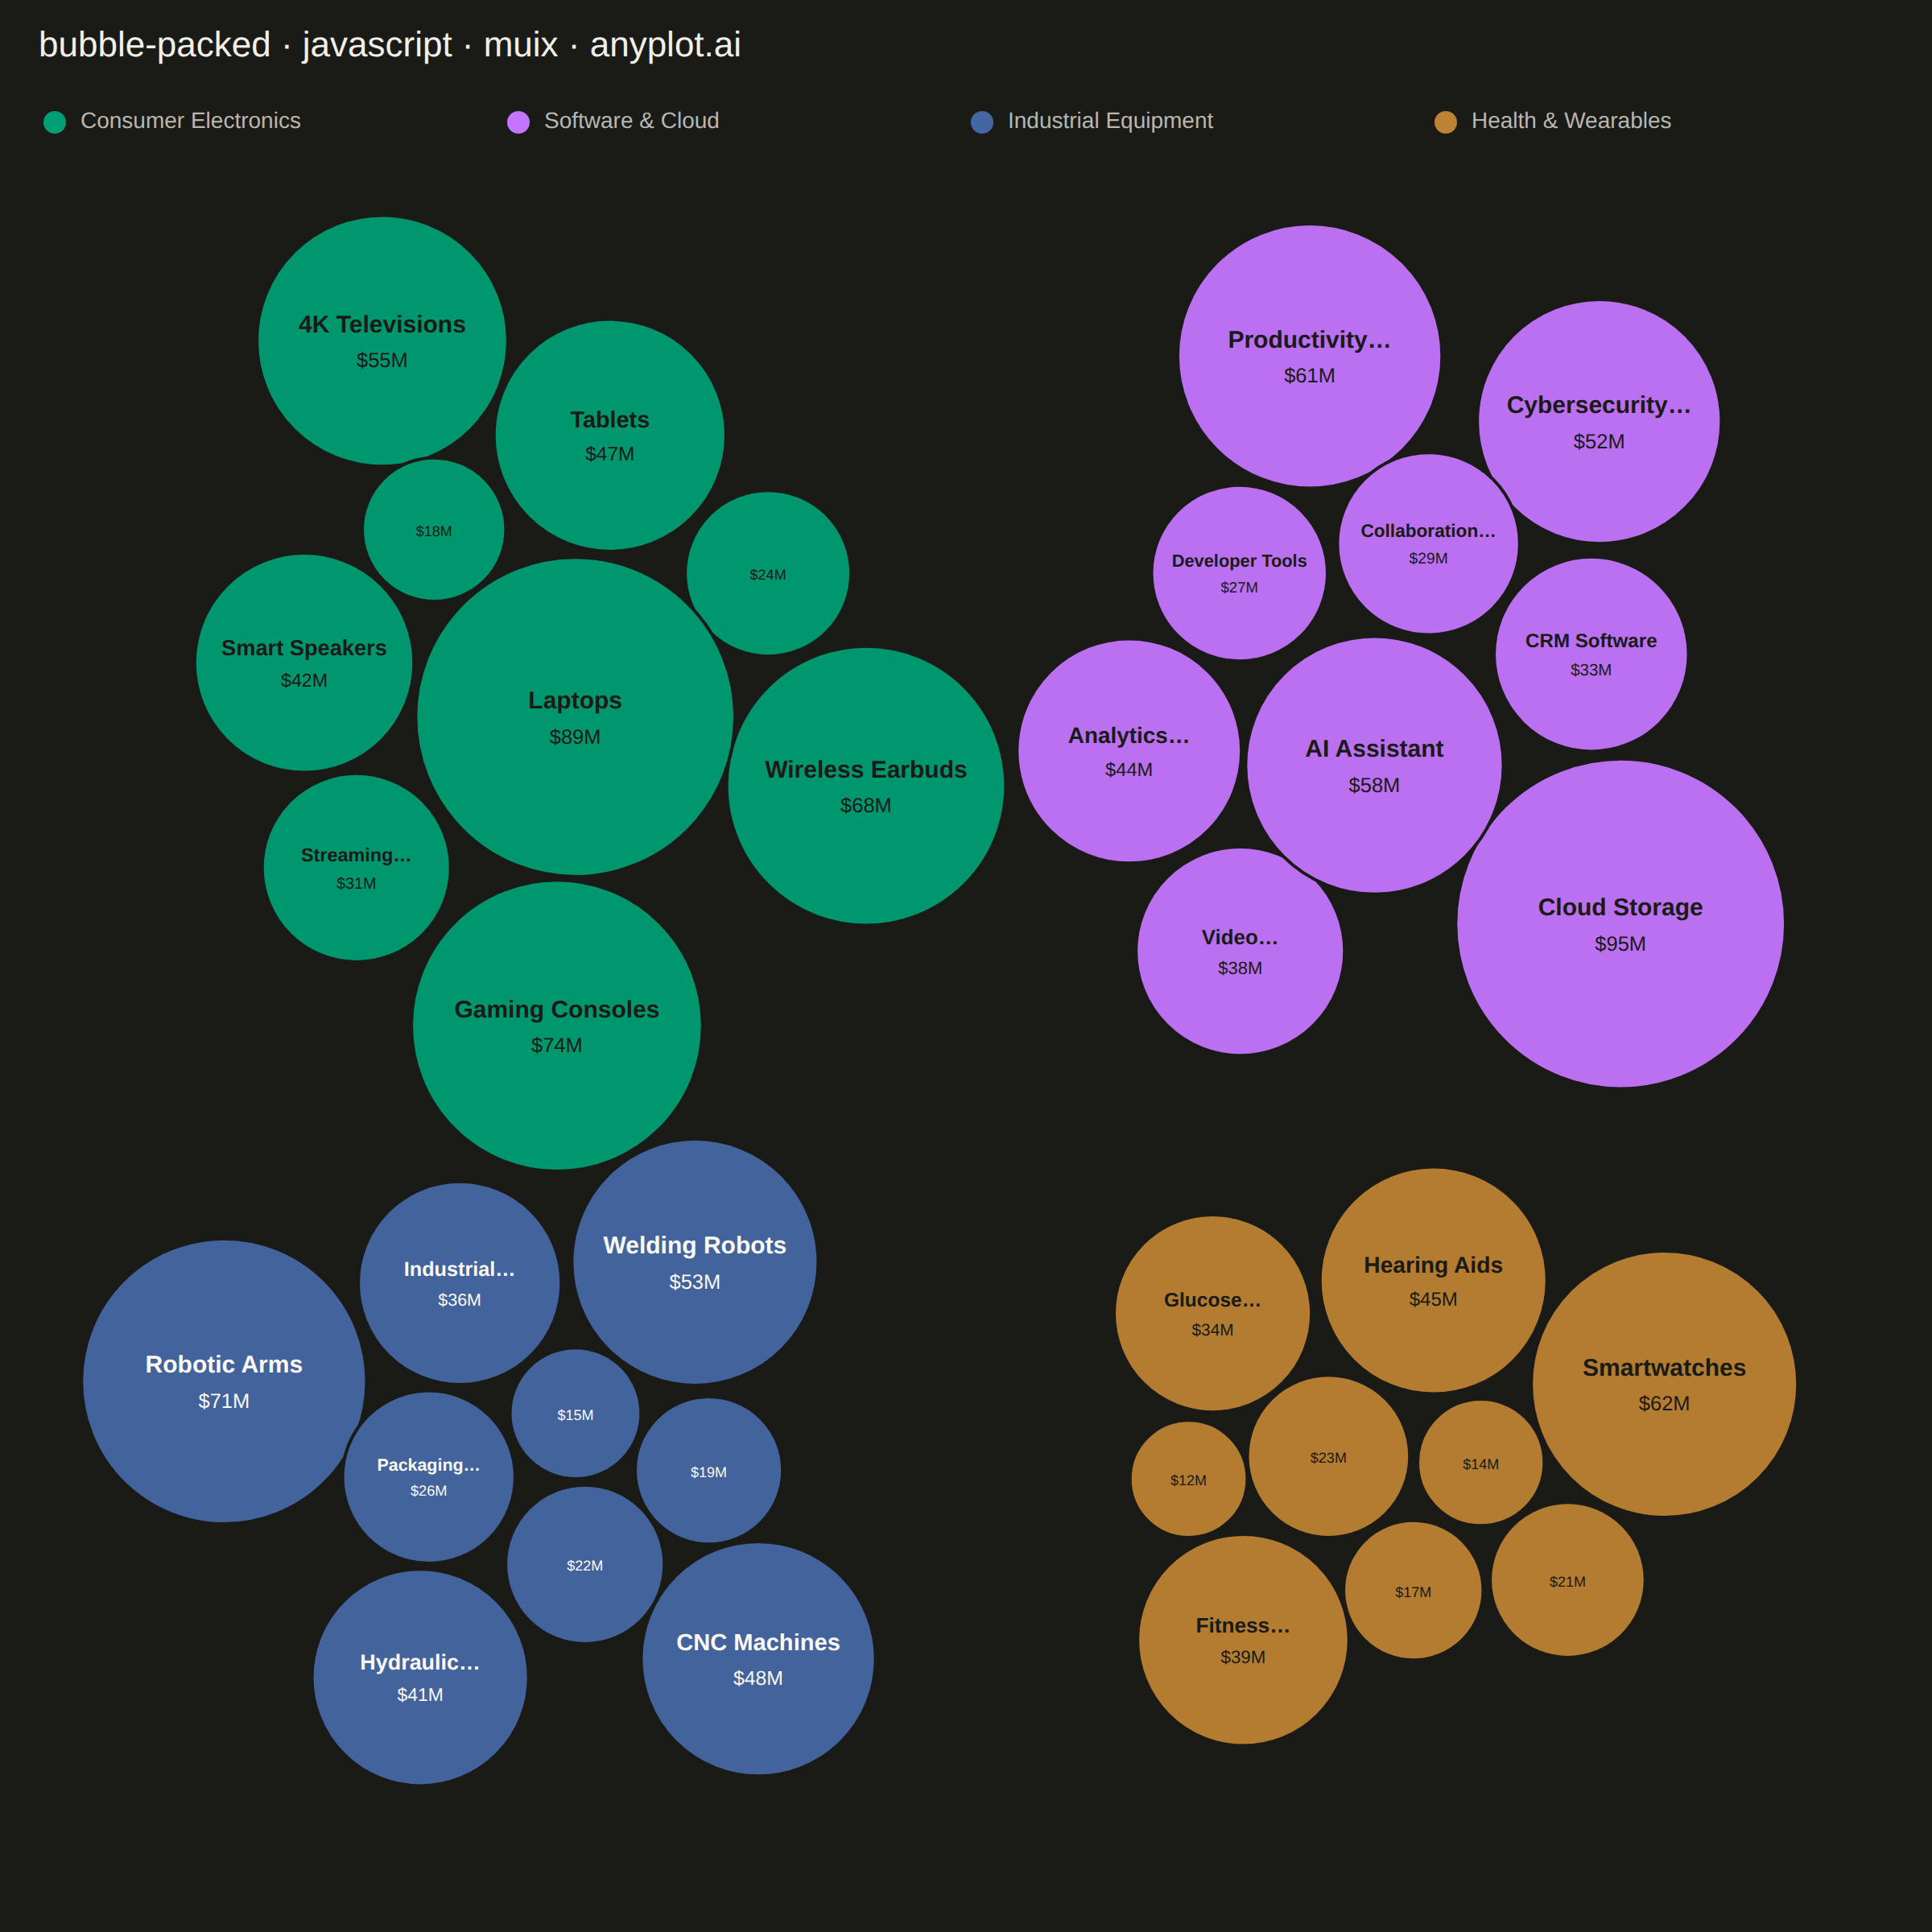
A packed bubble chart displays data as circles where size represents value, and circles are packed together without overlap using physics simulation. Unlike scatter or traditional bubble charts, position has no meaning - only size and optional grouping matter. This visualization efficiently uses space for comparing values across many categories.
// anyplot.ai
// bubble-packed: Basic Packed Bubble Chart
// Library: muix 7.29.1 | JavaScript 22.23.2
// Quality: 82/100 | Created: 2026-08-24
//# anyplot-orientation: square
// anyplot.ai
// bubble-packed: Basic Packed Bubble Chart
// Library: MUI X Charts | React | Node 22
// License: @mui/x-charts — MIT (community). Pro/Premium are out of scope.
// Quality: 79/100 | Created: 2026-08-24
import { ChartContainer } from "@mui/x-charts/ChartContainer";

const t = window.ANYPLOT_TOKENS;
const { width: SIZE_W, height: SIZE_H } = window.ANYPLOT_SIZE;
const TITLE = "bubble-packed · javascript · muix · anyplot.ai";

// --- Data (in-memory, hard-coded and deterministic) -------------------------
// Product-line revenue ($M) across four divisions of a fictional electronics
// group. Circle size encodes revenue; color encodes division.
const DIVISIONS = [
  { key: "consumer", name: "Consumer Electronics", color: t.palette[0] },
  { key: "software", name: "Software & Cloud", color: t.palette[1] },
  { key: "industrial", name: "Industrial Equipment", color: t.palette[2] },
  { key: "health", name: "Health & Wearables", color: t.palette[3] },
];

const PRODUCTS = [
  { name: "Smart Speakers", division: "consumer", revenue: 42 },
  { name: "Wireless Earbuds", division: "consumer", revenue: 68 },
  { name: "4K Televisions", division: "consumer", revenue: 55 },
  { name: "Home Routers", division: "consumer", revenue: 24 },
  { name: "Streaming Devices", division: "consumer", revenue: 31 },
  { name: "Digital Cameras", division: "consumer", revenue: 18 },
  { name: "Gaming Consoles", division: "consumer", revenue: 74 },
  { name: "Tablets", division: "consumer", revenue: 47 },
  { name: "Laptops", division: "consumer", revenue: 89 },
  { name: "Cloud Storage", division: "software", revenue: 95 },
  { name: "Productivity Suite", division: "software", revenue: 61 },
  { name: "Video Conferencing", division: "software", revenue: 38 },
  { name: "Cybersecurity Tools", division: "software", revenue: 52 },
  { name: "Analytics Platform", division: "software", revenue: 44 },
  { name: "CRM Software", division: "software", revenue: 33 },
  { name: "Developer Tools", division: "software", revenue: 27 },
  { name: "AI Assistant", division: "software", revenue: 58 },
  { name: "Collaboration Suite", division: "software", revenue: 29 },
  { name: "Robotic Arms", division: "industrial", revenue: 71 },
  { name: "CNC Machines", division: "industrial", revenue: 48 },
  { name: "Conveyor Systems", division: "industrial", revenue: 22 },
  { name: "Industrial Sensors", division: "industrial", revenue: 36 },
  { name: "3D Printers", division: "industrial", revenue: 19 },
  { name: "Hydraulic Presses", division: "industrial", revenue: 41 },
  { name: "Welding Robots", division: "industrial", revenue: 53 },
  { name: "Packaging Machines", division: "industrial", revenue: 26 },
  { name: "Quality Scanners", division: "industrial", revenue: 15 },
  { name: "Fitness Trackers", division: "health", revenue: 39 },
  { name: "Smartwatches", division: "health", revenue: 62 },
  { name: "Blood Pressure Monitors", division: "health", revenue: 21 },
  { name: "Glucose Monitors", division: "health", revenue: 34 },
  { name: "Sleep Trackers", division: "health", revenue: 17 },
  { name: "Posture Sensors", division: "health", revenue: 12 },
  { name: "Hearing Aids", division: "health", revenue: 45 },
  { name: "Smart Scales", division: "health", revenue: 14 },
  { name: "Recovery Devices", division: "health", revenue: 23 },
];

const divisionByKey = Object.fromEntries(DIVISIONS.map((d) => [d.key, d]));

// --- Per-division label ink, chosen for WCAG contrast against the bubble's OWN
// fill color (not the page theme) so on-bubble text clears 4.5:1 AA in both
// themes regardless of how saturated/light the division hue is. -------------
const DARK_TEXT = "#1A1A17";
const LIGHT_TEXT = "#FAF8F1";
function relativeLuminance(hex) {
  const n = hex.replace("#", "");
  const channel = (v) => {
    const c = parseInt(v, 16) / 255;
    return c <= 0.03928 ? c / 12.92 : ((c + 0.055) / 1.055) ** 2.4;
  };
  const r = channel(n.slice(0, 2));
  const g = channel(n.slice(2, 4));
  const b = channel(n.slice(4, 6));
  return 0.2126 * r + 0.7152 * g + 0.0722 * b;
}
function contrastRatio(l1, l2) {
  const [hi, lo] = l1 > l2 ? [l1, l2] : [l2, l1];
  return (hi + 0.05) / (lo + 0.05);
}
function bestLabelInk(fillHex) {
  const fillLum = relativeLuminance(fillHex);
  const darkContrast = contrastRatio(fillLum, relativeLuminance(DARK_TEXT));
  const lightContrast = contrastRatio(fillLum, relativeLuminance(LIGHT_TEXT));
  return darkContrast >= lightContrast ? DARK_TEXT : LIGHT_TEXT;
}
DIVISIONS.forEach((d) => {
  d.labelInk = bestLabelInk(d.color);
});

// --- Layout geometry (local to the ChartContainer surface, below the title) -
const TITLE_HEIGHT = 56;
const LEGEND_HEIGHT = 40;
const MARGIN = 24;
const surfaceHeight = SIZE_H - TITLE_HEIGHT;
const chartLeft = MARGIN;
const chartTop = LEGEND_HEIGHT + 16;
const chartWidth = SIZE_W - 2 * MARGIN;
const chartHeight = surfaceHeight - chartTop - MARGIN;

// --- Circle radii, scaled by AREA so revenue differences read accurately ----
// The fill ratio leaves headroom for the packing simulation below to settle
// without heavy overlap correction — clustered packed bubbles rarely exceed
// ~45% of the bounding rectangle once inter-group spacing is accounted for.
const FILL_RATIO = 0.42;
const totalRevenue = PRODUCTS.reduce((sum, p) => sum + p.revenue, 0);
const radiusScale = Math.sqrt((FILL_RATIO * chartWidth * chartHeight) / (Math.PI * totalRevenue));

const bubbles = PRODUCTS.map((p) => ({ ...p, r: radiusScale * Math.sqrt(p.revenue) }));

// --- Force-directed packing: pull each bubble toward its division's anchor,
// then resolve overlaps iteratively — a small hand-rolled version of the
// classic bubble-chart force simulation the spec calls for. The community
// package has no circle-packing layout of its own, so the geometry is
// computed here rather than reached for from another charting library. -----
function lcg(seed) {
  let state = seed;
  return () => {
    state = (state * 1664525 + 1013904223) % 4294967296;
    return state / 4294967296;
  };
}
const rand = lcg(42);

const anchors = {
  consumer: { x: chartLeft + chartWidth * 0.27, y: chartTop + chartHeight * 0.28 },
  software: { x: chartLeft + chartWidth * 0.73, y: chartTop + chartHeight * 0.28 },
  industrial: { x: chartLeft + chartWidth * 0.27, y: chartTop + chartHeight * 0.75 },
  health: { x: chartLeft + chartWidth * 0.73, y: chartTop + chartHeight * 0.75 },
};

bubbles.forEach((b) => {
  const anchor = anchors[b.division];
  b.x = anchor.x + (rand() - 0.5) * 60;
  b.y = anchor.y + (rand() - 0.5) * 60;
});

const PADDING = 5;
const ATTRACTION = 0.03;
const ITERATIONS = 400;
for (let iter = 0; iter < ITERATIONS; iter++) {
  for (const b of bubbles) {
    const anchor = anchors[b.division];
    b.x += (anchor.x - b.x) * ATTRACTION;
    b.y += (anchor.y - b.y) * ATTRACTION;
  }
  for (let i = 0; i < bubbles.length; i++) {
    for (let j = i + 1; j < bubbles.length; j++) {
      const a = bubbles[i];
      const c = bubbles[j];
      const dx = c.x - a.x;
      const dy = c.y - a.y;
      const dist = Math.hypot(dx, dy) || 0.01;
      const minDist = a.r + c.r + PADDING;
      if (dist < minDist) {
        const overlap = (minDist - dist) / 2;
        const ux = dx / dist;
        const uy = dy / dist;
        a.x -= ux * overlap;
        a.y -= uy * overlap;
        c.x += ux * overlap;
        c.y += uy * overlap;
      }
    }
  }
  for (const b of bubbles) {
    b.x = Math.min(chartLeft + chartWidth - b.r, Math.max(chartLeft + b.r, b.x));
    b.y = Math.min(chartTop + chartHeight - b.r, Math.max(chartTop + b.r, b.y));
  }
}

// Truncate on a word boundary so a cut lands after a whole word ("Productivity…")
// rather than mid-word ("Productivity Su…"); when no whole word fits, fall back
// to initials ("PS") instead of an unreadable 2-3 letter fragment.
function initials(label) {
  return label
    .split(" ")
    .map((w) => w[0])
    .join("");
}
function truncate(label, maxChars) {
  if (label.length <= maxChars) return label;
  const cut = label.slice(0, maxChars);
  const lastSpace = cut.lastIndexOf(" ");
  if (lastSpace >= 3) return `${cut.slice(0, lastSpace)}…`;
  return maxChars >= 6 ? `${cut}…` : initials(label);
}

// --- Legend (division colors) -----------------------------------------------
function Legend() {
  const itemWidth = chartWidth / DIVISIONS.length;
  const cy = LEGEND_HEIGHT / 2;
  return (
    <g>
      {DIVISIONS.map((d, i) => {
        const cx = chartLeft + itemWidth * i + 10;
        return (
          <g key={d.key}>
            <circle cx={cx} cy={cy} r={7} fill={d.color} />
            <text x={cx + 16} y={cy} dominantBaseline="middle" fontSize={14} fill={t.inkSoft}>
              {d.name}
            </text>
          </g>
        );
      })}
    </g>
  );
}

// --- Bubbles: circle area encodes revenue, fill color encodes division -----
function Bubbles() {
  return (
    <g>
      {bubbles.map((b) => {
        const division = divisionByKey[b.division];
        const nameFontSize = Math.max(10, Math.min(15, b.r * 0.2));
        const valueFontSize = Math.max(9, nameFontSize * 0.85);
        const showName = b.r >= 52;
        const showValue = b.r >= 36;
        const maxChars = Math.max(4, Math.floor((b.r * 1.7) / (nameFontSize * 0.55)));
        return (
          <g key={b.name}>
            <circle
              cx={b.x}
              cy={b.y}
              r={b.r}
              fill={division.color}
              fillOpacity={0.95}
              stroke={t.pageBg}
              strokeWidth={2}
            >
              <title>{`${b.name} (${division.name}): $${b.revenue}M`}</title>
            </circle>
            {showName && (
              <text
                x={b.x}
                y={b.y - nameFontSize * 0.35}
                textAnchor="middle"
                fontSize={nameFontSize}
                fontWeight={600}
                fill={division.labelInk}
              >
                {truncate(b.name, maxChars)}
              </text>
            )}
            {showValue && (
              <text
                x={b.x}
                y={b.y + (showName ? nameFontSize * 1.1 : 4)}
                textAnchor="middle"
                fontSize={valueFontSize}
                fill={division.labelInk}
              >
                {`$${b.revenue}M`}
              </text>
            )}
          </g>
        );
      })}
    </g>
  );
}

// --- Chart (default-exported component — the harness mounts it) -----------
export default function Chart() {
  return (
    <div style={{ width: SIZE_W, height: SIZE_H }}>
      <div
        style={{
          height: TITLE_HEIGHT,
          lineHeight: `${TITLE_HEIGHT}px`,
          paddingLeft: MARGIN,
          fontSize: 22,
          fontWeight: 500,
          color: t.ink,
        }}
      >
        {TITLE}
      </div>
      <ChartContainer
        width={SIZE_W}
        height={surfaceHeight}
        series={[]}
        skipAnimation
        margin={{ top: 0, right: 0, bottom: 0, left: 0 }}
      >
        <Legend />
        <Bubbles />
      </ChartContainer>
    </div>
  );
}
Runnable source as JSON, for any HTTP client: https://api.anyplot.ai/specs/bubble-packed/muix/code. Any spec id and library id listed in llms-full.txt fit the same URL shape; every URL below is complete and callable.
{
  "spec_id": "bubble-packed",
  "language": "javascript",
  "library": "muix",
  "page": "https://anyplot.ai/bubble-packed/javascript/muix",
  "hub": "https://anyplot.ai/bubble-packed",
  "code_json": "https://api.anyplot.ai/specs/bubble-packed/muix/code",
  "spec_json": "https://api.anyplot.ai/specs/bubble-packed",
  "render_light_png": "https://storage.googleapis.com/anyplot-images/plots/bubble-packed/javascript/muix/plot-light.png",
  "render_dark_png": "https://storage.googleapis.com/anyplot-images/plots/bubble-packed/javascript/muix/plot-dark.png",
  "interactive_light_html": "https://storage.googleapis.com/anyplot-images/plots/bubble-packed/javascript/muix/plot-light.html",
  "interactive_dark_html": "https://storage.googleapis.com/anyplot-images/plots/bubble-packed/javascript/muix/plot-dark.html",
  "quality_score": 82.0,
  "license": "MIT",
  "guide": "https://anyplot.ai/llms.txt"
}
Part of Basic Packed Bubble Chart on anyplot.ai.