The same plot in 14 other libraries — JavaScript: Chart.js, Apache ECharts, Highcharts, MUI X Charts; Python: Altair, Bokeh, lets-plot, Matplotlib, Plotly, plotnine, Pygal, Seaborn; R: ggplot2; Julia: Makie.jl. Compare all 15 side by side: Basic Packed Bubble Chart in Python, R, Julia and JavaScript.
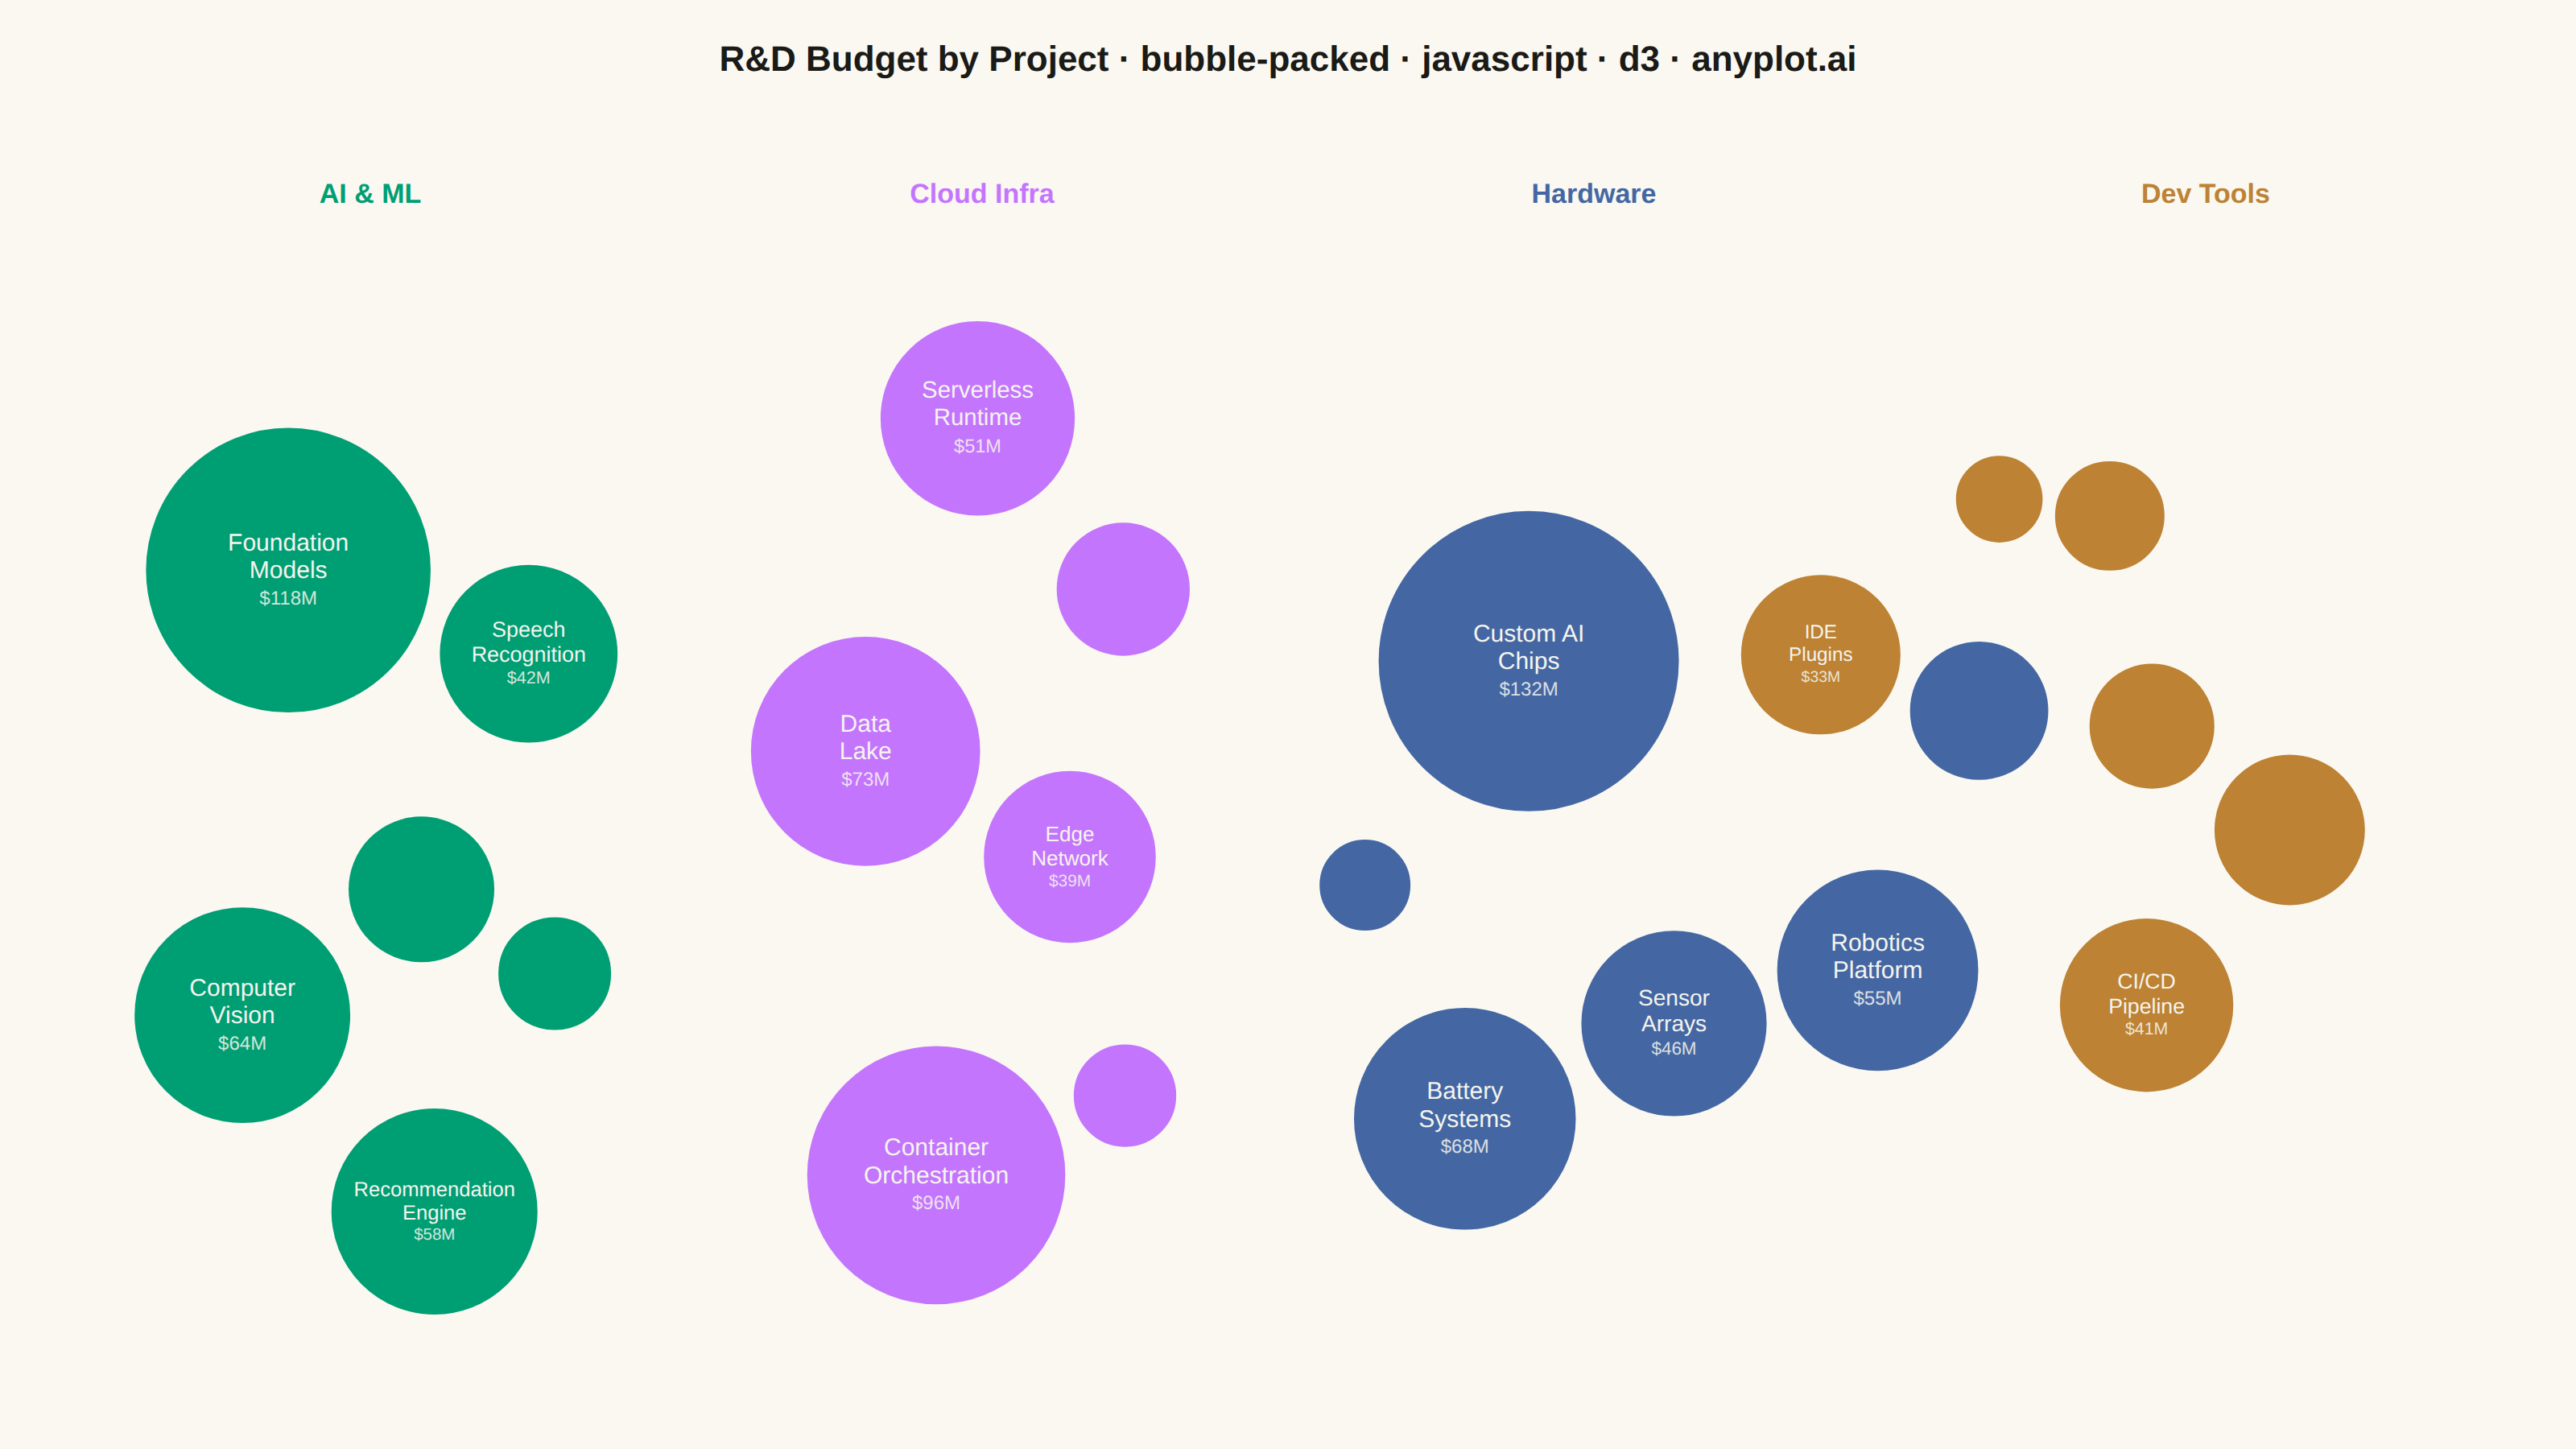
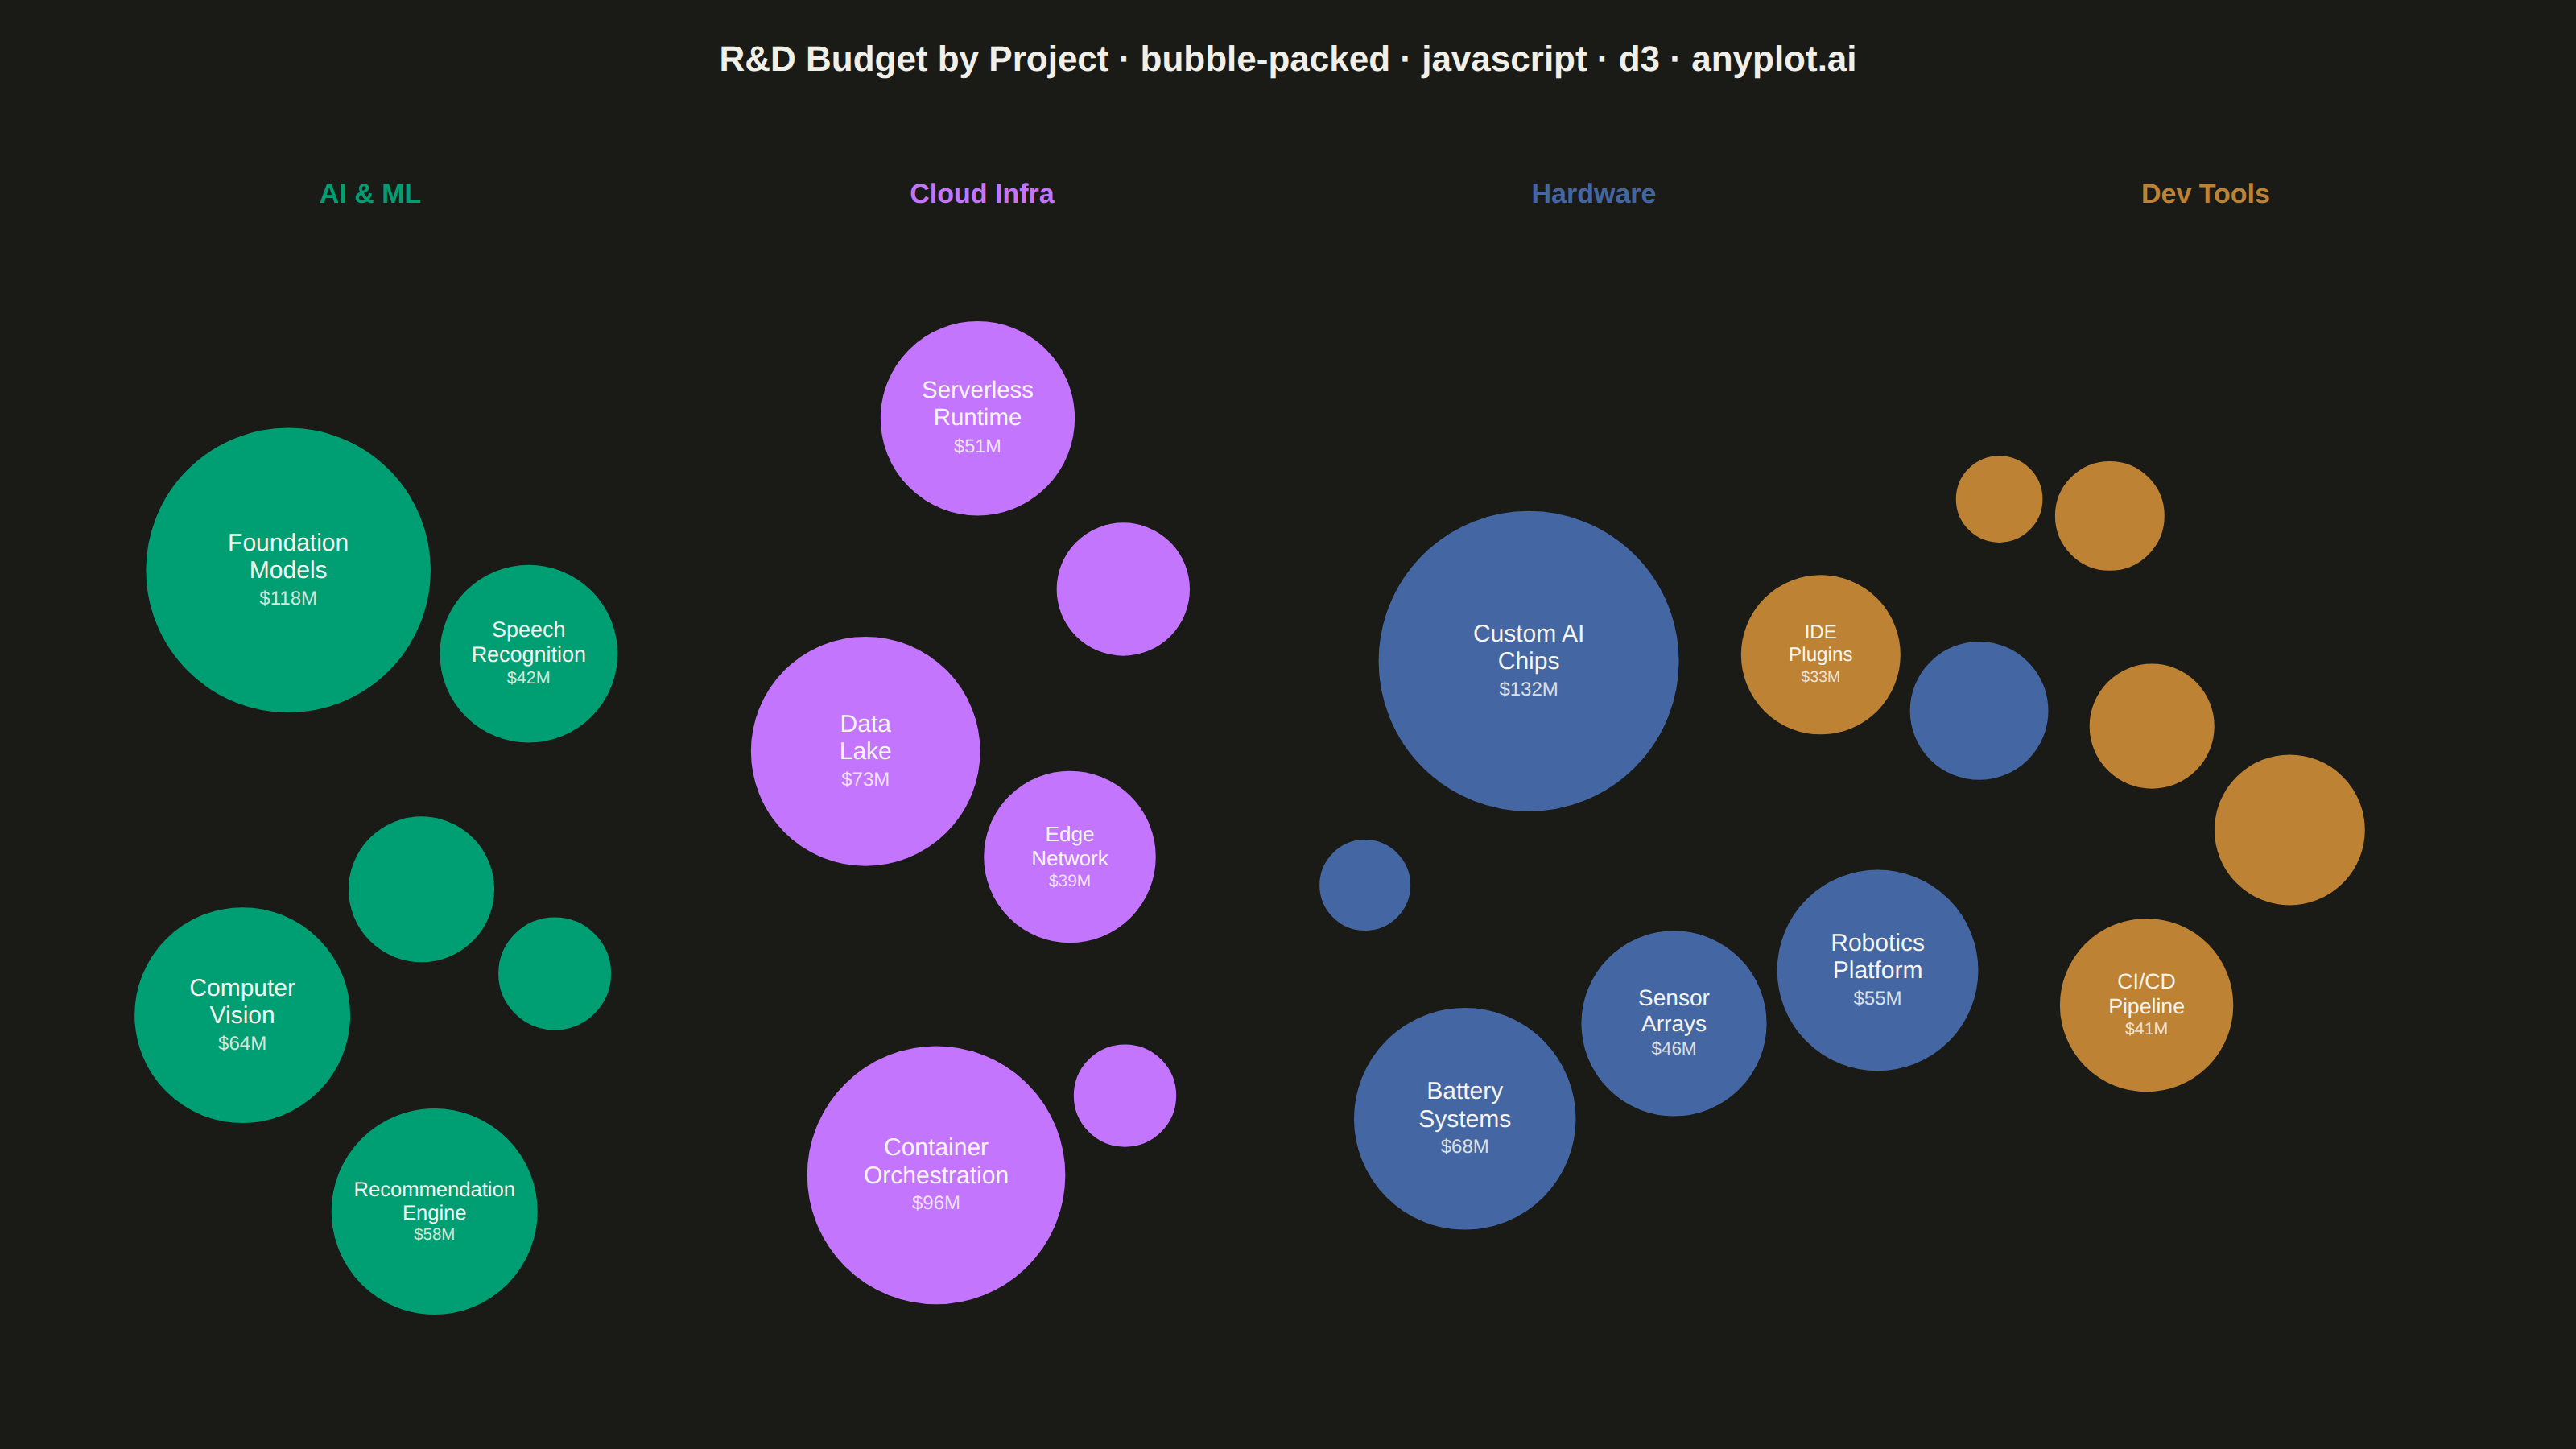
A packed bubble chart displays data as circles where size represents value, and circles are packed together without overlap using physics simulation. Unlike scatter or traditional bubble charts, position has no meaning - only size and optional grouping matter. This visualization efficiently uses space for comparing values across many categories.
// anyplot.ai
// bubble-packed: Basic Packed Bubble Chart
// Library: d3 7.9.0 | JavaScript 22.23.2
// Quality: 93/100 | Created: 2026-08-24
//# anyplot-orientation: landscape

const t = window.ANYPLOT_TOKENS;
const { width, height } = window.ANYPLOT_SIZE;

// --- Data (in-memory, deterministic) — R&D budget ($M) by project, grouped by department ---
const GROUPS = ["AI & ML", "Cloud Infra", "Hardware", "Dev Tools"];
const data = [
  { label: "Foundation Models", value: 118, group: "AI & ML" },
  { label: "Computer Vision", value: 64, group: "AI & ML" },
  { label: "Speech Recognition", value: 42, group: "AI & ML" },
  { label: "Recommendation Engine", value: 58, group: "AI & ML" },
  { label: "AutoML Platform", value: 27, group: "AI & ML" },
  { label: "Model Monitoring", value: 15, group: "AI & ML" },
  { label: "Container Orchestration", value: 96, group: "Cloud Infra" },
  { label: "Serverless Runtime", value: 51, group: "Cloud Infra" },
  { label: "Edge Network", value: 39, group: "Cloud Infra" },
  { label: "Data Lake", value: 73, group: "Cloud Infra" },
  { label: "Service Mesh", value: 22, group: "Cloud Infra" },
  { label: "Cost Optimization", value: 12, group: "Cloud Infra" },
  { label: "Custom AI Chips", value: 132, group: "Hardware" },
  { label: "Sensor Arrays", value: 46, group: "Hardware" },
  { label: "Battery Systems", value: 68, group: "Hardware" },
  { label: "Thermal Design", value: 24, group: "Hardware" },
  { label: "Robotics Platform", value: 55, group: "Hardware" },
  { label: "Prototyping Lab", value: 9, group: "Hardware" },
  { label: "IDE Plugins", value: 33, group: "Dev Tools" },
  { label: "CI/CD Pipeline", value: 41, group: "Dev Tools" },
  { label: "Testing Framework", value: 19, group: "Dev Tools" },
  { label: "Documentation Portal", value: 8, group: "Dev Tools" },
  { label: "SDK Libraries", value: 29, group: "Dev Tools" },
  { label: "Debugger Suite", value: 14, group: "Dev Tools" },
];

// --- Layout — one cluster per group, spaced across the width -----------------
const margin = { top: 100, right: 40, bottom: 30, left: 40 };
const bubbleTop = margin.top + 55; // room for the group label above each cluster
const bubbleBottom = height - margin.bottom;
const clusterWidth = (width - margin.left - margin.right) / GROUPS.length;
const clusterCenterY = bubbleTop + (bubbleBottom - bubbleTop) / 2;
const clusterCenters = GROUPS.map((_, i) => ({
  x: margin.left + clusterWidth * (i + 0.5),
  y: clusterCenterY,
}));
const color = d3.scaleOrdinal().domain(GROUPS).range(t.palette);

// --- Radius scale — area-proportional, not radius-proportional ---------------
const radius = d3
  .scaleSqrt()
  .domain([0, d3.max(data, (d) => d.value)])
  .range([6, 95]);
const nodes = data.map((d) => ({ ...d, r: radius(d.value) }));

// --- Force simulation: cluster by group, resolve overlap via collision -------
const simulation = d3
  .forceSimulation(nodes)
  .force("x", d3.forceX((d) => clusterCenters[GROUPS.indexOf(d.group)].x).strength(0.06))
  .force("y", d3.forceY(clusterCenterY).strength(0.06))
  .force(
    "collide",
    d3
      .forceCollide((d) => d.r + 3)
      .strength(1)
      .iterations(3)
  )
  .stop();

for (let i = 0; i < 400; i += 1) {
  simulation.tick();
  for (const d of nodes) {
    d.x = Math.max(margin.left + d.r, Math.min(width - margin.right - d.r, d.x));
    d.y = Math.max(bubbleTop + d.r, Math.min(bubbleBottom - d.r, d.y));
  }
}

// Packed clusters settle compactly near clusterCenterY, leaving unbalanced
// whitespace above and below. Stretch the vertical spread to use the full
// bubbleTop-bubbleBottom band; this only increases inter-node distance
// (never shrinks it), so it cannot introduce new overlap.
const yMin = d3.min(nodes, (d) => d.y - d.r);
const yMax = d3.max(nodes, (d) => d.y + d.r);
const yScale = (bubbleBottom - bubbleTop) / (yMax - yMin);
for (const d of nodes) {
  d.y = Math.max(bubbleTop + d.r, Math.min(bubbleBottom - d.r, bubbleTop + (d.y - yMin) * yScale));
}

// --- SVG mount ----------------------------------------------------------------
const svg = d3.select("#container").append("svg").attr("width", width).attr("height", height);

// --- Group labels — double as the color legend, no separate box needed -------
svg
  .selectAll("text.group")
  .data(GROUPS)
  .join("text")
  .attr("class", "group")
  .attr("x", (_, i) => clusterCenters[i].x)
  .attr("y", margin.top + 26)
  .attr("text-anchor", "middle")
  .attr("fill", (g) => color(g))
  .style("font-size", "17px")
  .style("font-weight", "600")
  .text((g) => g);

// --- Bubbles --------------------------------------------------------------
function relativeLuminance(hex) {
  const [r, g, b] = hex.match(/\w\w/g).map((c) => parseInt(c, 16) / 255);
  const linear = (c) => (c <= 0.03928 ? c / 12.92 : ((c + 0.055) / 1.055) ** 2.4);
  return 0.2126 * linear(r) + 0.7152 * linear(g) + 0.0722 * linear(b);
}
const labelInk = (hex) => (relativeLuminance(hex) > 0.42 ? "#1A1A17" : "#F5F4EE");

// Largest project per group — emphasized with a bolder stroke to reinforce
// the size hierarchy (the "hero" bubble of each cluster).
const heroValueByGroup = new Map(GROUPS.map((g) => [g, d3.max(nodes.filter((d) => d.group === g), (d) => d.value)]));
const isHero = (d) => d.value === heroValueByGroup.get(d.group);

const bubble = svg
  .selectAll("g.bubble")
  .data(nodes)
  .join("g")
  .attr("transform", (d) => `translate(${d.x},${d.y})`);

bubble
  .append("circle")
  .attr("r", (d) => d.r)
  .attr("fill", (d) => color(d.group))
  .attr("stroke", t.pageBg)
  .attr("stroke-width", (d) => (isHero(d) ? 3.5 : 2));

// Labels only where the circle is large enough to hold them; word-wrapped,
// sized to the available chord so text never spills past its own bubble, and
// paired with a smaller value line ("$118M") so magnitudes are readable
// directly, not just relative rank.
bubble
  .filter((d) => d.r > 50)
  .append("text")
  .attr("text-anchor", "middle")
  .attr("dominant-baseline", "central")
  .attr("fill", (d) => labelInk(color(d.group)))
  .each(function (d) {
    const words = d.label.split(" ");
    const nameLines =
      words.length > 1
        ? [words.slice(0, Math.ceil(words.length / 2)).join(" "), words.slice(Math.ceil(words.length / 2)).join(" ")]
        : [d.label];
    const valueLine = `$${d.value}M`;
    const totalLines = nameLines.length + 1;
    const longest = Math.max(...nameLines.map((l) => l.length), valueLine.length * 0.85);
    const fontSize = Math.max(9, Math.min(15, d.r * 0.24, (d.r * 1.6) / (longest * 0.58)));
    const valueFontSize = fontSize * 0.8;
    const lineHeight = fontSize * 1.15;
    const sel = d3.select(this).style("font-size", `${fontSize}px`).style("font-weight", "500");
    sel
      .selectAll("tspan.name")
      .data(nameLines)
      .join("tspan")
      .attr("class", "name")
      .attr("x", 0)
      .attr("y", (_, i) => (i - (totalLines - 1) / 2) * lineHeight)
      .text((line) => line);
    sel
      .append("tspan")
      .attr("class", "value")
      .attr("x", 0)
      .attr("y", (nameLines.length - (totalLines - 1) / 2) * lineHeight)
      .style("font-size", `${valueFontSize}px`)
      .style("font-weight", "400")
      .style("opacity", 0.85)
      .text(valueLine);
  });

// --- Title ----------------------------------------------------------------
const TITLE = "R&D Budget by Project · bubble-packed · javascript · d3 · anyplot.ai";
const titleFontSize = Math.max(14, Math.round(22 * Math.min(1, 67 / TITLE.length)));
svg
  .append("text")
  .attr("x", width / 2)
  .attr("y", 44)
  .attr("text-anchor", "middle")
  .attr("fill", t.ink)
  .style("font-size", `${titleFontSize}px`)
  .style("font-weight", "600")
  .text(TITLE);
Runnable source as JSON, for any HTTP client: https://api.anyplot.ai/specs/bubble-packed/d3/code. Any spec id and library id listed in llms-full.txt fit the same URL shape; every URL below is complete and callable.
{
  "spec_id": "bubble-packed",
  "language": "javascript",
  "library": "d3",
  "page": "https://anyplot.ai/bubble-packed/javascript/d3",
  "hub": "https://anyplot.ai/bubble-packed",
  "code_json": "https://api.anyplot.ai/specs/bubble-packed/d3/code",
  "spec_json": "https://api.anyplot.ai/specs/bubble-packed",
  "render_light_png": "https://storage.googleapis.com/anyplot-images/plots/bubble-packed/javascript/d3/plot-light.png",
  "render_dark_png": "https://storage.googleapis.com/anyplot-images/plots/bubble-packed/javascript/d3/plot-dark.png",
  "interactive_light_html": "https://storage.googleapis.com/anyplot-images/plots/bubble-packed/javascript/d3/plot-light.html",
  "interactive_dark_html": "https://storage.googleapis.com/anyplot-images/plots/bubble-packed/javascript/d3/plot-dark.html",
  "quality_score": 93.0,
  "license": "MIT",
  "guide": "https://anyplot.ai/llms.txt"
}
Part of Basic Packed Bubble Chart on anyplot.ai.