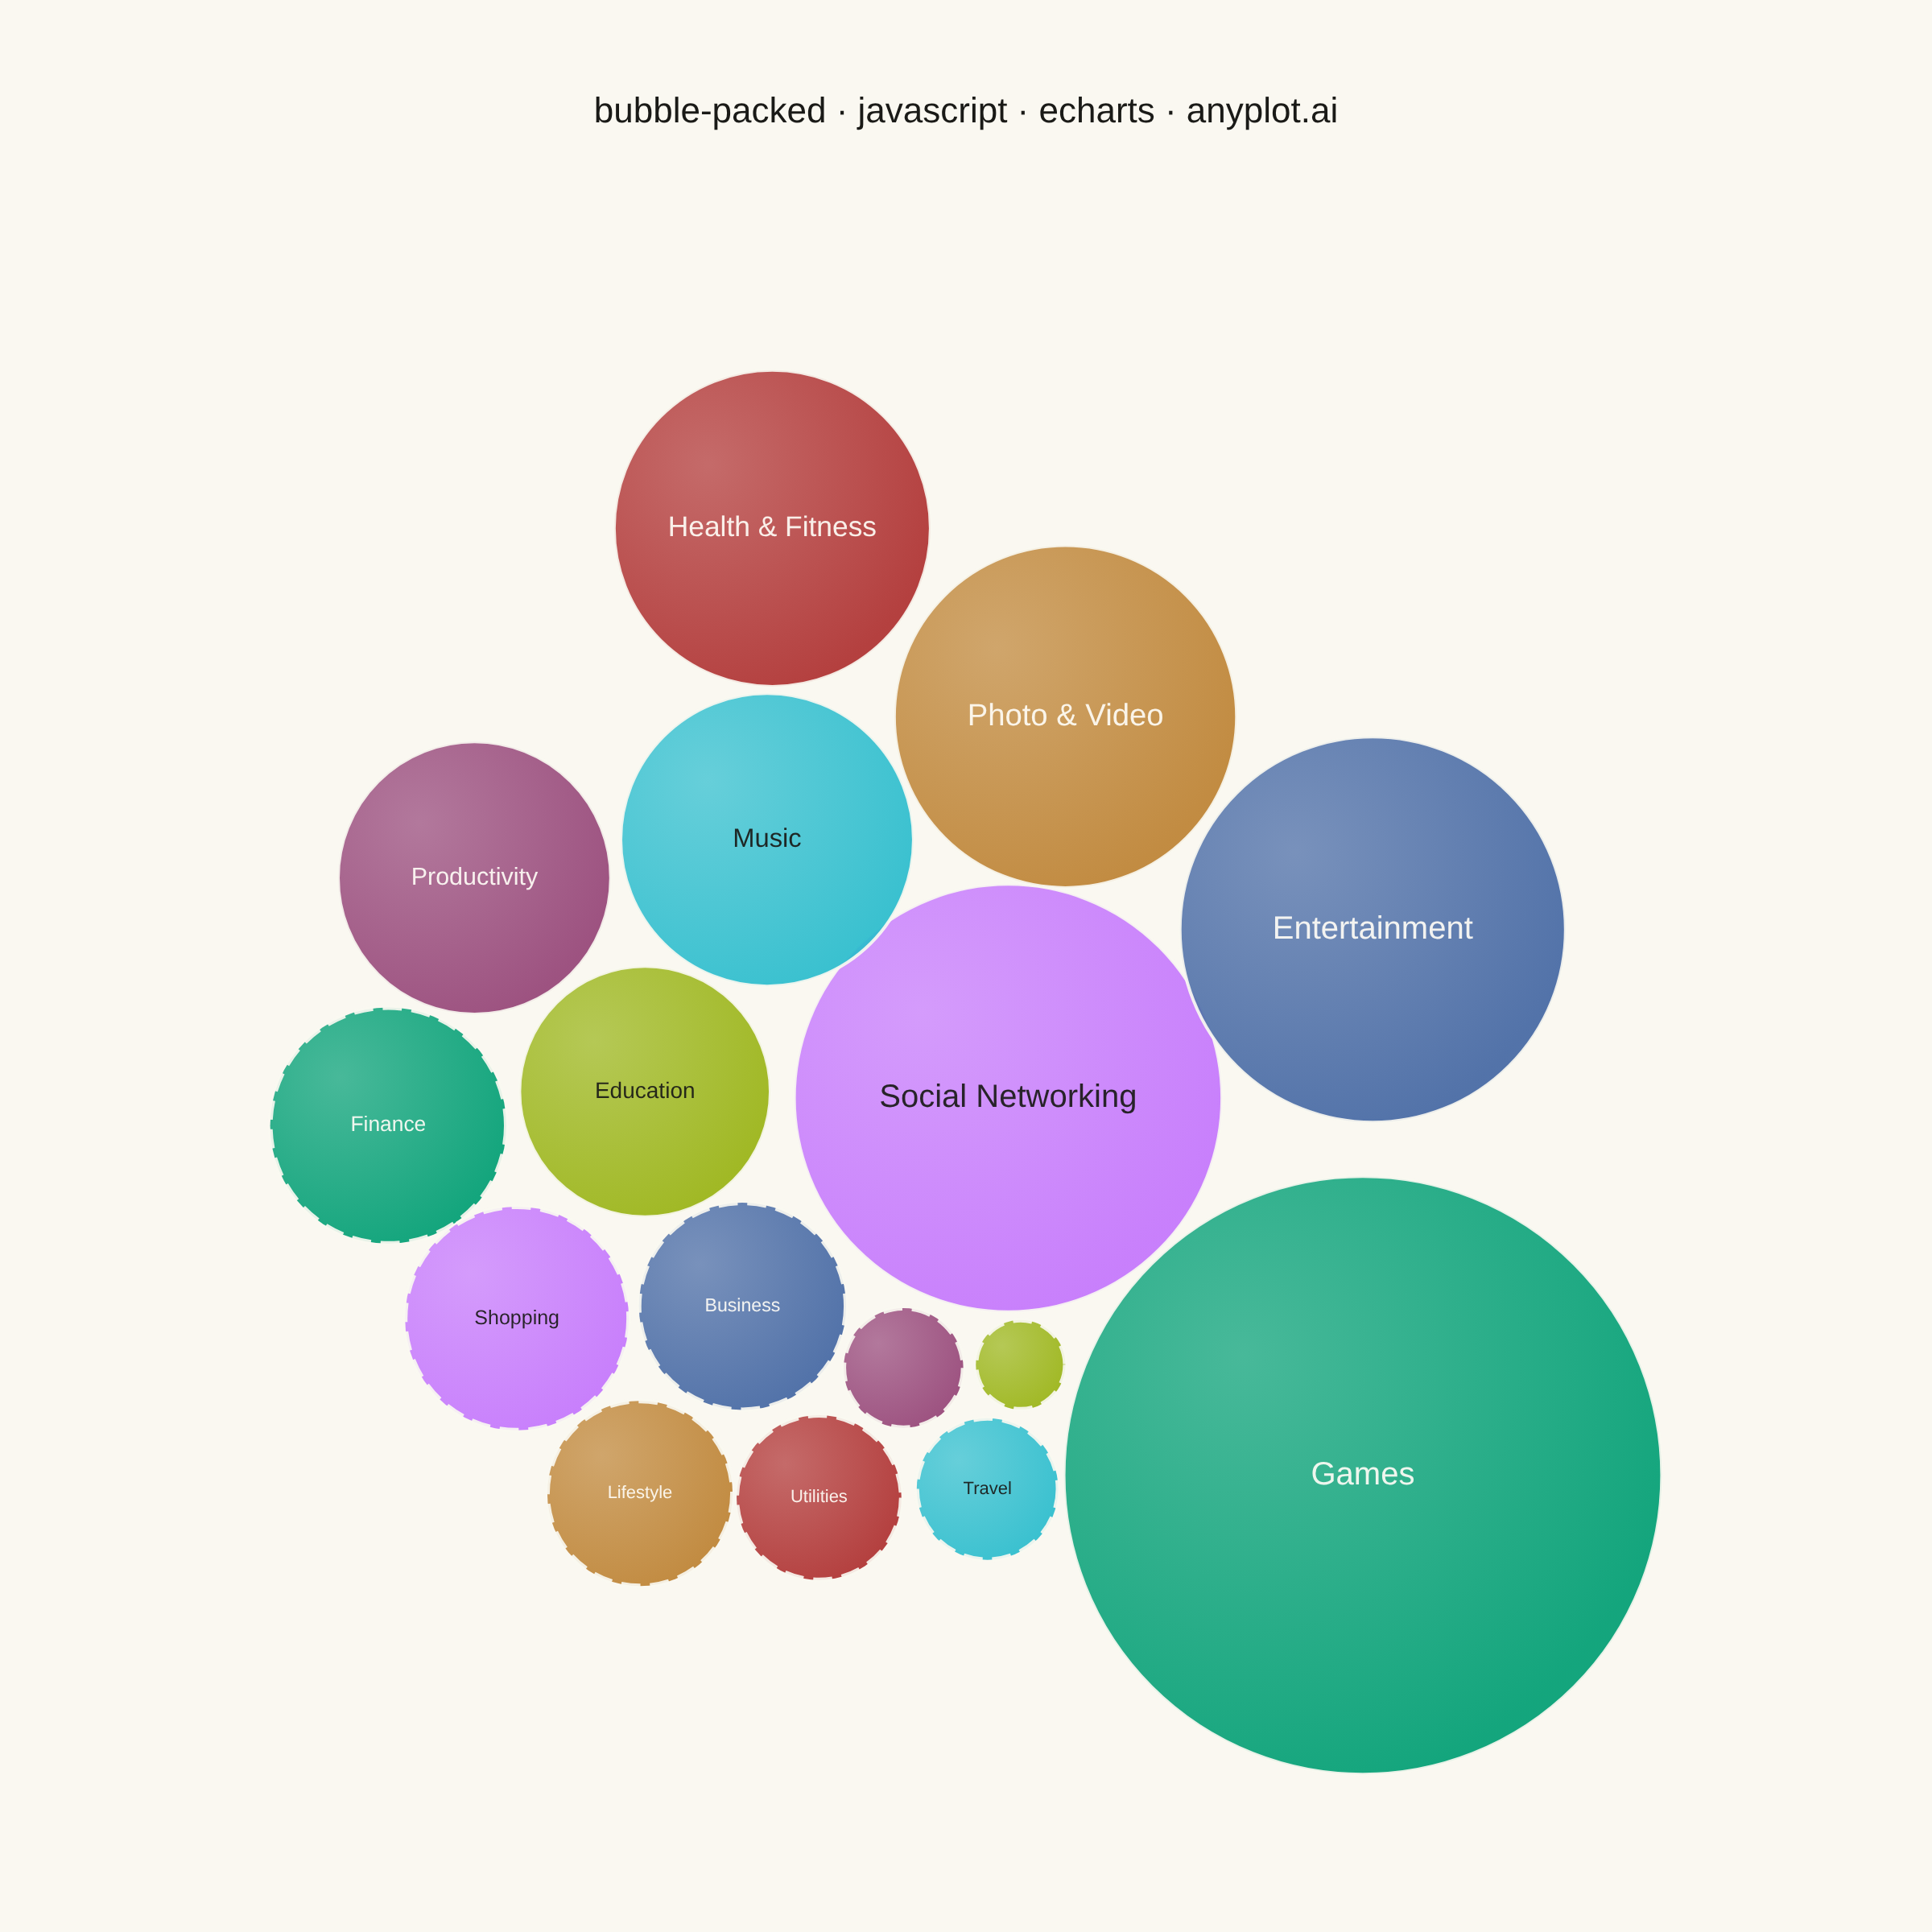
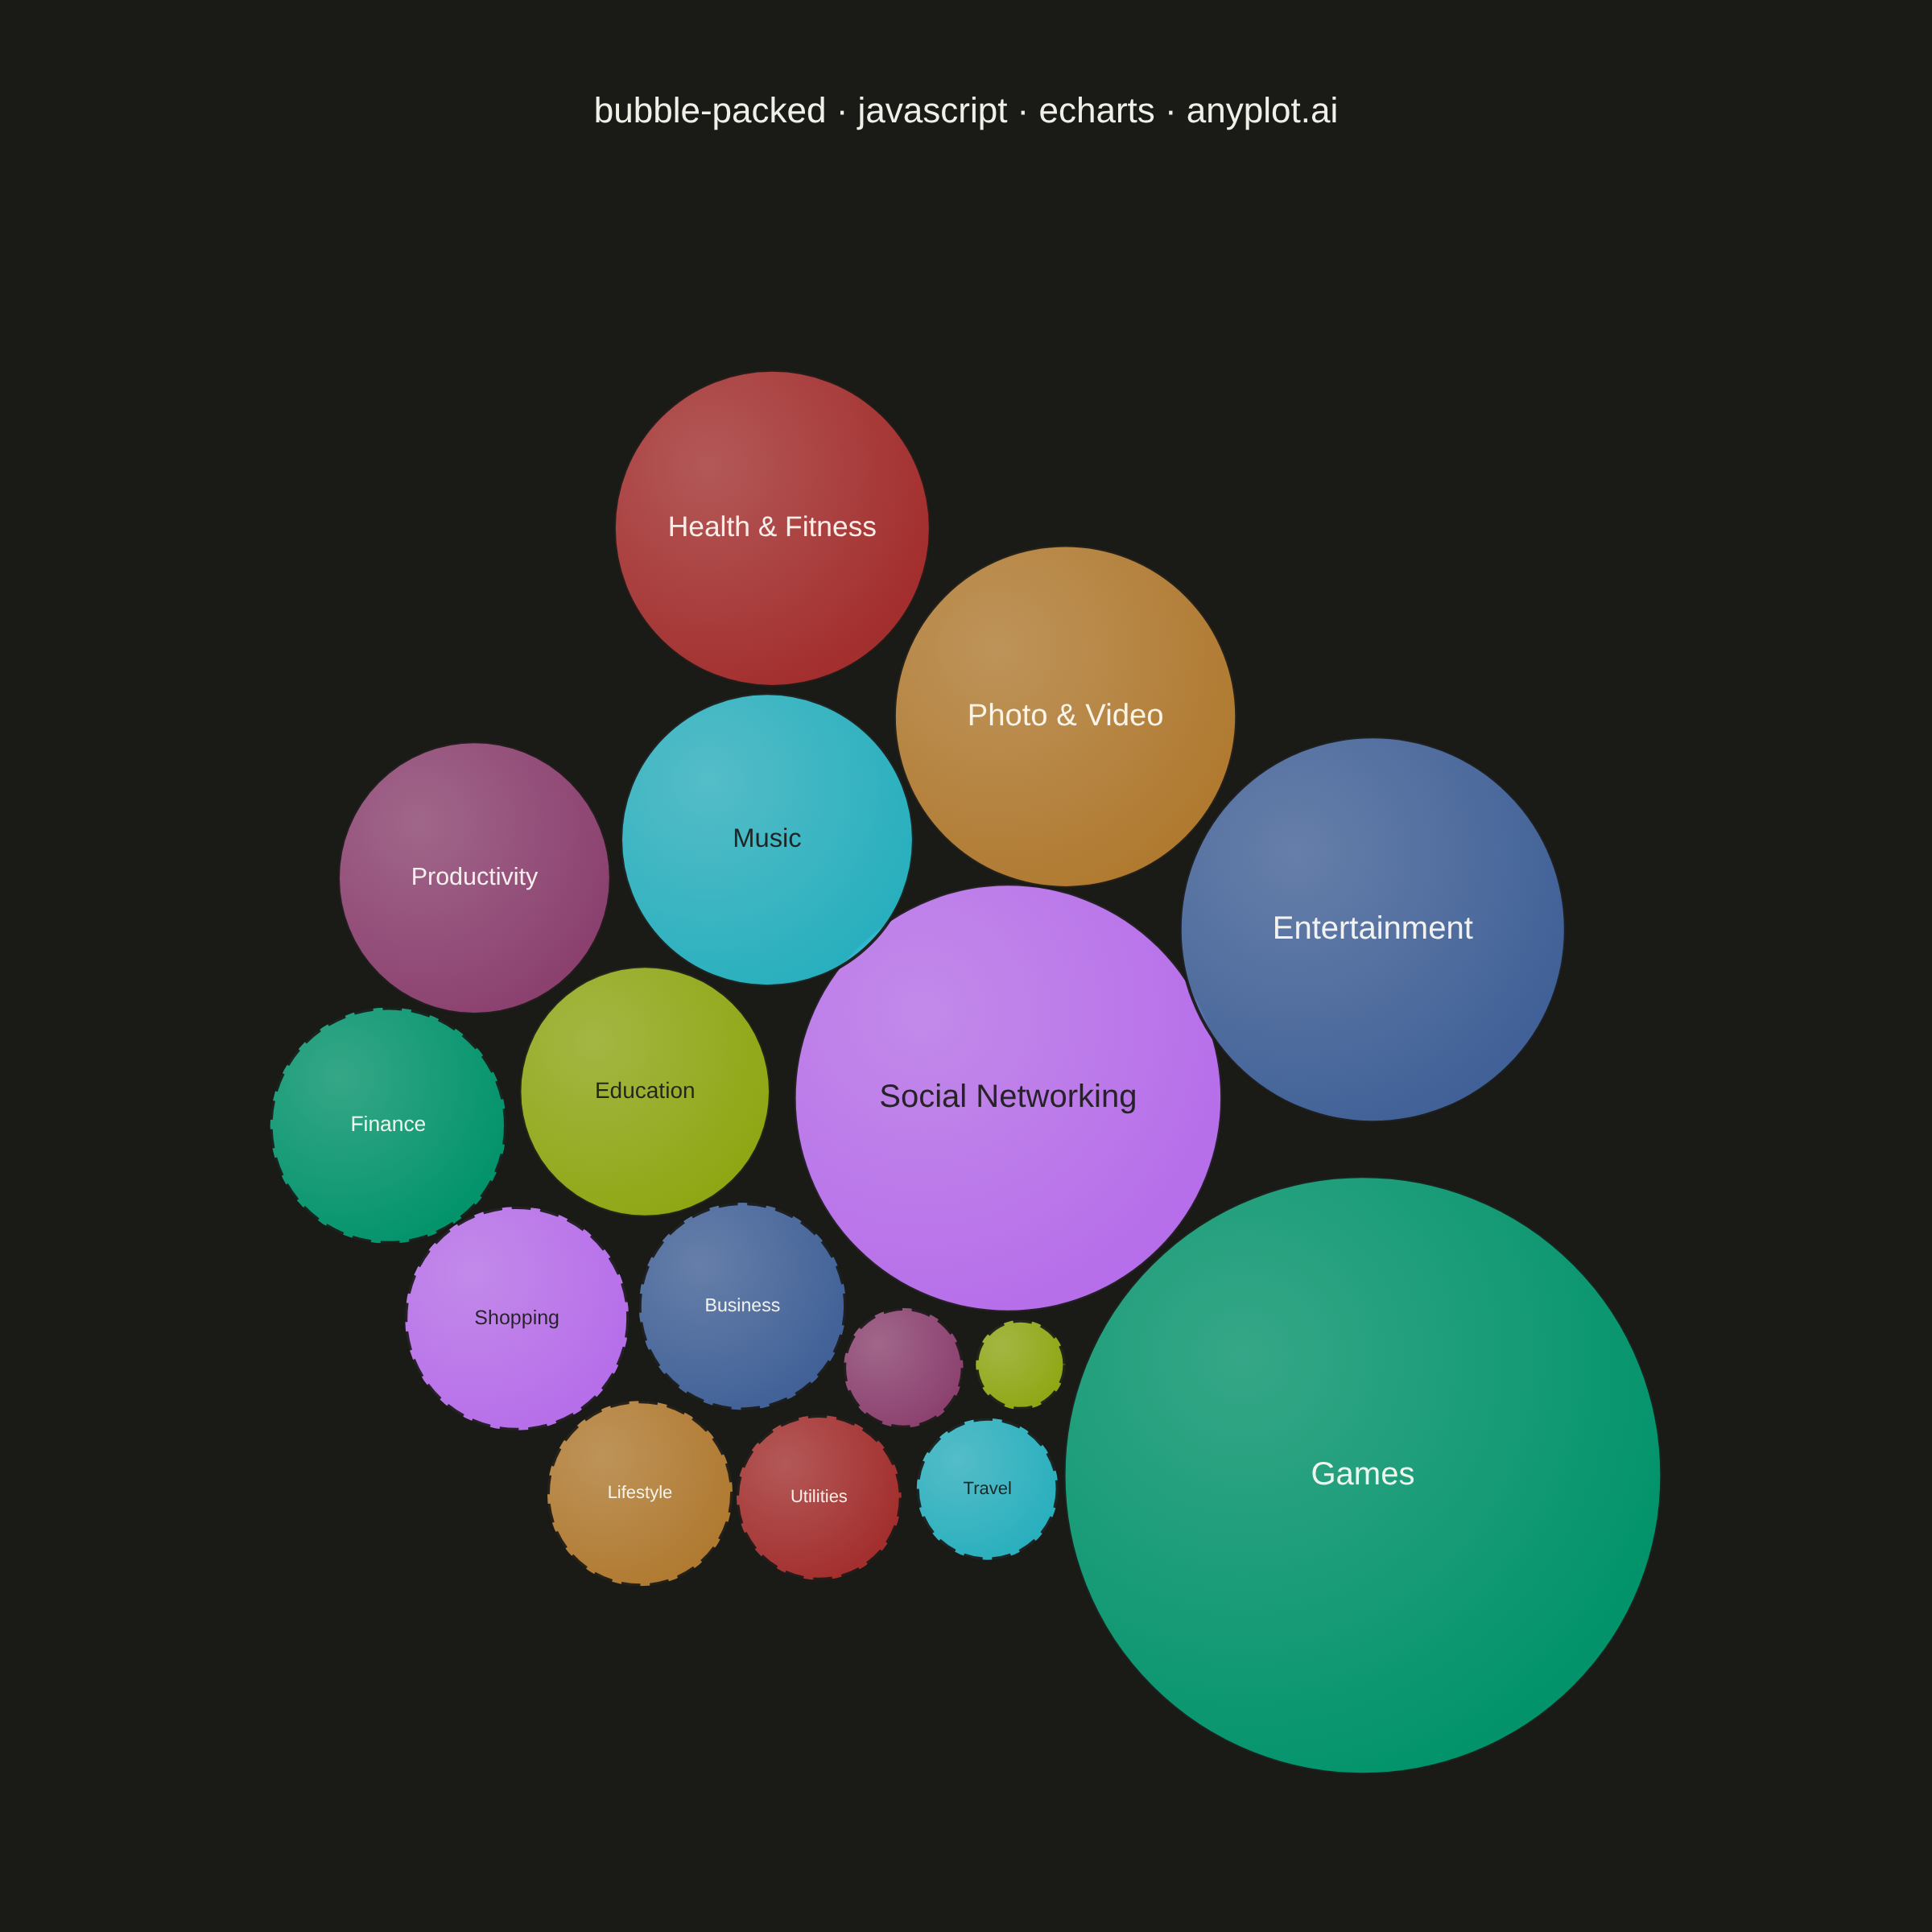
The same plot in 14 other libraries — JavaScript: Chart.js, D3.js, Highcharts, MUI X Charts; Python: Altair, Bokeh, lets-plot, Matplotlib, Plotly, plotnine, Pygal, Seaborn; R: ggplot2; Julia: Makie.jl. Compare all 15 side by side: Basic Packed Bubble Chart in Python, R, Julia and JavaScript.
A packed bubble chart displays data as circles where size represents value, and circles are packed together without overlap using physics simulation. Unlike scatter or traditional bubble charts, position has no meaning - only size and optional grouping matter. This visualization efficiently uses space for comparing values across many categories.
// anyplot.ai
// bubble-packed: Basic Packed Bubble Chart
// Library: echarts 6.1.0 | JavaScript 22.23.2
// Quality: 87/100 | Created: 2026-08-24
//# anyplot-orientation: square

const t = window.ANYPLOT_TOKENS;
const { width: W, height: H } = window.ANYPLOT_SIZE;

// --- Data (in-memory, deterministic) ----------------------------------------
// Global app-store revenue by category, $M / year
const categories = [
  { label: "Games", value: 1250 },
  { label: "Social Networking", value: 640 },
  { label: "Entertainment", value: 520 },
  { label: "Photo & Video", value: 410 },
  { label: "Health & Fitness", value: 350 },
  { label: "Music", value: 300 },
  { label: "Productivity", value: 260 },
  { label: "Education", value: 220 },
  { label: "Finance", value: 195 },
  { label: "Shopping", value: 175 },
  { label: "Business", value: 150 },
  { label: "Lifestyle", value: 120 },
  { label: "Utilities", value: 95 },
  { label: "Travel", value: 70 },
  { label: "Food & Drink", value: 50 },
  { label: "Weather", value: 28 },
];

// --- Layout geometry (square working area for a distortion-free pack) -------
const titleZone = Math.round(H * 0.16);
const sideMargin = Math.round(W * 0.05);
const bottomMargin = Math.round(H * 0.05);
const boxSize = Math.min(W - sideMargin * 2, H - titleZone - bottomMargin);
const gridLeft = Math.round((W - boxSize) / 2);
const gridTop = H - bottomMargin - boxSize;

// --- Circle packing (deterministic centering + collision simulation) -------
// No native packing series in ECharts — circles are laid out here in pixel
// units that match the square grid 1:1, then drawn with a plain scatter
// series (symbolSize = 2 * radius, position = simulated (x, y)).
let seed = 42;
function rand() {
  seed = (seed * 1103515245 + 12345) & 0x7fffffff;
  return seed / 0x7fffffff;
}

const maxValue = Math.max(...categories.map((c) => c.value));
const radiusScale = boxSize * 0.15 / Math.sqrt(maxValue);
const radii = categories.map((c) => radiusScale * Math.sqrt(c.value));

const n = categories.length;
const cx = boxSize / 2;
const cy = boxSize / 2;
const positions = categories.map((_, i) => {
  const angle = (i / n) * Math.PI * 2;
  const dist = boxSize * 0.28 * (0.6 + rand() * 0.4);
  return { x: cx + Math.cos(angle) * dist, y: cy + Math.sin(angle) * dist };
});

const PADDING = 6;
const ITERATIONS = 500;
for (let iter = 0; iter < ITERATIONS; iter++) {
  for (let i = 0; i < n; i++) {
    positions[i].x += (cx - positions[i].x) * 0.02;
    positions[i].y += (cy - positions[i].y) * 0.02;
  }
  for (let i = 0; i < n; i++) {
    for (let j = i + 1; j < n; j++) {
      const dx = positions[j].x - positions[i].x;
      const dy = positions[j].y - positions[i].y;
      const dist = Math.sqrt(dx * dx + dy * dy) || 0.001;
      const minDist = radii[i] + radii[j] + PADDING;
      if (dist < minDist) {
        const overlap = (minDist - dist) / 2;
        const nx = dx / dist;
        const ny = dy / dist;
        positions[i].x -= nx * overlap;
        positions[i].y -= ny * overlap;
        positions[j].x += nx * overlap;
        positions[j].y += ny * overlap;
      }
    }
  }
  for (let i = 0; i < n; i++) {
    const r = radii[i];
    positions[i].x = Math.min(boxSize - r, Math.max(r, positions[i].x));
    positions[i].y = Math.min(boxSize - r, Math.max(r, positions[i].y));
  }
}

// The weak centering force leaves a residual drift after finite iterations —
// re-center the whole blob's bounding box onto the box center so it doesn't
// settle off-axis and waste canvas on one side.
function boundingBox() {
  let minX = Infinity, maxX = -Infinity, minY = Infinity, maxY = -Infinity;
  for (let i = 0; i < n; i++) {
    minX = Math.min(minX, positions[i].x - radii[i]);
    maxX = Math.max(maxX, positions[i].x + radii[i]);
    minY = Math.min(minY, positions[i].y - radii[i]);
    maxY = Math.max(maxY, positions[i].y + radii[i]);
  }
  return { minX, maxX, minY, maxY };
}

let bbox = boundingBox();
const offsetX = cx - (bbox.minX + bbox.maxX) / 2;
const offsetY = cy - (bbox.minY + bbox.maxY) / 2;
for (let i = 0; i < n; i++) {
  positions[i].x += offsetX;
  positions[i].y += offsetY;
}

// Centering alone leaves a loosely-packed cluster far smaller than the box
// (collision padding + a weak central pull don't compact it fully) — scale
// the whole blob up around its own center so it fills most of the working
// square instead of leaving a wide, evenly-distributed margin on every side.
bbox = boundingBox();
const FILL_RATIO = 0.92;
const fillScale = (boxSize * FILL_RATIO) / Math.max(bbox.maxX - bbox.minX, bbox.maxY - bbox.minY);
for (let i = 0; i < n; i++) {
  positions[i].x = cx + (positions[i].x - cx) * fillScale;
  positions[i].y = cy + (positions[i].y - cy) * fillScale;
  radii[i] *= fillScale;
}

// Fill luminance decides label ink so text stays legible on every hue.
function labelColorFor(hex) {
  const r = parseInt(hex.slice(1, 3), 16);
  const g = parseInt(hex.slice(3, 5), 16);
  const b = parseInt(hex.slice(5, 7), 16);
  const luminance = (0.299 * r + 0.587 * g + 0.114 * b) / 255;
  return luminance > 0.55 ? "#1A1A17" : "#FFFDF6";
}

// Lighten a hex color toward white for the radial-gradient sphere highlight.
function lighten(hex, amount) {
  const r = parseInt(hex.slice(1, 3), 16);
  const g = parseInt(hex.slice(3, 5), 16);
  const b = parseInt(hex.slice(5, 7), 16);
  const mix = (c) => Math.round(c + (255 - c) * amount);
  return `rgb(${mix(r)}, ${mix(g)}, ${mix(b)})`;
}

const LABEL_MIN_RADIUS = boxSize * 0.045;
const bubbleData = categories.map((c, i) => {
  const r = radii[i];
  const fill = t.palette[i % t.palette.length];
  // Past the first 8 categories the palette recycles hues; give that second
  // lap a dashed ring so a same-colored, unlabeled small circle stays
  // distinguishable from its first-lap sibling without relying on the label.
  const recycled = i >= t.palette.length;
  return {
    name: c.label,
    value: [positions[i].x, positions[i].y, c.value],
    symbolSize: r * 2,
    itemStyle: {
      // Subtle radial highlight (light source top-left) gives the flat fill
      // a touch of sphere-like depth instead of a plain solid disc.
      color: new echarts.graphic.RadialGradient(0.3, 0.3, 0.75, [
        { offset: 0, color: lighten(fill, 0.22) },
        { offset: 1, color: fill },
      ]),
      borderColor: t.pageBg,
      borderWidth: recycled ? 3 : 2,
      borderType: recycled ? "dashed" : "solid",
      opacity: 0.92,
    },
    label: {
      show: r > LABEL_MIN_RADIUS,
      position: "inside",
      formatter: c.label,
      color: labelColorFor(fill),
      fontSize: Math.max(11, Math.min(20, r * 0.18)),
      fontWeight: 500,
      overflow: "truncate",
      width: r * 1.7,
    },
    emphasis: { itemStyle: { opacity: 1 } },
  };
});

// --- Init ---------------------------------------------------------------
const chart = echarts.init(document.getElementById("container"));

// --- Option ---------------------------------------------------------------
chart.setOption({
  animation: false,
  backgroundColor: "transparent",
  title: {
    text: "bubble-packed · javascript · echarts · anyplot.ai",
    left: "center",
    top: Math.round(H * 0.045),
    textStyle: { color: t.ink, fontSize: 22, fontWeight: 500 },
  },
  tooltip: {
    formatter: (params) => `${params.name}<br/>$${params.value[2].toLocaleString()}M`,
    backgroundColor: t.elevatedBg,
    borderColor: t.grid,
    textStyle: { color: t.ink },
  },
  grid: { left: gridLeft, top: gridTop, width: boxSize, height: boxSize },
  xAxis: { type: "value", min: 0, max: boxSize, show: false },
  yAxis: { type: "value", min: 0, max: boxSize, show: false },
  series: [
    {
      type: "scatter",
      symbol: "circle",
      data: bubbleData,
    },
  ],
});
Runnable source as JSON, for any HTTP client: https://api.anyplot.ai/specs/bubble-packed/echarts/code. Any spec id and library id listed in llms-full.txt fit the same URL shape; every URL below is complete and callable.
{
  "spec_id": "bubble-packed",
  "language": "javascript",
  "library": "echarts",
  "page": "https://anyplot.ai/bubble-packed/javascript/echarts",
  "hub": "https://anyplot.ai/bubble-packed",
  "code_json": "https://api.anyplot.ai/specs/bubble-packed/echarts/code",
  "spec_json": "https://api.anyplot.ai/specs/bubble-packed",
  "render_light_png": "https://storage.googleapis.com/anyplot-images/plots/bubble-packed/javascript/echarts/plot-light.png",
  "render_dark_png": "https://storage.googleapis.com/anyplot-images/plots/bubble-packed/javascript/echarts/plot-dark.png",
  "interactive_light_html": "https://storage.googleapis.com/anyplot-images/plots/bubble-packed/javascript/echarts/plot-light.html",
  "interactive_dark_html": "https://storage.googleapis.com/anyplot-images/plots/bubble-packed/javascript/echarts/plot-dark.html",
  "quality_score": 87.0,
  "license": "MIT",
  "guide": "https://anyplot.ai/llms.txt"
}
Part of Basic Packed Bubble Chart on anyplot.ai.