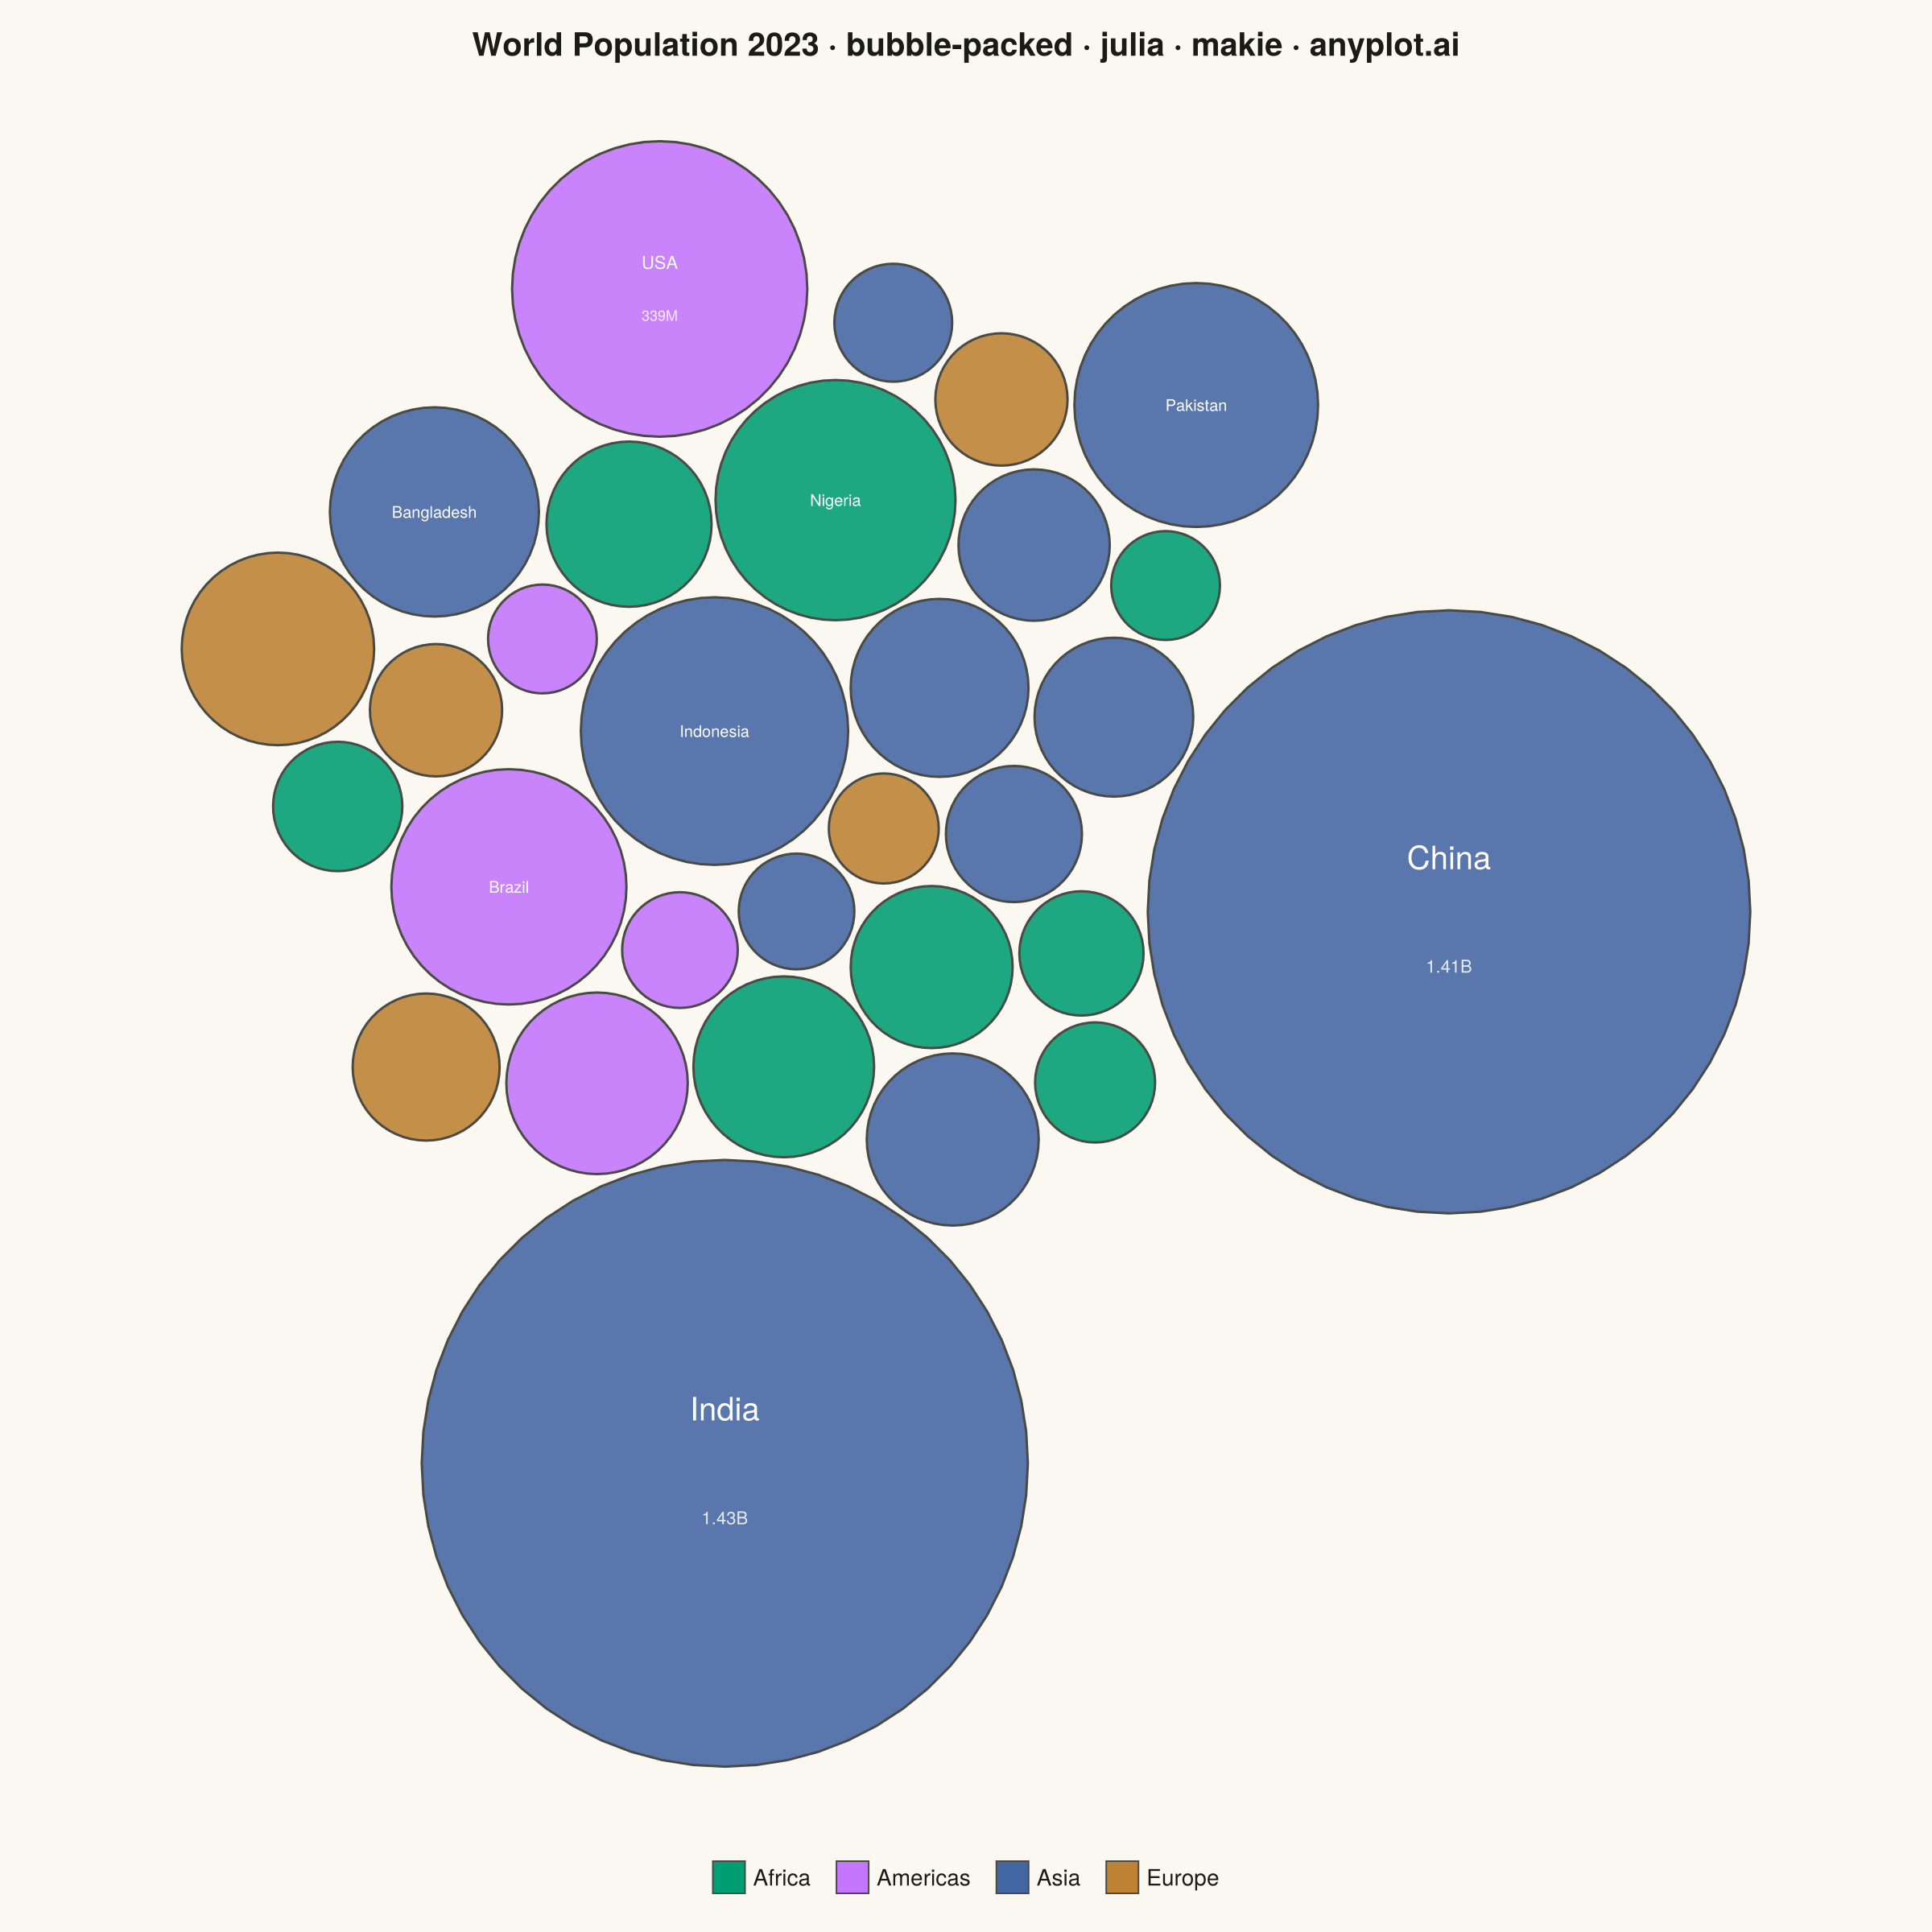
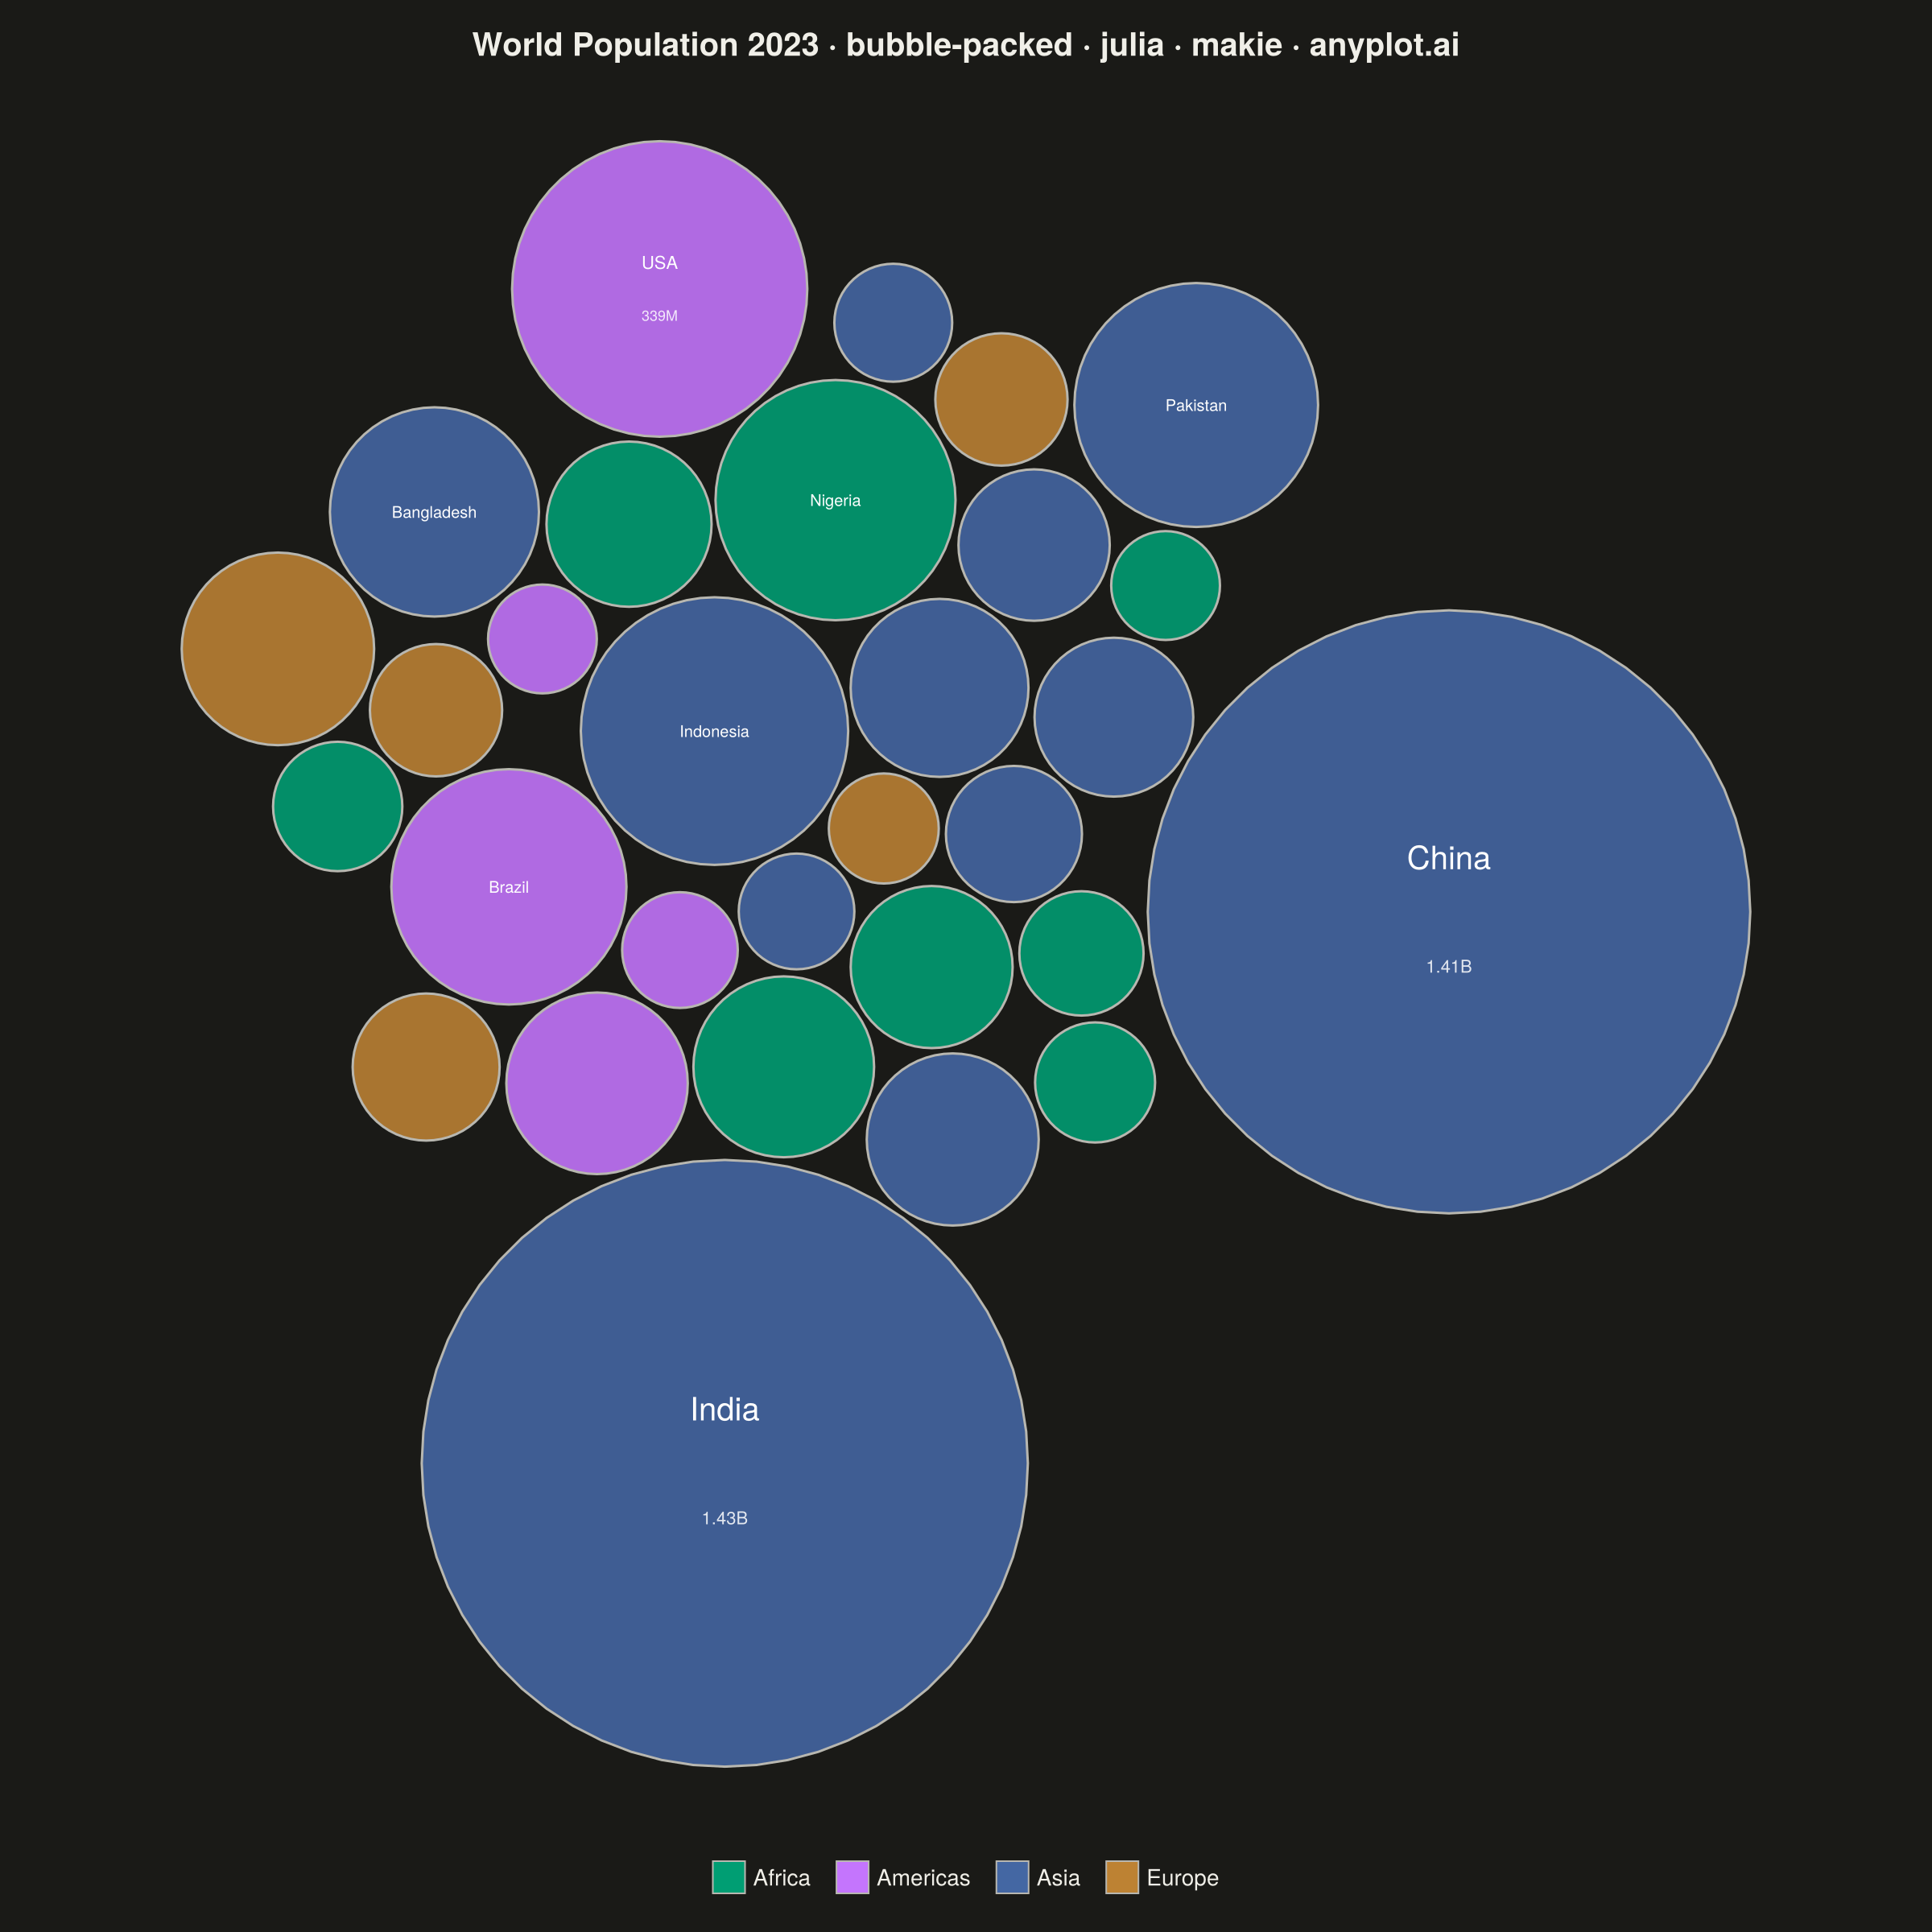
The same plot in 14 other libraries — Python: Altair, Bokeh, lets-plot, Matplotlib, Plotly, plotnine, Pygal, Seaborn; R: ggplot2; JavaScript: Chart.js, D3.js, Apache ECharts, Highcharts, MUI X Charts. Compare all 15 side by side: Basic Packed Bubble Chart in Python, R, Julia and JavaScript.
A packed bubble chart displays data as circles where size represents value, and circles are packed together without overlap using physics simulation. Unlike scatter or traditional bubble charts, position has no meaning - only size and optional grouping matter. This visualization efficiently uses space for comparing values across many categories.
# anyplot.ai
# bubble-packed: Basic Packed Bubble Chart
# Library: makie 0.22.10 | Julia 1.11.9
# Quality: 88/100 | Created: 2026-05-29

using CairoMakie
using Colors
using Random

Random.seed!(42)

# Theme tokens
const THEME       = get(ENV, "ANYPLOT_THEME", "light")
const PAGE_BG     = THEME == "light" ? colorant"#FAF8F1" : colorant"#1A1A17"
const ELEVATED_BG = THEME == "light" ? colorant"#FFFDF6" : colorant"#242420"
const INK         = THEME == "light" ? colorant"#1A1A17" : colorant"#F0EFE8"
const INK_SOFT    = THEME == "light" ? colorant"#4A4A44" : colorant"#B8B7B0"

const IMPRINT_PALETTE = [
    colorant"#009E73",  # 1 — brand green   → Africa
    colorant"#C475FD",  # 2 — lavender       → Americas
    colorant"#4467A3",  # 3 — blue           → Asia
    colorant"#BD8233",  # 4 — ochre          → Europe
]

# Data — World Population 2023 (millions), Top 30 Countries by continent
labels = [
    "India",      "China",    "USA",      "Indonesia", "Pakistan",
    "Nigeria",    "Brazil",   "Bangladesh","Russia",   "Ethiopia",
    "Mexico",     "Japan",    "Philippines","Egypt",   "DR Congo",
    "Vietnam",    "Iran",     "Germany",  "Thailand",  "UK",
    "France",     "Tanzania", "S. Africa","Kenya",    "Myanmar",
    "Colombia",   "S. Korea", "Spain",    "Argentina", "Algeria"
]

values = Float64[
    1429, 1412,  339,  278,  231,
     224,  215,  170,  144,  127,
     128,  123,  115,  106,  102,
      98,   89,   84,   72,   68,
      68,   65,   60,   56,   54,
      52,   52,   47,   46,   46
]

groups = [
    "Asia",    "Asia",    "Americas", "Asia",    "Asia",
    "Africa",  "Americas","Asia",    "Europe",  "Africa",
    "Americas","Asia",    "Asia",    "Africa",  "Africa",
    "Asia",    "Asia",    "Europe",  "Asia",    "Europe",
    "Europe",  "Africa",  "Africa",  "Africa",  "Asia",
    "Americas","Asia",    "Europe",  "Americas","Africa"
]

group_names     = ["Africa", "Americas", "Asia", "Europe"]
group_color_map = Dict(zip(group_names, IMPRINT_PALETTE))
circle_colors   = [group_color_map[g] for g in groups]

# Radii: circle area proportional to population value
max_radius = 118.0
radii = max_radius .* sqrt.(values ./ maximum(values))
n = length(labels)

# Initial positions: random spread scaled to expected packed area
init_spread = sqrt(sum(radii .^ 2)) * 0.55
positions_x = randn(n) .* init_spread
positions_y = randn(n) .* init_spread

# Force-directed circle packing — repel overlapping pairs, attract toward center
pad = 3.0
for _ in 1:6000
    for i in 1:n
        for j in (i + 1):n
            dx   = positions_x[i] - positions_x[j]
            dy   = positions_y[i] - positions_y[j]
            dist = sqrt(dx^2 + dy^2)
            min_d = radii[i] + radii[j] + pad
            if dist < min_d
                if dist < 1.0e-8
                    θr   = 2π * rand()
                    dx, dy = cos(θr), sin(θr)
                    dist  = 1.0
                end
                push_amt = (min_d - dist) / dist * 0.5
                positions_x[i] += dx * push_amt
                positions_y[i] += dy * push_amt
                positions_x[j] -= dx * push_amt
                positions_y[j] -= dy * push_amt
            end
        end
        positions_x[i] *= 0.9988
        positions_y[i] *= 0.9988
    end
end

# Center the cluster on the canvas after simulation
cx_mean = sum(positions_x) / n
cy_mean = sum(positions_y) / n
positions_x .-= cx_mean
positions_y .-= cy_mean

# Compute square axis limits that contain all circles with margin
margin   = 28.0
x_min    = minimum(positions_x .- radii) - margin
x_max    = maximum(positions_x .+ radii) + margin
y_min    = minimum(positions_y .- radii) - margin
y_max    = maximum(positions_y .+ radii) + margin
plot_cx  = (x_min + x_max) / 2
plot_cy  = (y_min + y_max) / 2
half_ext = max(x_max - x_min, y_max - y_min) / 2

# Title — 66 chars, within 67-char baseline → no fontsize reduction needed
title_str  = "World Population 2023 · bubble-packed · julia · makie · anyplot.ai"
n_title    = length(title_str)
title_size = max(14, round(Int, 20 * min(1.0, 67.0 / n_title)))

# Figure — square 1200×1200 × px_per_unit=2 → 2400×2400 final PNG
fig = Figure(
    size            = (1200, 1200),
    fontsize        = 14,
    backgroundcolor = PAGE_BG,
)

ax = Axis(
    fig[1, 1];
    title              = title_str,
    titlesize          = Float32(title_size),
    titlecolor         = INK,
    backgroundcolor    = PAGE_BG,
    aspect             = DataAspect(),
    topspinevisible    = false,
    bottomspinevisible = false,
    leftspinevisible   = false,
    rightspinevisible  = false,
    xgridvisible       = false,
    ygridvisible       = false,
    xticksvisible      = false,
    yticksvisible      = false,
    xticklabelsvisible = false,
    yticklabelsvisible = false,
)

xlims!(ax, plot_cx - half_ext, plot_cx + half_ext)
ylims!(ax, plot_cy - half_ext, plot_cy + half_ext)

# Draw packed circles — 60-point polygon per circle
θ_pts = range(0, 2π, length = 61)[1:60]
for i in 1:n
    r   = radii[i]
    pts = [Point2f(positions_x[i] + r * cos(t), positions_y[i] + r * sin(t)) for t in θ_pts]
    poly!(ax, pts; color = (circle_colors[i], 0.88), strokewidth = 1.5, strokecolor = INK_SOFT)
end

# Country labels inside circles (white text, scaled to circle size)
for i in 1:n
    r = radii[i]
    if r >= 55
        fs = clamp(round(Int, r / 6.0), 11, 20)
        # Country name shifted up to make room for population annotation
        text!(ax, positions_x[i], positions_y[i] + r * 0.18;
            text     = labels[i],
            align    = (:center, :center),
            fontsize = Float32(fs),
            color    = colorant"#FFFFFF",
        )
        # Population value annotation below the country name
        pop_str = values[i] >= 1000 ?
            string(round(values[i] / 1000; digits=2)) * "B" :
            string(round(Int, values[i])) * "M"
        text!(ax, positions_x[i], positions_y[i] - r * 0.18;
            text     = pop_str,
            align    = (:center, :center),
            fontsize = Float32(clamp(round(Int, fs * 0.72), 9, 11)),
            color    = RGBAf(1f0, 1f0, 1f0, 0.85f0),
        )
    elseif r >= 38
        text!(ax, positions_x[i], positions_y[i];
            text     = labels[i],
            align    = (:center, :center),
            fontsize = 10.0f0,
            color    = colorant"#FFFFFF",
        )
    end
end

# Continent legend — horizontal, positioned below the chart
legend_entries = [PolyElement(color = c, strokecolor = INK_SOFT, strokewidth = 1.0)
                  for c in IMPRINT_PALETTE]
Legend(
    fig[2, 1],
    legend_entries,
    group_names;
    orientation  = :horizontal,
    tellwidth    = false,
    tellheight   = true,
    framecolor   = INK_SOFT,
    framevisible    = false,
    labelcolor      = INK,
    backgroundcolor = ELEVATED_BG,
    labelsize       = 14.0f0,
    padding      = (14, 14, 8, 8),
)

rowgap!(fig.layout, 6)

save("plot-$(THEME).png", fig; px_per_unit = 2)
Runnable source as JSON, for any HTTP client: https://api.anyplot.ai/specs/bubble-packed/makie/code. Any spec id and library id listed in llms-full.txt fit the same URL shape; every URL below is complete and callable.
{
  "spec_id": "bubble-packed",
  "language": "julia",
  "library": "makie",
  "page": "https://anyplot.ai/bubble-packed/julia/makie",
  "hub": "https://anyplot.ai/bubble-packed",
  "code_json": "https://api.anyplot.ai/specs/bubble-packed/makie/code",
  "spec_json": "https://api.anyplot.ai/specs/bubble-packed",
  "render_light_png": "https://storage.googleapis.com/anyplot-images/plots/bubble-packed/julia/makie/plot-light.png",
  "render_dark_png": "https://storage.googleapis.com/anyplot-images/plots/bubble-packed/julia/makie/plot-dark.png",
  "quality_score": 88.0,
  "license": "MIT",
  "guide": "https://anyplot.ai/llms.txt"
}
Part of Basic Packed Bubble Chart on anyplot.ai.