The same plot in 14 other libraries — JavaScript: D3.js, Apache ECharts, Highcharts, MUI X Charts; Python: Altair, Bokeh, lets-plot, Matplotlib, Plotly, plotnine, Pygal, Seaborn; R: ggplot2; Julia: Makie.jl. Compare all 15 side by side: Cartogram with Area Distortion by Data Value in Python, R, Julia and JavaScript.
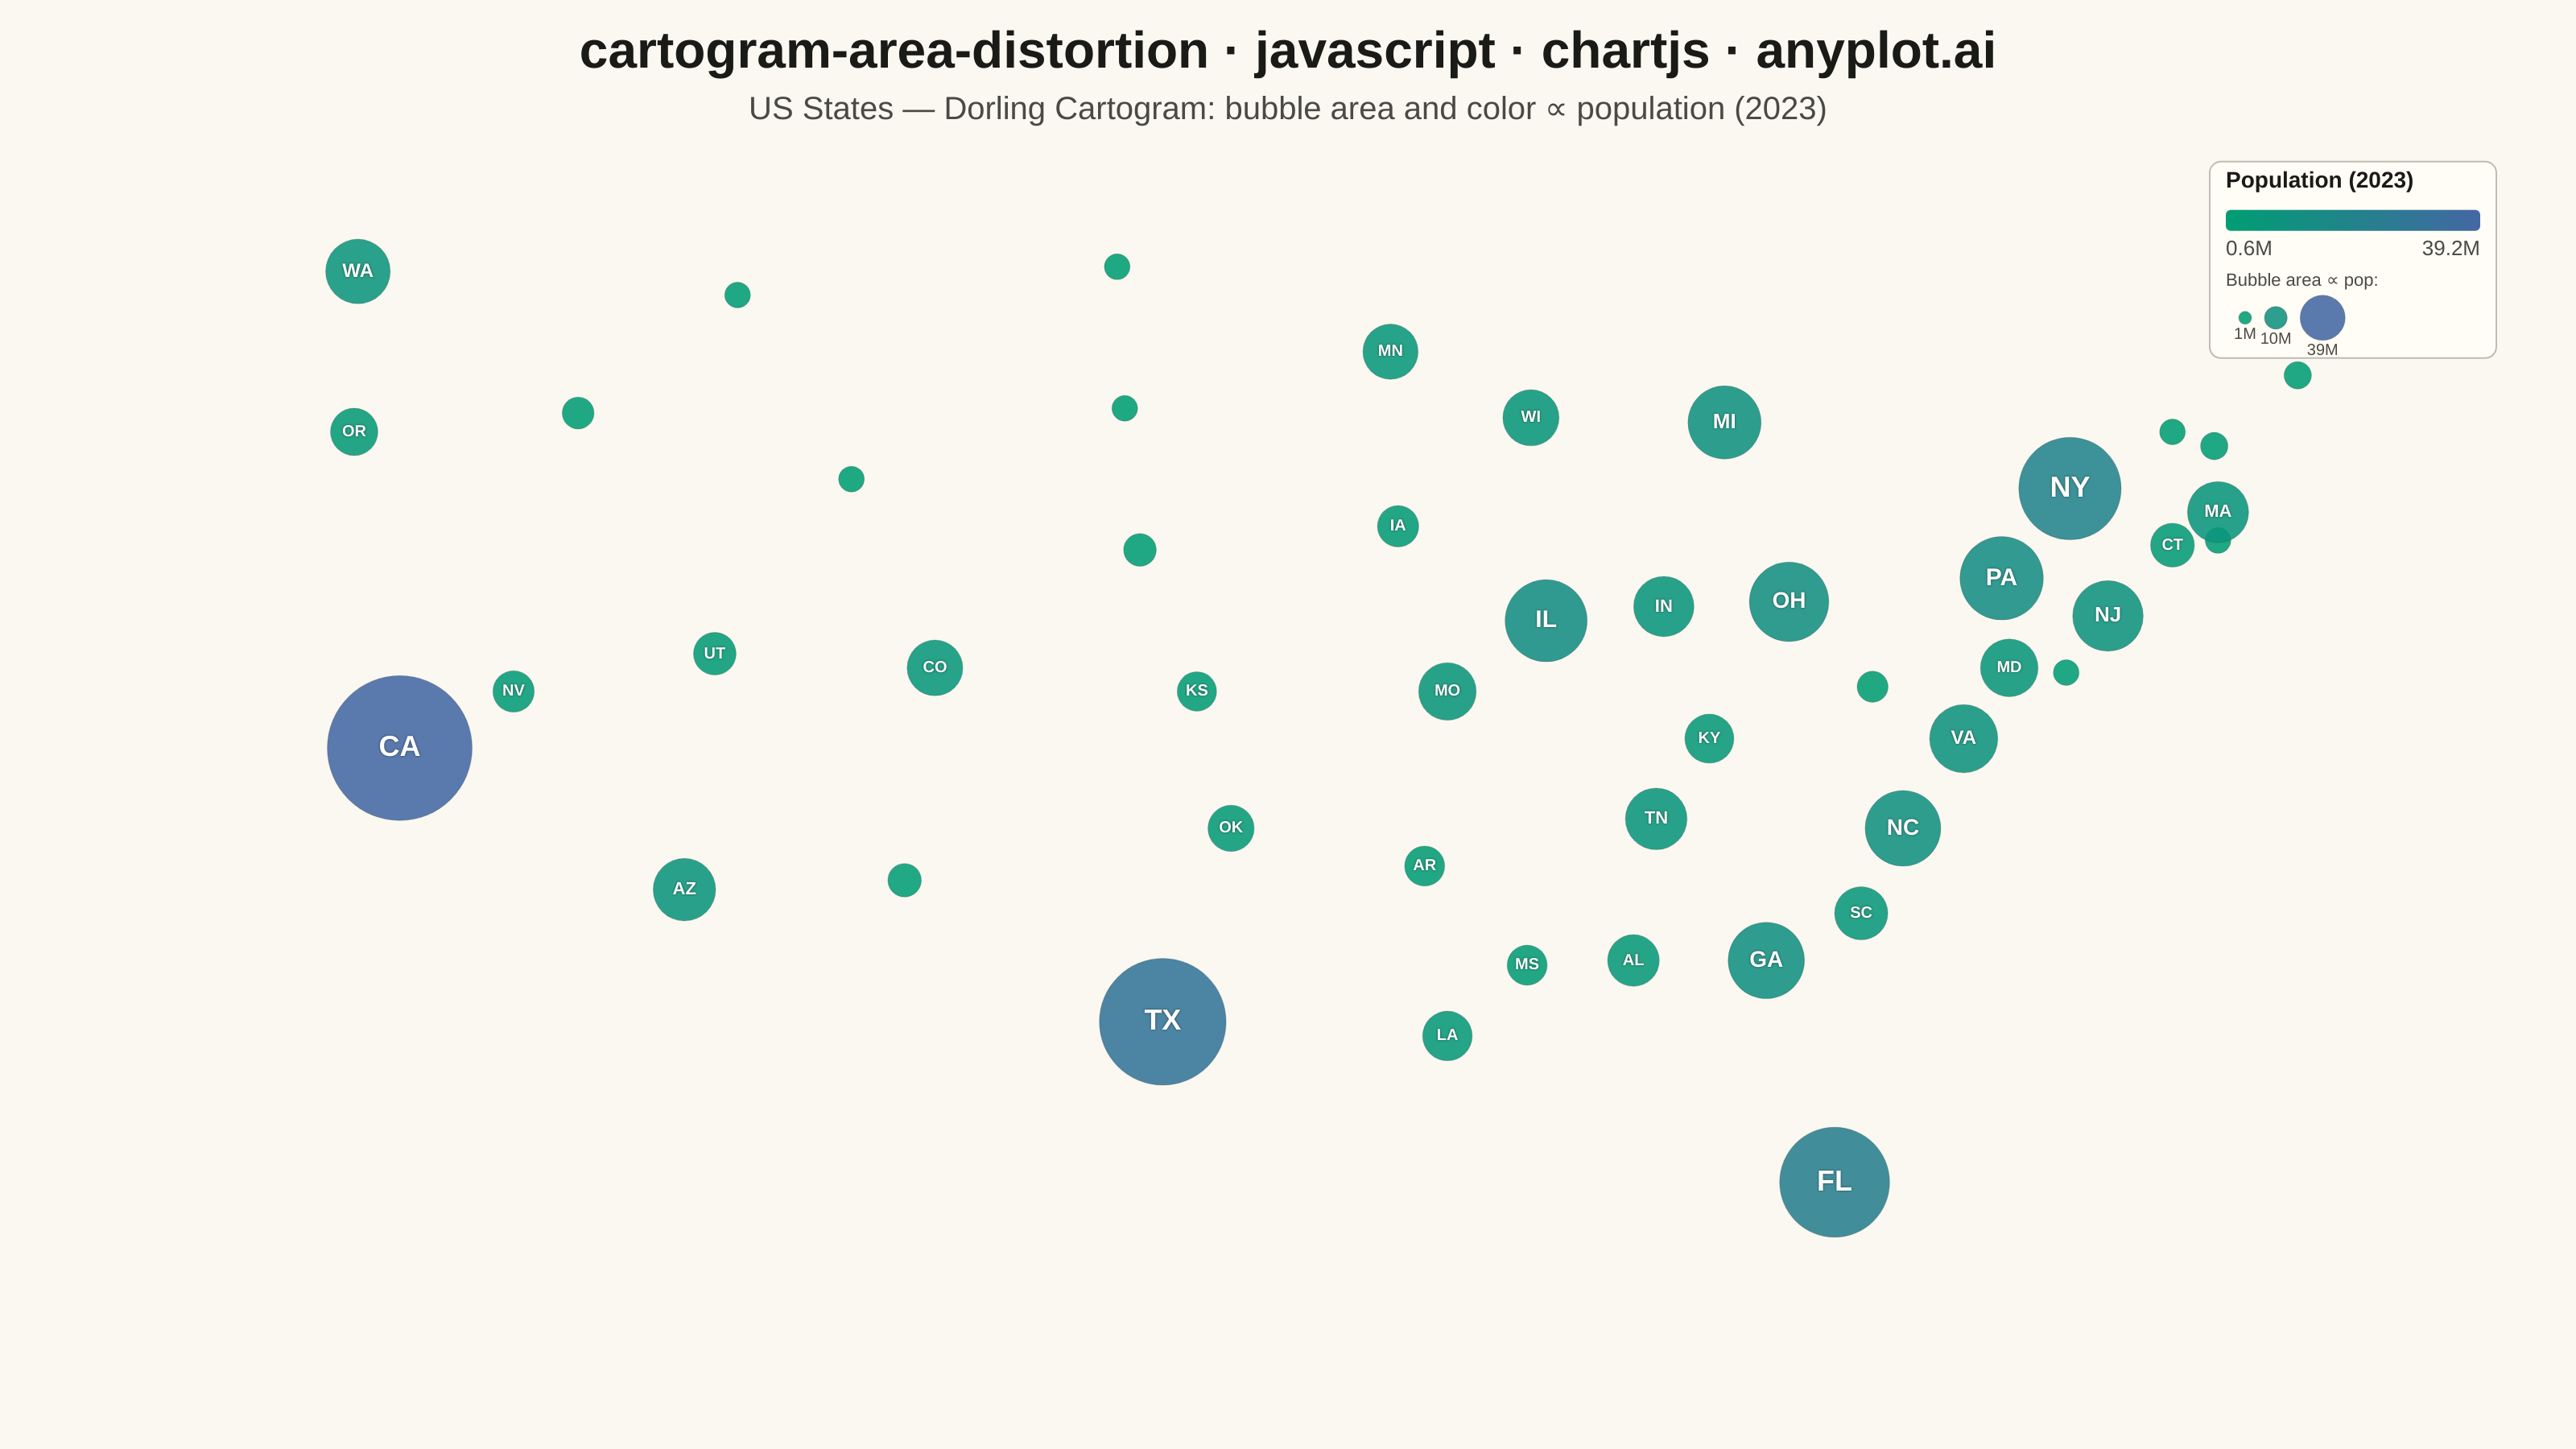
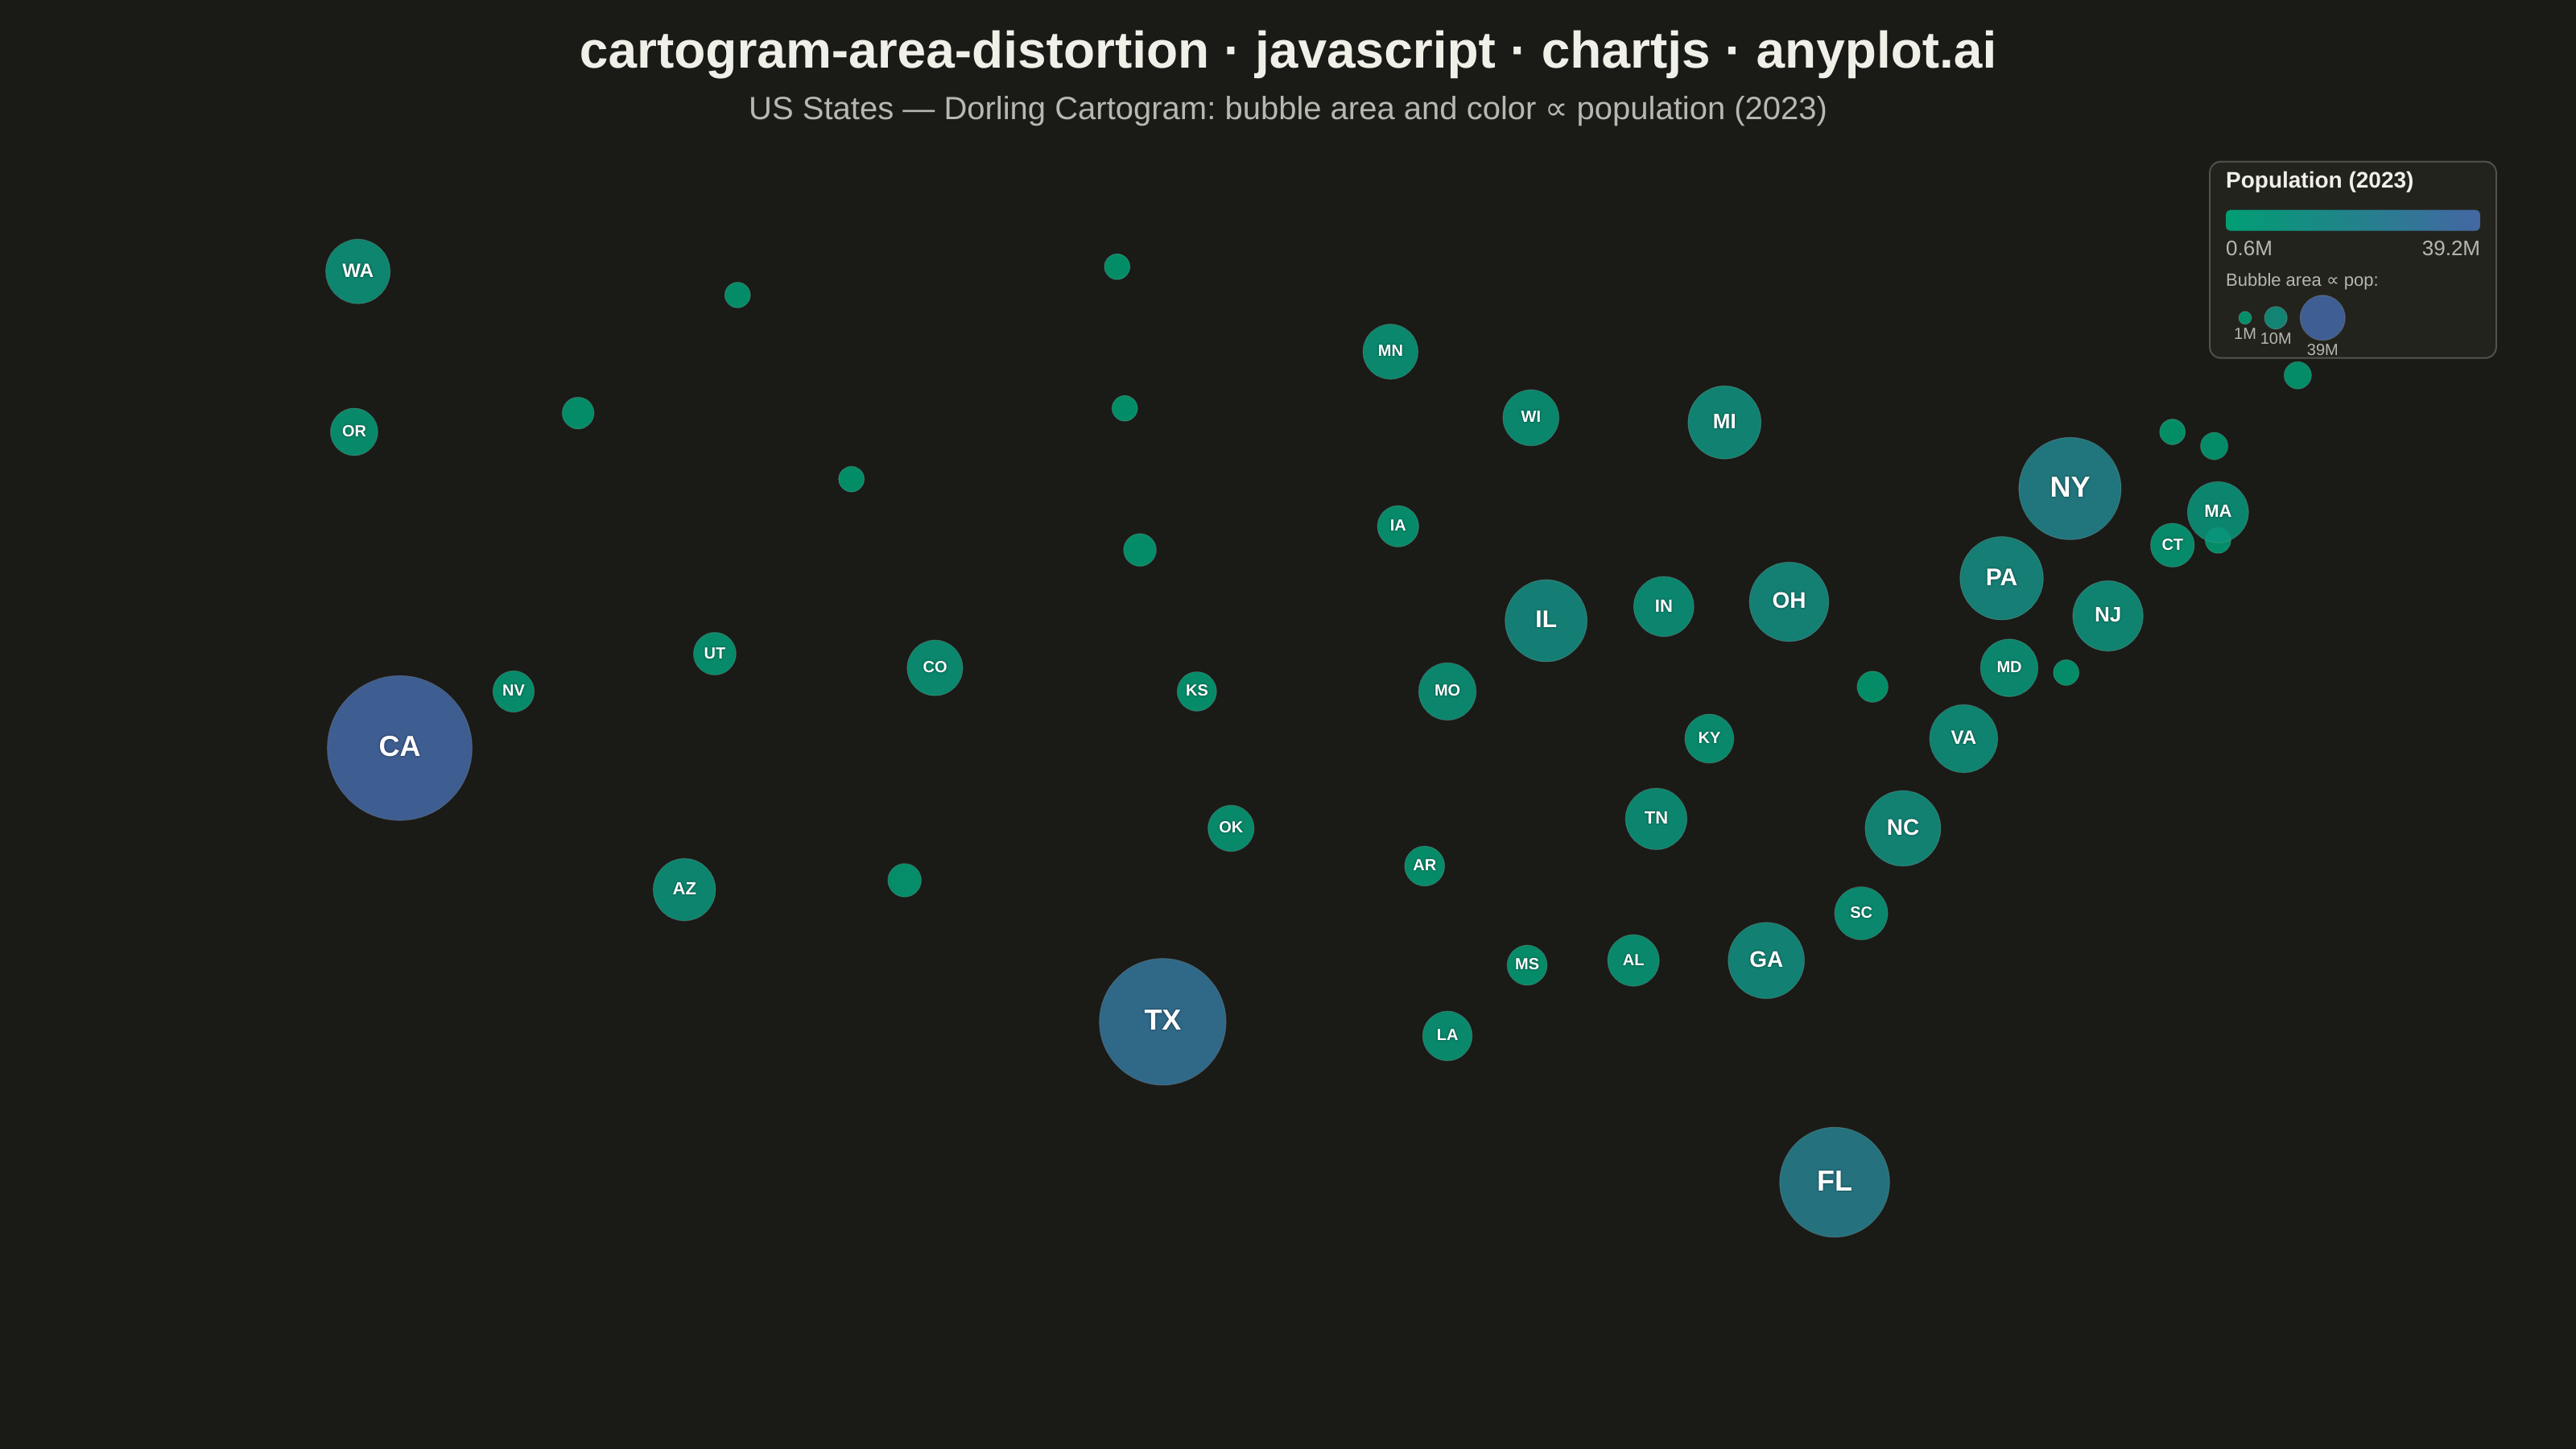
A cartogram distorts geographic regions so that their area becomes proportional to a data variable (e.g., population, GDP, election votes) rather than physical land area. This solves the classic problem of large but sparsely populated areas dominating standard maps, making it easier to compare values across regions at a glance. Contiguous cartograms preserve adjacency and rough shape of regions while rescaling them, famously used in election coverage worldwide.
// anyplot.ai
// cartogram-area-distortion: Cartogram with Area Distortion by Data Value
// Library: chartjs 4.4.7 | JavaScript 22.22.3
// Quality: 80/100 | Created: 2026-06-08
//# anyplot-orientation: landscape

const t = window.ANYPLOT_TOKENS;

function hexToRgba(hex, a) {
  const r = parseInt(hex.slice(1, 3), 16);
  const g = parseInt(hex.slice(3, 5), 16);
  const b = parseInt(hex.slice(5, 7), 16);
  return `rgba(${r},${g},${b},${a})`;
}

// Interpolate along imprint_seq: #009E73 (green) → #4467A3 (blue)
function seqColor(v) {
  const c1 = t.seq[0];
  const c2 = t.seq[1];
  const r1 = parseInt(c1.slice(1, 3), 16), g1 = parseInt(c1.slice(3, 5), 16), b1 = parseInt(c1.slice(5, 7), 16);
  const r2 = parseInt(c2.slice(1, 3), 16), g2 = parseInt(c2.slice(3, 5), 16), b2 = parseInt(c2.slice(5, 7), 16);
  return `rgba(${Math.round(r1 + (r2 - r1) * v)},${Math.round(g1 + (g2 - g1) * v)},${Math.round(b1 + (b2 - b1) * v)},0.88)`;
}

// US contiguous 48 states: [abbr, longitude, latitude, population_millions_2023]
const stateRaw = [
  ["AL", -86.9, 32.8, 5.0],  ["AZ", -111.9, 34.3, 7.3],  ["AR", -92.4, 34.8, 3.0],
  ["CA", -119.4, 37.3, 39.2], ["CO", -105.3, 39.0, 5.8],  ["CT", -72.7, 41.6, 3.6],
  ["DE", -75.5, 38.9, 1.0],  ["FL", -81.6, 28.1, 22.6],  ["GA", -83.4, 32.8, 10.9],
  ["ID", -114.7, 44.4, 1.9], ["IL", -89.2, 40.0, 12.6],  ["IN", -86.1, 40.3, 6.8],
  ["IA", -93.1, 42.0, 3.2],  ["KS", -98.4, 38.5, 2.9],   ["KY", -84.9, 37.5, 4.5],
  ["LA", -91.8, 31.2, 4.6],  ["ME", -69.4, 45.2, 1.4],   ["MD", -77.0, 39.0, 6.2],
  ["MA", -71.5, 42.3, 7.0],  ["MI", -84.5, 44.2, 10.0],  ["MN", -93.3, 45.7, 5.7],
  ["MS", -89.7, 32.7, 3.0],  ["MO", -91.8, 38.5, 6.2],   ["MT", -110.5, 46.9, 1.1],
  ["NE", -99.9, 41.5, 2.0],  ["NV", -116.4, 38.5, 3.2],  ["NH", -71.6, 43.7, 1.4],
  ["NJ", -74.4, 40.1, 9.3],  ["NM", -106.1, 34.5, 2.1],  ["NY", -75.4, 42.8, 19.6],
  ["NC", -79.8, 35.6, 10.7], ["ND", -100.5, 47.5, 0.8],  ["OH", -82.8, 40.4, 11.8],
  ["OK", -97.5, 35.6, 4.0],  ["OR", -120.6, 44.0, 4.2],  ["PA", -77.2, 40.9, 13.0],
  ["RI", -71.5, 41.7, 1.1],  ["SC", -80.9, 33.8, 5.3],   ["SD", -100.3, 44.5, 0.9],
  ["TN", -86.3, 35.8, 7.1],  ["TX", -99.3, 31.5, 30.0],  ["UT", -111.1, 39.3, 3.4],
  ["VT", -72.7, 44.0, 0.6],  ["VA", -78.2, 37.5, 8.7],   ["WA", -120.5, 47.4, 7.8],
  ["WV", -80.6, 38.6, 1.8],  ["WI", -89.6, 44.3, 5.9],   ["WY", -107.5, 43.0, 0.6],
];

const maxPop = Math.max(...stateRaw.map(d => d[3]));
const minPop = Math.min(...stateRaw.map(d => d[3]));
const R_MAX = 45;

const points = stateRaw.map(([abbr, lon, lat, pop]) => ({
  x: lon,
  y: lat,
  r: Math.max(8, R_MAX * Math.sqrt(pop / maxPop)),  // floor at 8 so tiny states remain identifiable
  label: abbr,
  pop,
  norm: (pop - minPop) / (maxPop - minPop),
}));

// Ascending order: small states render first, large states on top — prevents large bubbles occluding small neighbours
const sortedPoints = [...points].sort((a, b) => a.pop - b.pop);

const canvas = document.createElement("canvas");
document.getElementById("container").appendChild(canvas);

// Draw state abbreviations centred inside each bubble
const labelPlugin = {
  id: "stateLabels",
  afterDatasetsDraw(chart) {
    const ctx = chart.ctx;
    const meta = chart.getDatasetMeta(0);
    const ds = chart.data.datasets[0];
    ctx.save();
    ctx.textAlign = "center";
    ctx.textBaseline = "middle";
    meta.data.forEach((pt, i) => {
      const { r, label } = ds.data[i];
      if (r < 12) return;
      const fs = Math.max(10, Math.min(Math.round(r * 0.58), 18));
      ctx.font = `bold ${fs}px sans-serif`;
      ctx.shadowColor = "rgba(0,0,0,0.55)";
      ctx.shadowBlur = 3;
      ctx.fillStyle = "#FFFFFF";
      ctx.fillText(label, pt.x, pt.y);
    });
    ctx.restore();
  },
};

// Gradient colour legend + bubble-size reference (top-right corner)
const gradientLegendPlugin = {
  id: "gradientLegend",
  afterDraw(chart) {
    const ctx = chart.ctx;
    const { right, top } = chart.chartArea;
    ctx.save();
    ctx.shadowColor = "transparent";
    ctx.shadowBlur = 0;

    const lw = 158;
    const lx = right - lw - 14;
    const ly = top + 14;

    // Box background (tall enough for gradient + size reference)
    ctx.fillStyle = hexToRgba(t.elevatedBg, 0.92);
    ctx.strokeStyle = hexToRgba(t.inkSoft, 0.35);
    ctx.lineWidth = 1;
    ctx.beginPath();
    ctx.roundRect(lx - 10, ly - 6, lw + 20, 122, 7);
    ctx.fill();
    ctx.stroke();

    // Title
    ctx.fillStyle = t.ink;
    ctx.font = "bold 14px sans-serif";
    ctx.textAlign = "left";
    ctx.fillText("Population (2023)", lx, ly + 10);

    // Gradient bar
    const barH = 13;
    const barY = ly + 24;
    const grad = ctx.createLinearGradient(lx, 0, lx + lw, 0);
    grad.addColorStop(0, t.seq[0]);
    grad.addColorStop(1, t.seq[1]);
    ctx.fillStyle = grad;
    ctx.beginPath();
    ctx.roundRect(lx, barY, lw, barH, 3);
    ctx.fill();

    // Min / max labels
    ctx.fillStyle = t.inkSoft;
    ctx.font = "13px sans-serif";
    ctx.textAlign = "left";
    ctx.fillText(`${minPop.toFixed(1)}M`, lx, barY + barH + 15);
    ctx.textAlign = "right";
    ctx.fillText(`${maxPop.toFixed(1)}M`, lx + lw, barY + barH + 15);

    // Size reference header
    ctx.fillStyle = t.inkSoft;
    ctx.font = "11px sans-serif";
    ctx.textAlign = "left";
    ctx.fillText("Bubble area ∝ pop:", lx, barY + barH + 34);

    // Reference circles at three population benchmarks, coloured by the same gradient
    const sizeRefs = [
      { pop: 1,      label: "1M",                 norm: (1 - minPop) / (maxPop - minPop) },
      { pop: 10,     label: "10M",                norm: (10 - minPop) / (maxPop - minPop) },
      { pop: maxPop, label: `${maxPop.toFixed(0)}M`, norm: 1 },
    ];
    const refScale = 14; // max reference circle radius (CSS px) corresponds to maxPop
    const sizeY = barY + barH + 54;

    let refX = lx;
    sizeRefs.forEach(({ pop, label, norm }) => {
      const r = Math.max(4, refScale * Math.sqrt(pop / maxPop));
      const cx = refX + 8 + r;
      ctx.fillStyle = seqColor(norm);
      ctx.beginPath();
      ctx.arc(cx, sizeY, r, 0, Math.PI * 2);
      ctx.fill();
      ctx.strokeStyle = hexToRgba(t.inkSoft, 0.3);
      ctx.lineWidth = 0.5;
      ctx.stroke();
      ctx.fillStyle = t.inkSoft;
      ctx.font = "10px sans-serif";
      ctx.textAlign = "center";
      ctx.fillText(label, cx, sizeY + r + 9);
      refX = cx + r;
    });

    ctx.restore();
  },
};

new Chart(canvas, {
  type: "bubble",
  plugins: [labelPlugin, gradientLegendPlugin],
  data: {
    datasets: [{
      label: "Population",
      data: sortedPoints,
      backgroundColor: sortedPoints.map(p => seqColor(p.norm)),
      borderColor: sortedPoints.map(p => hexToRgba(t.inkSoft, 0.25)),
      borderWidth: 0.5,
    }],
  },
  options: {
    responsive: true,
    maintainAspectRatio: false,
    animation: false,
    plugins: {
      title: {
        display: true,
        text: "cartogram-area-distortion · javascript · chartjs · anyplot.ai",
        color: t.ink,
        font: { size: 32, weight: "bold" },
        padding: { top: 14, bottom: 4 },
      },
      subtitle: {
        display: true,
        text: "US States — Dorling Cartogram: bubble area and color ∝ population (2023)",
        color: t.inkSoft,
        font: { size: 20 },
        padding: { bottom: 12 },
      },
      legend: { display: false },
      tooltip: {
        backgroundColor: hexToRgba(t.elevatedBg, 0.95),
        titleColor: t.ink,
        bodyColor: t.inkSoft,
        borderColor: hexToRgba(t.inkSoft, 0.4),
        borderWidth: 1,
        callbacks: {
          title: ctx => ctx[0].raw.label,
          label: ctx => `Population: ${ctx.raw.pop.toFixed(1)}M`,
        },
      },
    },
    scales: {
      x: {
        type: "linear",
        min: -128,
        max: -64,
        ticks: { display: false },
        grid: { display: false },
        border: { display: false },
      },
      y: {
        type: "linear",
        min: 24,
        max: 50,
        ticks: { display: false },
        grid: { display: false },
        border: { display: false },
      },
    },
  },
});
Runnable source as JSON, for any HTTP client: https://api.anyplot.ai/specs/cartogram-area-distortion/chartjs/code. Any spec id and library id listed in llms-full.txt fit the same URL shape; every URL below is complete and callable.
{
  "spec_id": "cartogram-area-distortion",
  "language": "javascript",
  "library": "chartjs",
  "page": "https://anyplot.ai/cartogram-area-distortion/javascript/chartjs",
  "hub": "https://anyplot.ai/cartogram-area-distortion",
  "code_json": "https://api.anyplot.ai/specs/cartogram-area-distortion/chartjs/code",
  "spec_json": "https://api.anyplot.ai/specs/cartogram-area-distortion",
  "render_light_png": "https://storage.googleapis.com/anyplot-images/plots/cartogram-area-distortion/javascript/chartjs/plot-light.png",
  "render_dark_png": "https://storage.googleapis.com/anyplot-images/plots/cartogram-area-distortion/javascript/chartjs/plot-dark.png",
  "interactive_light_html": "https://storage.googleapis.com/anyplot-images/plots/cartogram-area-distortion/javascript/chartjs/plot-light.html",
  "interactive_dark_html": "https://storage.googleapis.com/anyplot-images/plots/cartogram-area-distortion/javascript/chartjs/plot-dark.html",
  "quality_score": 80.0,
  "license": "MIT",
  "guide": "https://anyplot.ai/llms.txt"
}
Part of Cartogram with Area Distortion by Data Value on anyplot.ai.