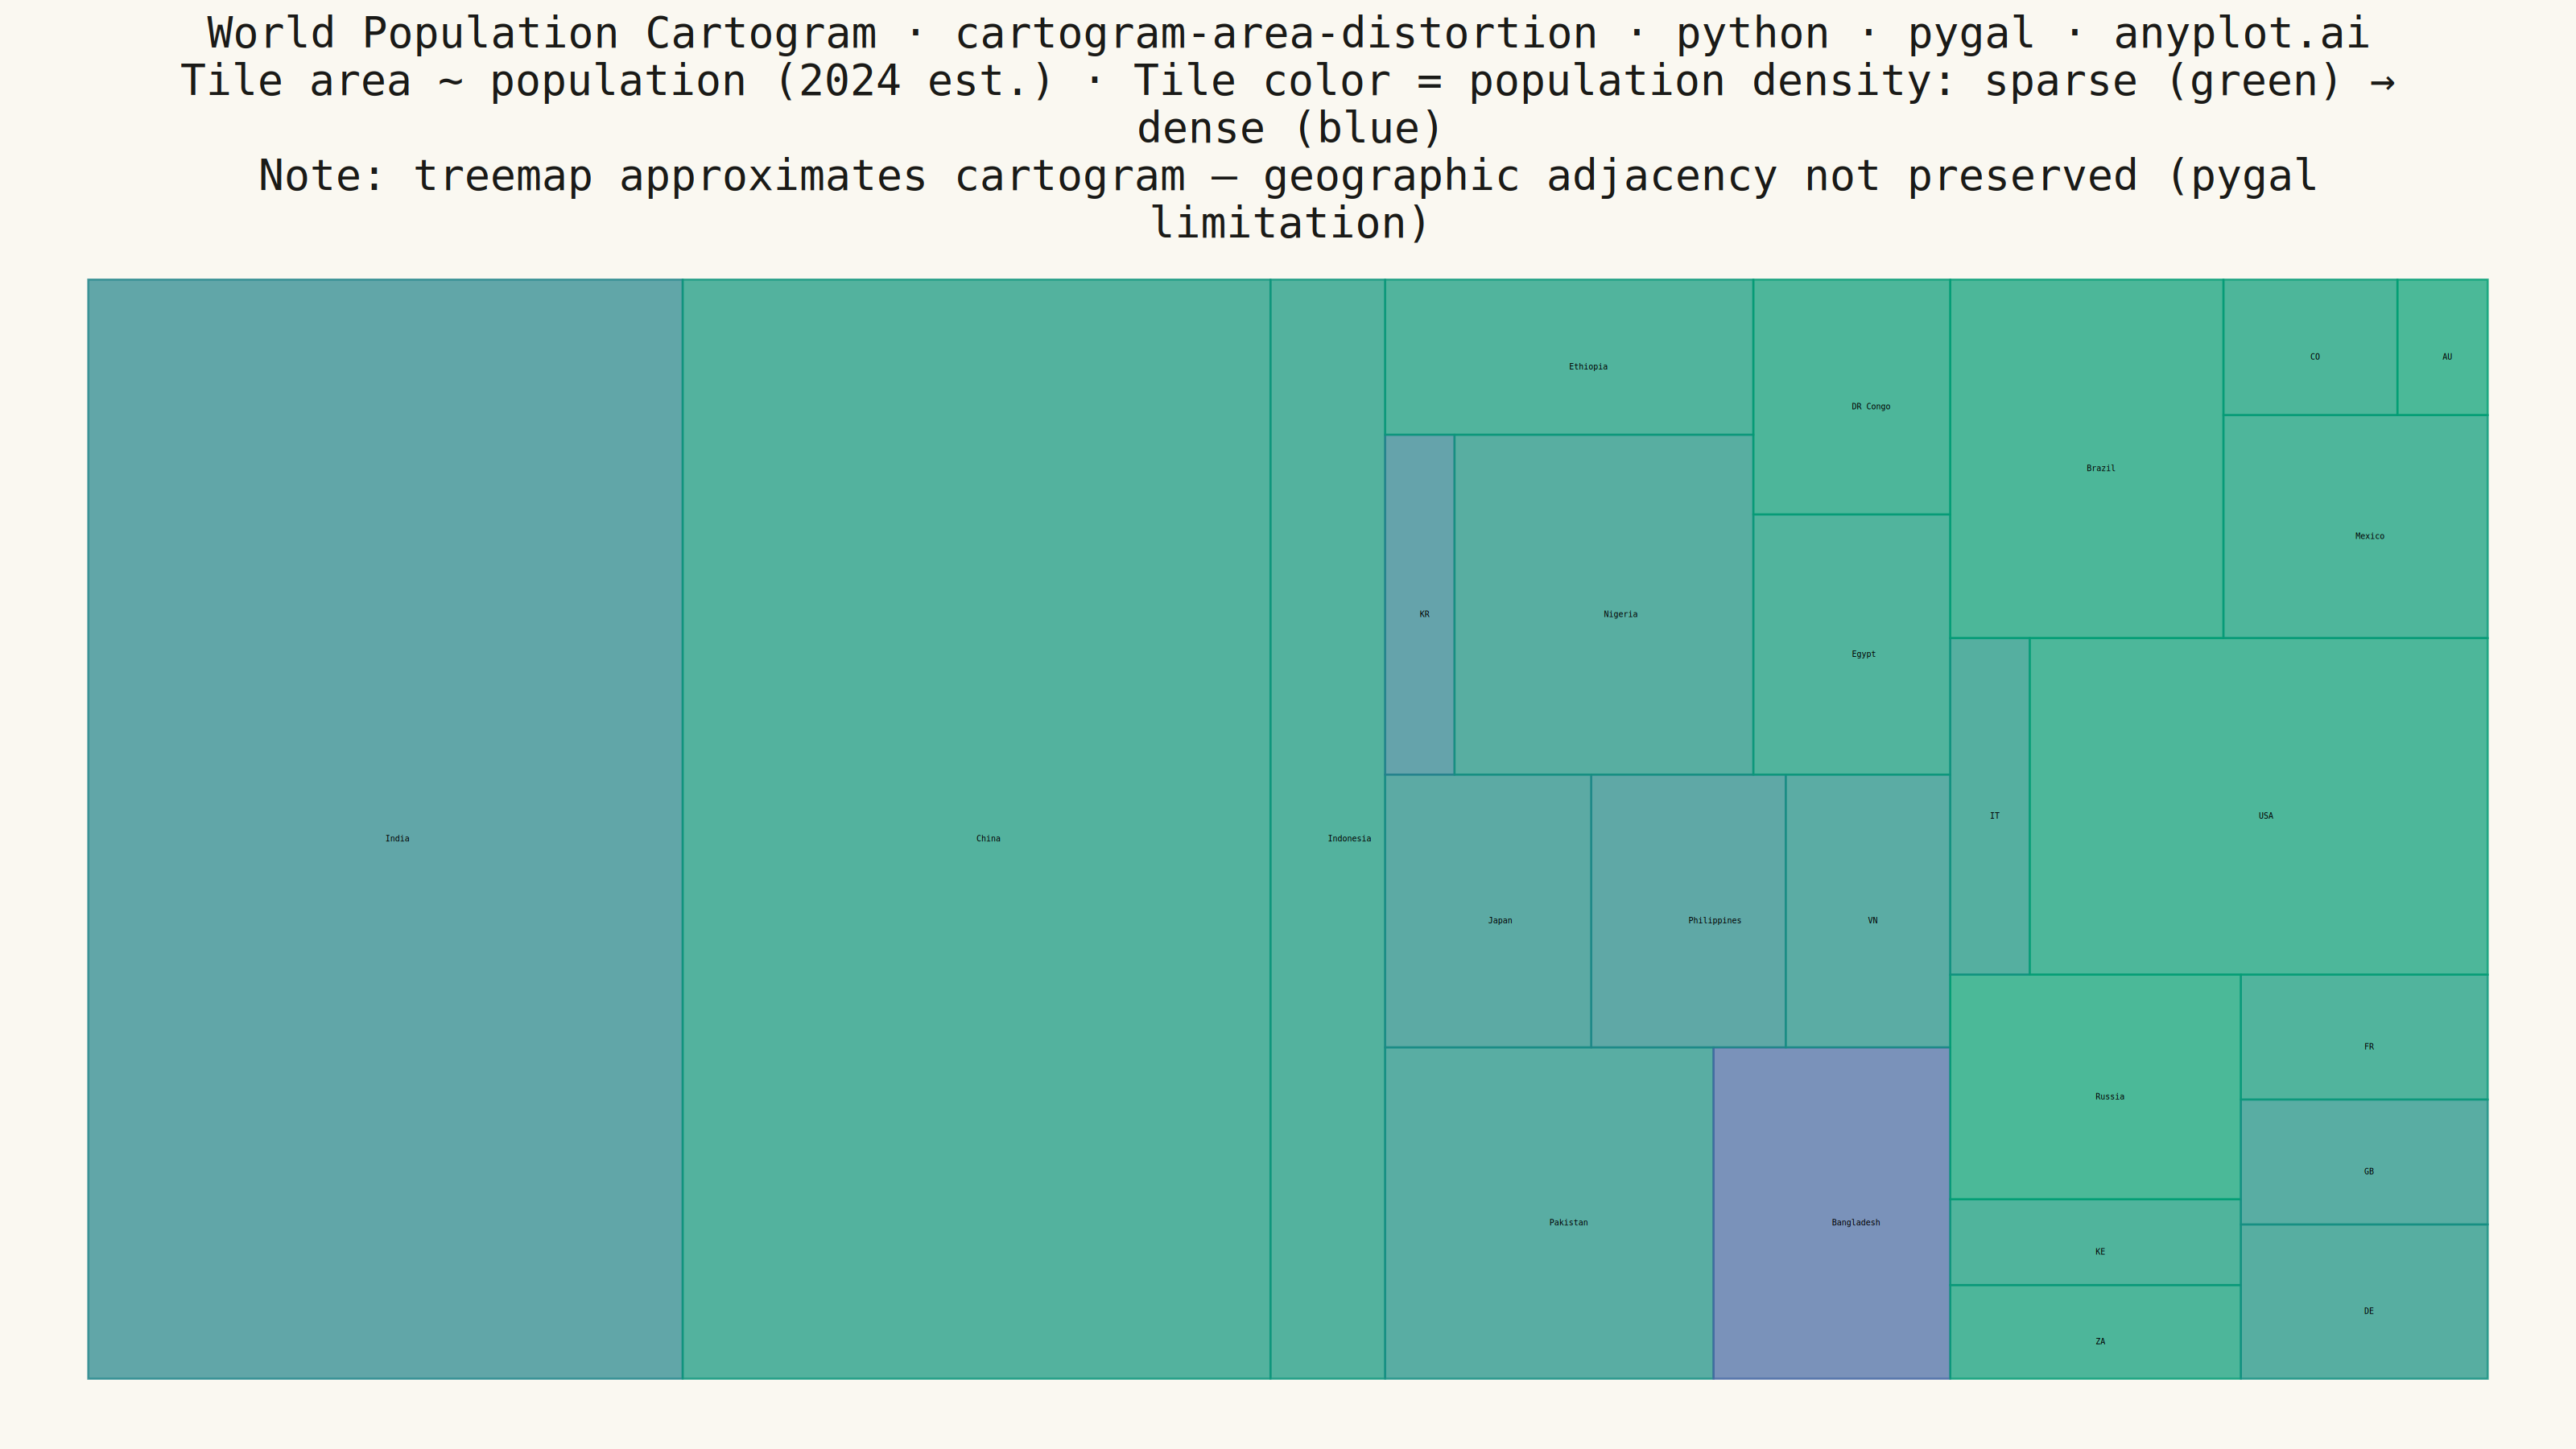
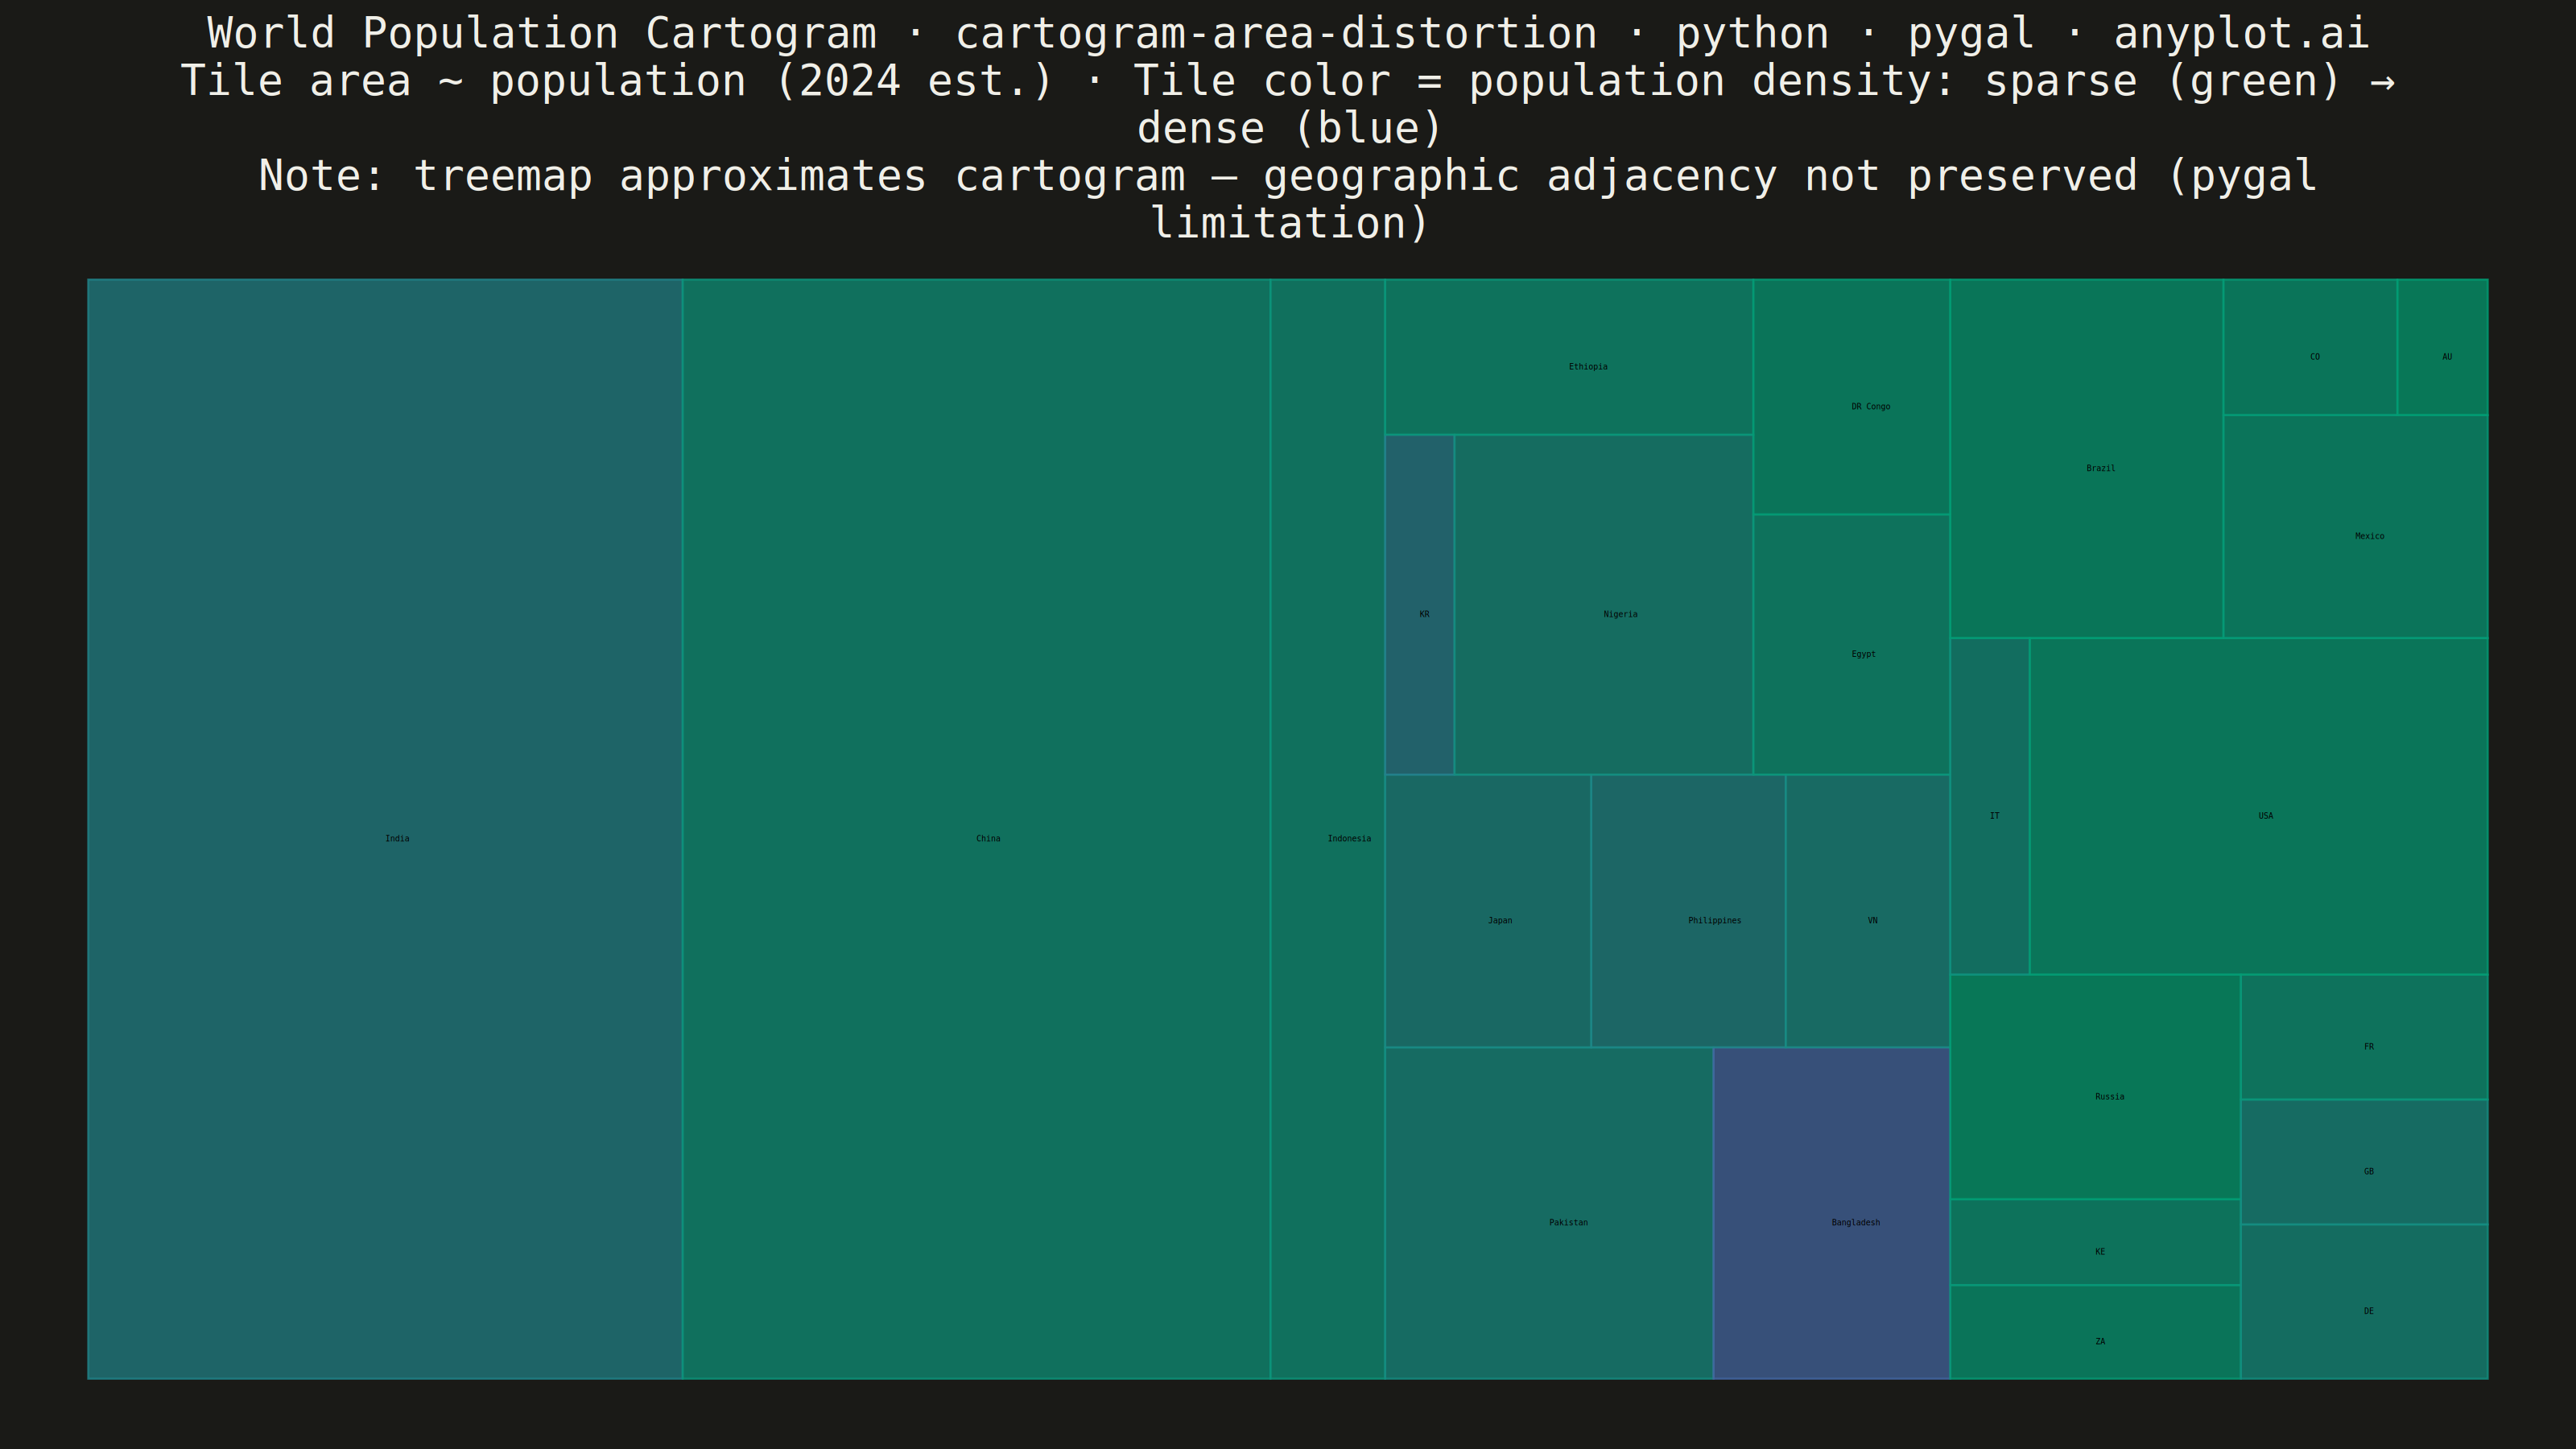
A cartogram distorts geographic regions so that their area becomes proportional to a data variable (e.g., population, GDP, election votes) rather than physical land area. This solves the classic problem of large but sparsely populated areas dominating standard maps, making it easier to compare values across regions at a glance. Contiguous cartograms preserve adjacency and rough shape of regions while rescaling them, famously used in election coverage worldwide.
""" anyplot.ai
cartogram-area-distortion: Cartogram with Area Distortion by Data Value
Library: pygal 3.1.0 | Python 3.13.13
Quality: 78/100 | Updated: 2026-06-08
"""

import math
import os
import sys


# Remove the script's own directory from sys.path so that `import pygal` finds
# the installed package rather than this file (which shares the package name).
_here = os.path.abspath(os.path.dirname(os.path.abspath(__file__)))
sys.path[:] = [p for p in sys.path if p and os.path.abspath(p) != _here]
del _here

import pygal
from pygal.style import Style


# Theme tokens — theme-adaptive chrome
THEME = os.getenv("ANYPLOT_THEME", "light")
PAGE_BG = "#FAF8F1" if THEME == "light" else "#1A1A17"
INK = "#1A1A17" if THEME == "light" else "#F0EFE8"
INK_MUTED = "#6B6A63" if THEME == "light" else "#A8A79F"

# Imprint sequential: low population density (green) → high density (blue)
DENSITY_LOW = "#009E73"
DENSITY_HIGH = "#4467A3"


def _lerp_hex(c0, c1, t):
    r0, g0, b0 = (int(c0[i : i + 2], 16) for i in (1, 3, 5))
    r1, g1, b1 = (int(c1[i : i + 2], 16) for i in (1, 3, 5))
    r, g, b = (int(round(a + (b - a) * t)) for a, b in ((r0, r1), (g0, g1), (b0, b1)))
    return f"#{r:02X}{g:02X}{b:02X}"


SHORT_LABELS = {
    "S. Korea": "KR",
    "Colombia": "CO",
    "Australia": "AU",
    "Vietnam": "VN",
    "Kenya": "KE",
    "S. Africa": "ZA",
    "Italy": "IT",
    "UK": "GB",
    "Germany": "DE",
    "France": "FR",
    "Japan": "JP",
    "Philippines": "PH",
    "Bangladesh": "BD",
}
ABBREV_THRESHOLD = 100  # million

# Countries grouped by continent: (population millions, land area thousand km², 2024 est.)
# Distortion ratio = pop_share / area_share: >1 means the region GROWS vs geographic map.
regions = {
    "Asia": {
        "India": (1441, 3287),
        "China": (1425, 9597),
        "Indonesia": (278, 1905),
        "Pakistan": (240, 882),
        "Bangladesh": (173, 148),
        "Japan": (124, 378),
        "Philippines": (117, 300),
        "Vietnam": (99, 331),
        "S. Korea": (52, 100),
    },
    "Africa": {
        "Nigeria": (224, 924),
        "Ethiopia": (126, 1104),
        "Egypt": (113, 1001),
        "DR Congo": (102, 2345),
        "S. Africa": (60, 1221),
        "Kenya": (55, 580),
    },
    "Europe": {"Russia": (144, 17098), "Germany": (84, 357), "UK": (68, 244), "France": (68, 640), "Italy": (59, 301)},
    "Americas": {"USA": (340, 9834), "Brazil": (216, 8516), "Mexico": (130, 1964), "Colombia": (52, 1139)},
    "Oceania": {"Australia": (27, 7692)},
}

total_pop = sum(pop for cont in regions.values() for pop, _ in cont.values())
total_area = sum(area for cont in regions.values() for _, area in cont.values())

# Flat list preserving continent order so colours cycle meaningfully
all_items = [(cont, name, pop, area) for cont, countries in regions.items() for name, (pop, area) in countries.items()]

# Log-scaled density for perceptually balanced gradient (linear would crowd low end)
log_densities = [math.log1p(pop / area) for _, _, pop, area in all_items]
min_ld, max_ld = min(log_densities), max(log_densities)

tile_colors = tuple(
    _lerp_hex(DENSITY_LOW, DENSITY_HIGH, (math.log1p(pop / area) - min_ld) / (max_ld - min_ld))
    for _, _, pop, area in all_items
)

title = "World Population Cartogram · cartogram-area-distortion · python · pygal · anyplot.ai"
subtitle = (
    "Tile area ~ population (2024 est.) · Tile color = population density: sparse (green) → dense (blue)"
    "\nNote: treemap approximates cartogram — geographic adjacency not preserved (pygal limitation)"
)
title_fontsize = max(44, round(66 * 67 / len(title)))

custom_style = Style(
    background=PAGE_BG,
    plot_background=PAGE_BG,
    foreground=INK,
    foreground_strong=INK,
    foreground_subtle=INK_MUTED,
    colors=tile_colors,
    title_font_size=title_fontsize,
    label_font_size=56,
    major_label_font_size=44,
    legend_font_size=36,
    value_font_size=46,
    stroke_width=2.5,
)

# Per-country series: one series per country so each tile gets its own density colour.
# 27 series → legend disabled (27-item legend would dominate the canvas); colour
# encoding and geographic note explained in the subtitle instead.
treemap = pygal.Treemap(
    style=custom_style,
    width=3200,
    height=1800,
    title=f"{title}\n{subtitle}",
    show_legend=False,
    print_labels=True,
    print_values=False,
    margin=50,
    margin_bottom=60,
    margin_top=25,
    margin_left=50,
    margin_right=50,
    truncate_label=-1,
    spacing=6,
    rounded_corners=4,
)

for cont, name, pop, area in all_items:
    pop_share = pop / total_pop
    area_share = area / total_area
    ratio = pop_share / area_share
    density = pop / area
    label = SHORT_LABELS.get(name, name) if pop < ABBREV_THRESHOLD else name
    treemap.add(
        f"{name} ({cont})",
        [
            {
                "value": pop,
                "label": label,
                "formatter": lambda x, n=name, r=ratio, c=cont, d=density: (
                    f"{n} ({c}): {x:,.0f}M pop · ×{r:.1f} vs map · {d:.1f} pop/1000 km²"
                ),
            }
        ],
    )

# Save PNG and interactive HTML
treemap.render_to_png(f"plot-{THEME}.png")
with open(f"plot-{THEME}.html", "wb") as f:
    f.write(treemap.render())
Runnable source as JSON, for any HTTP client: https://api.anyplot.ai/specs/cartogram-area-distortion/pygal/code. Any spec id and library id listed in llms-full.txt fit the same URL shape; every URL below is complete and callable.
{
  "spec_id": "cartogram-area-distortion",
  "language": "python",
  "library": "pygal",
  "page": "https://anyplot.ai/cartogram-area-distortion/python/pygal",
  "hub": "https://anyplot.ai/cartogram-area-distortion",
  "code_json": "https://api.anyplot.ai/specs/cartogram-area-distortion/pygal/code",
  "spec_json": "https://api.anyplot.ai/specs/cartogram-area-distortion",
  "render_light_png": "https://storage.googleapis.com/anyplot-images/plots/cartogram-area-distortion/python/pygal/plot-light.png",
  "render_dark_png": "https://storage.googleapis.com/anyplot-images/plots/cartogram-area-distortion/python/pygal/plot-dark.png",
  "interactive_light_html": "https://storage.googleapis.com/anyplot-images/plots/cartogram-area-distortion/python/pygal/plot-light.html",
  "interactive_dark_html": "https://storage.googleapis.com/anyplot-images/plots/cartogram-area-distortion/python/pygal/plot-dark.html",
  "quality_score": 78.0,
  "license": "MIT",
  "guide": "https://anyplot.ai/llms.txt"
}
Part of Cartogram with Area Distortion by Data Value on anyplot.ai.