The same plot in 14 other libraries — JavaScript: Chart.js, D3.js, Highcharts, MUI X Charts; Python: Altair, Bokeh, lets-plot, Matplotlib, Plotly, plotnine, Pygal, Seaborn; R: ggplot2; Julia: Makie.jl. Compare all 15 side by side: Cartogram with Area Distortion by Data Value in Python, R, Julia and JavaScript.
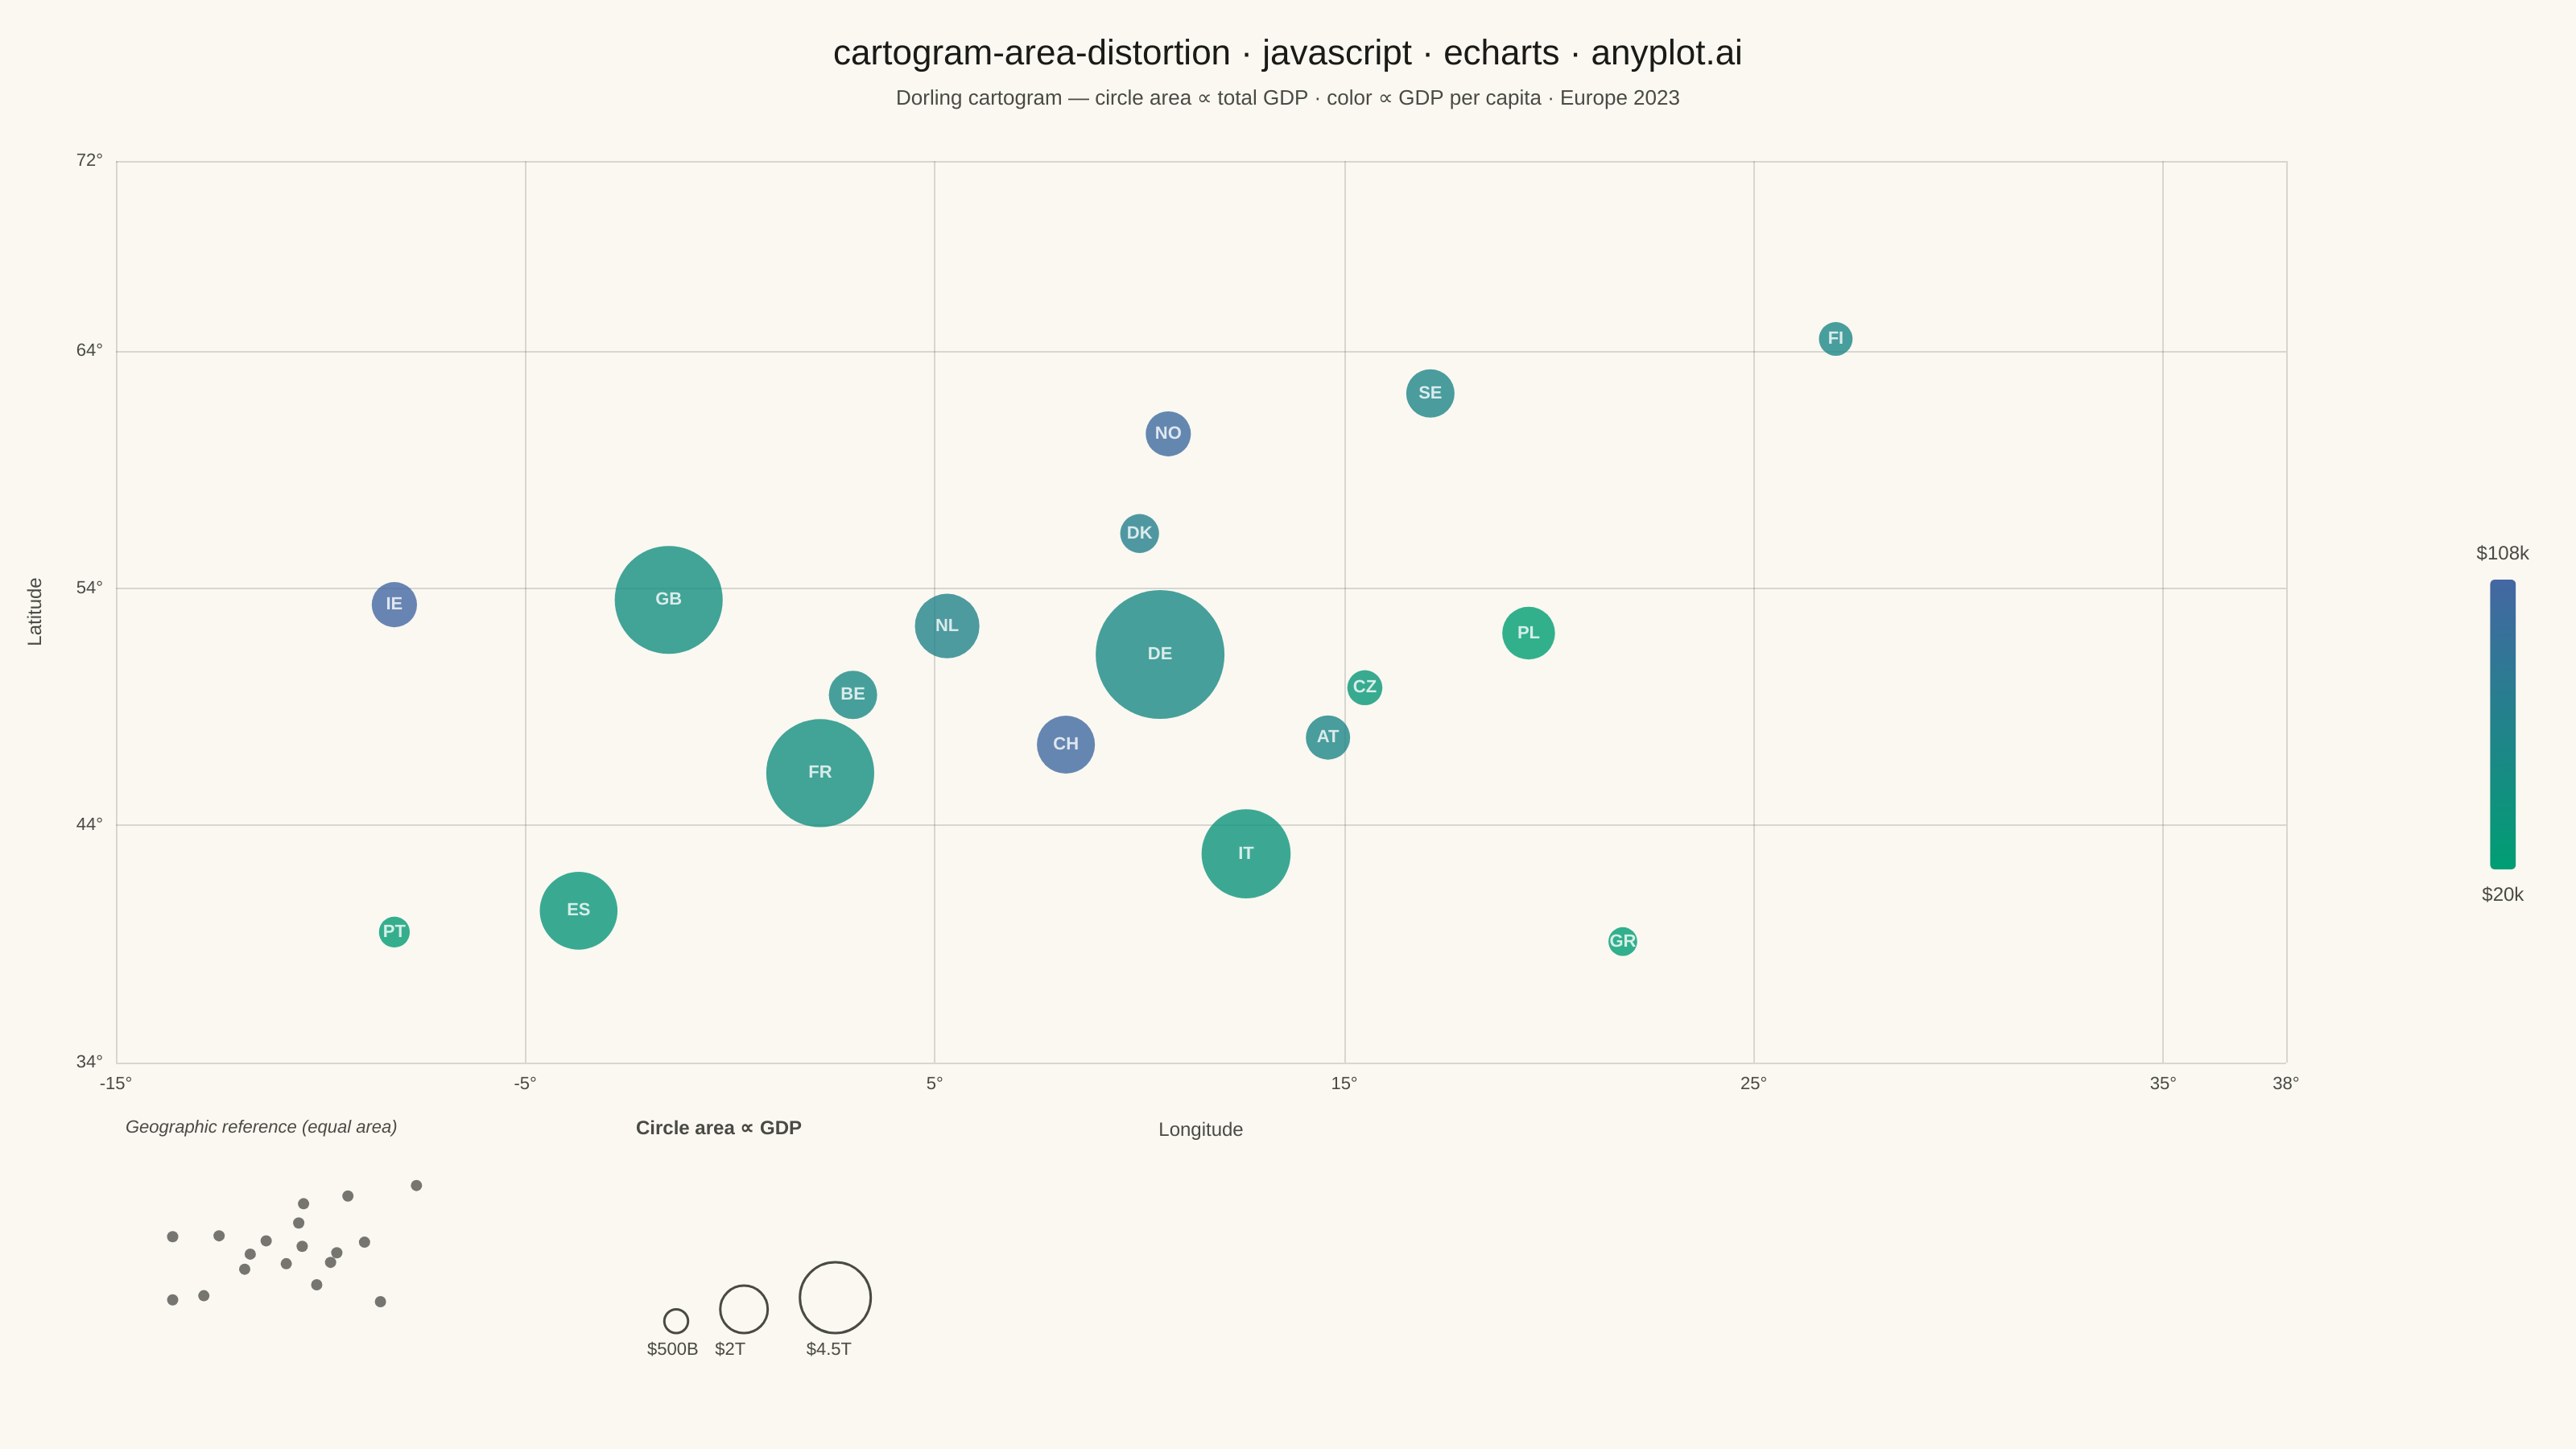
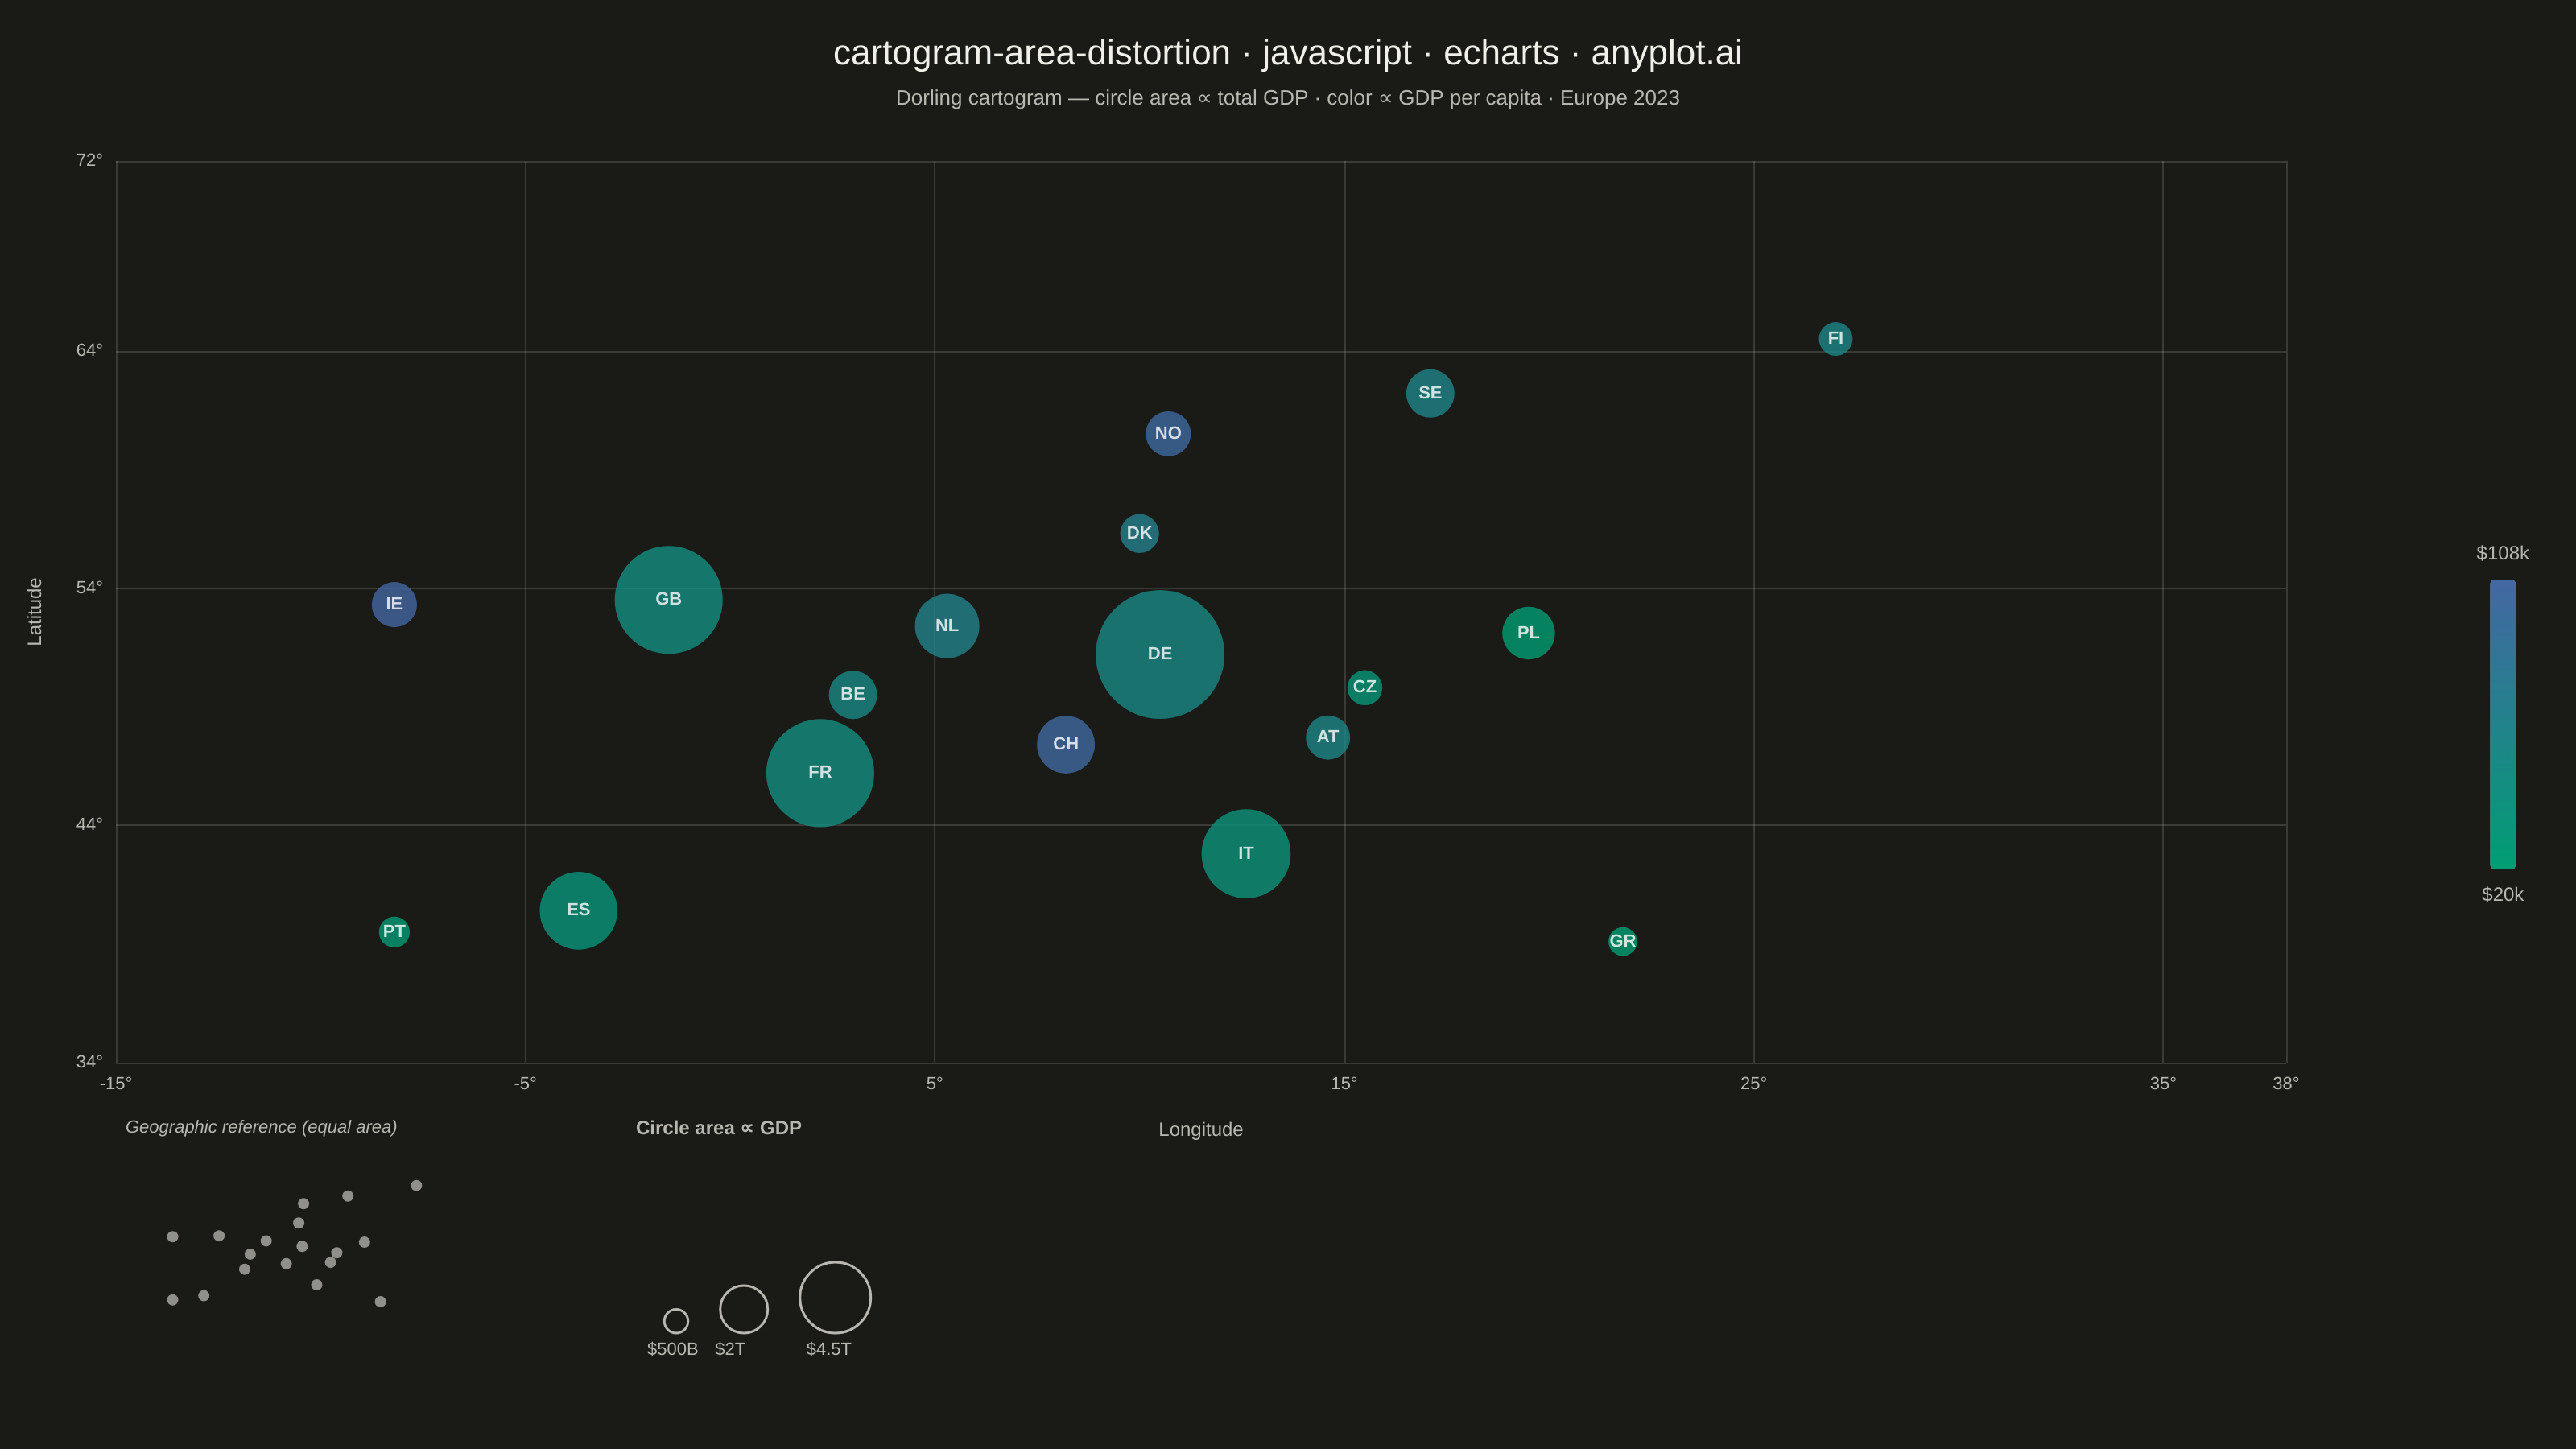
A cartogram distorts geographic regions so that their area becomes proportional to a data variable (e.g., population, GDP, election votes) rather than physical land area. This solves the classic problem of large but sparsely populated areas dominating standard maps, making it easier to compare values across regions at a glance. Contiguous cartograms preserve adjacency and rough shape of regions while rescaling them, famously used in election coverage worldwide.
// anyplot.ai
// cartogram-area-distortion: Cartogram with Area Distortion by Data Value
// Library: echarts 5.5.1 | JavaScript 22.22.3
// Quality: 85/100 | Created: 2026-06-08

const t = window.ANYPLOT_TOKENS;

// European GDP 2023 estimates: [lon, lat, gdp_B_USD, gdppc_k_USD, code, name]
// Positions manually adjusted (Dorling-style) to reduce circle overlap
const countries = [
  [-1.5, 53.5, 3131,  46.1, "GB", "United Kingdom"],
  [-3.7, 40.4, 1623,  34.3, "ES", "Spain"],
  [-8.2, 53.3,  550, 107.8, "IE", "Ireland"],
  [-8.2, 39.5,  255,  24.8, "PT", "Portugal"],
  [ 2.2, 46.2, 3131,  46.0, "FR", "France"],
  [ 3.0, 49.5,  627,  54.1, "BE", "Belgium"],
  [ 5.3, 52.4, 1118,  63.9, "NL", "Netherlands"],
  [ 8.2, 47.4,  905, 103.1, "CH", "Switzerland"],
  [10.0, 56.3,  406,  68.5, "DK", "Denmark"],
  [10.5, 51.2, 4456,  53.1, "DE", "Germany"],
  [10.7, 60.5,  548, 101.5, "NO", "Norway"],
  [12.6, 42.8, 2130,  36.3, "IT", "Italy"],
  [14.6, 47.7,  526,  57.8, "AT", "Austria"],
  [15.5, 49.8,  330,  30.3, "CZ", "Czechia"],
  [17.1, 62.2,  627,  59.7, "SE", "Sweden"],
  [19.5, 52.1,  748,  19.7, "PL", "Poland"],
  [21.8, 39.1,  222,  21.3, "GR", "Greece"],
  [27.0, 64.5,  305,  55.5, "FI", "Finland"],
];

const maxGdp   = Math.max(...countries.map(c => c[2]));
const gdppcMin = Math.min(...countries.map(c => c[3]));
const gdppcMax = Math.max(...countries.map(c => c[3]));

// Dorling scatter: area ∝ GDP, minimum size floor for legibility
const scatterData = countries.map(c => ({
  value: [c[0], c[1], c[2], c[3], c[4], c[5]],
  symbolSize: Math.max(16, Math.sqrt(c[2] / maxGdp) * 80),
}));

// Reference inset: true geographic positions, uniform dot size for comparison
const refData = countries.map(c => ({
  value: [c[0], c[1], c[2], c[3], c[4], c[5]],
  symbolSize: 7,
  itemStyle: { color: t.inkSoft, opacity: 0.75 },
}));

const chart = echarts.init(document.getElementById("container"));

const titleStr = "cartogram-area-distortion · javascript · echarts · anyplot.ai";
const titleFontSize = Math.round(22 * Math.min(1, 67 / titleStr.length));

// Size legend: reference circles at 55% scale for display in legend area
// radii ≈ [6.5, 13.1, 22.0]
const legGdps = [500, 2000, 4456];
const legLabels = ["$500B", "$2T", "$4.5T"];
const legR = legGdps.map(g => (Math.max(16, Math.sqrt(g / maxGdp) * 80) * 0.55) / 2);

const legBaseY = 828;  // y-baseline (bottom of circles)
const legTitleX = 395;
const graphicEls = [
  // Reference inset label (above secondary grid)
  {
    type: "text",
    left: 78,
    top: 695,
    style: {
      text: "Geographic reference (equal area)",
      fill: t.inkSoft,
      fontSize: 11,
      fontStyle: "italic",
    },
  },
  // Size legend title
  {
    type: "text",
    left: legTitleX,
    top: 695,
    style: {
      text: "Circle area ∝ GDP",
      fill: t.inkSoft,
      fontSize: 12,
      fontWeight: "bold",
    },
  },
];

// Build size legend circles and labels
let circCx = 420;
legGdps.forEach((gdp, i) => {
  const r = legR[i];
  graphicEls.push(
    {
      type: "circle",
      shape: { cx: circCx, cy: legBaseY - r, r },
      style: { fill: "none", stroke: t.inkSoft, lineWidth: 1.5 },
    },
    {
      type: "text",
      left: circCx - 18,
      top: legBaseY + 5,
      style: { text: legLabels[i], fill: t.inkSoft, fontSize: 11 },
    }
  );
  if (i < legGdps.length - 1) {
    circCx += r + 20 + legR[i + 1];
  }
});

chart.setOption({
  animation: false,
  color: t.palette,
  backgroundColor: "transparent",

  title: {
    text: titleStr,
    subtext: "Dorling cartogram — circle area ∝ total GDP · color ∝ GDP per capita · Europe 2023",
    subtextStyle: { color: t.inkSoft, fontSize: 13 },
    left: "center",
    top: 18,
    textStyle: { color: t.ink, fontSize: titleFontSize, fontWeight: "normal" },
  },

  tooltip: {
    trigger: "item",
    backgroundColor: t.elevatedBg,
    borderWidth: 0,
    padding: [8, 12],
    textStyle: { color: t.ink, fontSize: 13 },
    formatter: (params) => {
      if (params.seriesIndex !== 0) return undefined;
      const v = params.value;
      return (
        `<b>${v[5]} (${v[4]})</b><br/>` +
        `GDP: $${v[2].toLocaleString()}B<br/>` +
        `Per capita: $${v[3].toFixed(1)}k`
      );
    },
  },

  visualMap: {
    type: "continuous",
    dimension: 3,
    min: gdppcMin,
    max: gdppcMax,
    inRange: { color: t.seq },
    text: ["$108k", "$20k"],
    textStyle: { color: t.inkSoft, fontSize: 12 },
    itemWidth: 16,
    itemHeight: 180,
    right: 24,
    top: "middle",
    orient: "vertical",
    hoverLink: false,
    seriesIndex: 0,
  },

  grid: [
    { left: 72, right: 180, top: 100, bottom: 240 },
    { left: 78, top: 715, width: 228, height: 108 },
  ],

  xAxis: [
    {
      gridIndex: 0,
      type: "value",
      name: "Longitude",
      nameLocation: "middle",
      nameGap: 36,
      nameTextStyle: { color: t.inkSoft, fontSize: 12 },
      min: -15,
      max: 38,
      interval: 10,
      axisLabel: { color: t.inkSoft, fontSize: 11, formatter: (v) => `${v}\xb0` },
      axisLine: { show: false },
      axisTick: { show: false },
      splitLine: { lineStyle: { color: t.grid } },
    },
    {
      gridIndex: 1,
      type: "value",
      min: -15,
      max: 38,
      show: false,
    },
  ],

  yAxis: [
    {
      gridIndex: 0,
      type: "value",
      name: "Latitude",
      nameLocation: "middle",
      nameGap: 44,
      nameTextStyle: { color: t.inkSoft, fontSize: 12 },
      min: 34,
      max: 72,
      interval: 10,
      axisLabel: { color: t.inkSoft, fontSize: 11, formatter: (v) => `${v}\xb0` },
      axisLine: { show: false },
      axisTick: { show: false },
      splitLine: { lineStyle: { color: t.grid } },
    },
    {
      gridIndex: 1,
      type: "value",
      min: 34,
      max: 72,
      show: false,
    },
  ],

  series: [
    {
      type: "scatter",
      xAxisIndex: 0,
      yAxisIndex: 0,
      data: scatterData,
      label: {
        show: true,
        formatter: (params) => params.value[4],
        fontSize: 11,
        fontWeight: "bold",
        color: "#ffffff",
      },
      emphasis: { focus: "self", scale: true },
    },
    {
      type: "scatter",
      xAxisIndex: 1,
      yAxisIndex: 1,
      data: refData,
      label: { show: false },
      emphasis: { disabled: true },
    },
  ],

  graphic: graphicEls,
});
Runnable source as JSON, for any HTTP client: https://api.anyplot.ai/specs/cartogram-area-distortion/echarts/code. Any spec id and library id listed in llms-full.txt fit the same URL shape; every URL below is complete and callable.
{
  "spec_id": "cartogram-area-distortion",
  "language": "javascript",
  "library": "echarts",
  "page": "https://anyplot.ai/cartogram-area-distortion/javascript/echarts",
  "hub": "https://anyplot.ai/cartogram-area-distortion",
  "code_json": "https://api.anyplot.ai/specs/cartogram-area-distortion/echarts/code",
  "spec_json": "https://api.anyplot.ai/specs/cartogram-area-distortion",
  "render_light_png": "https://storage.googleapis.com/anyplot-images/plots/cartogram-area-distortion/javascript/echarts/plot-light.png",
  "render_dark_png": "https://storage.googleapis.com/anyplot-images/plots/cartogram-area-distortion/javascript/echarts/plot-dark.png",
  "interactive_light_html": "https://storage.googleapis.com/anyplot-images/plots/cartogram-area-distortion/javascript/echarts/plot-light.html",
  "interactive_dark_html": "https://storage.googleapis.com/anyplot-images/plots/cartogram-area-distortion/javascript/echarts/plot-dark.html",
  "quality_score": 85.0,
  "license": "MIT",
  "guide": "https://anyplot.ai/llms.txt"
}
Part of Cartogram with Area Distortion by Data Value on anyplot.ai.