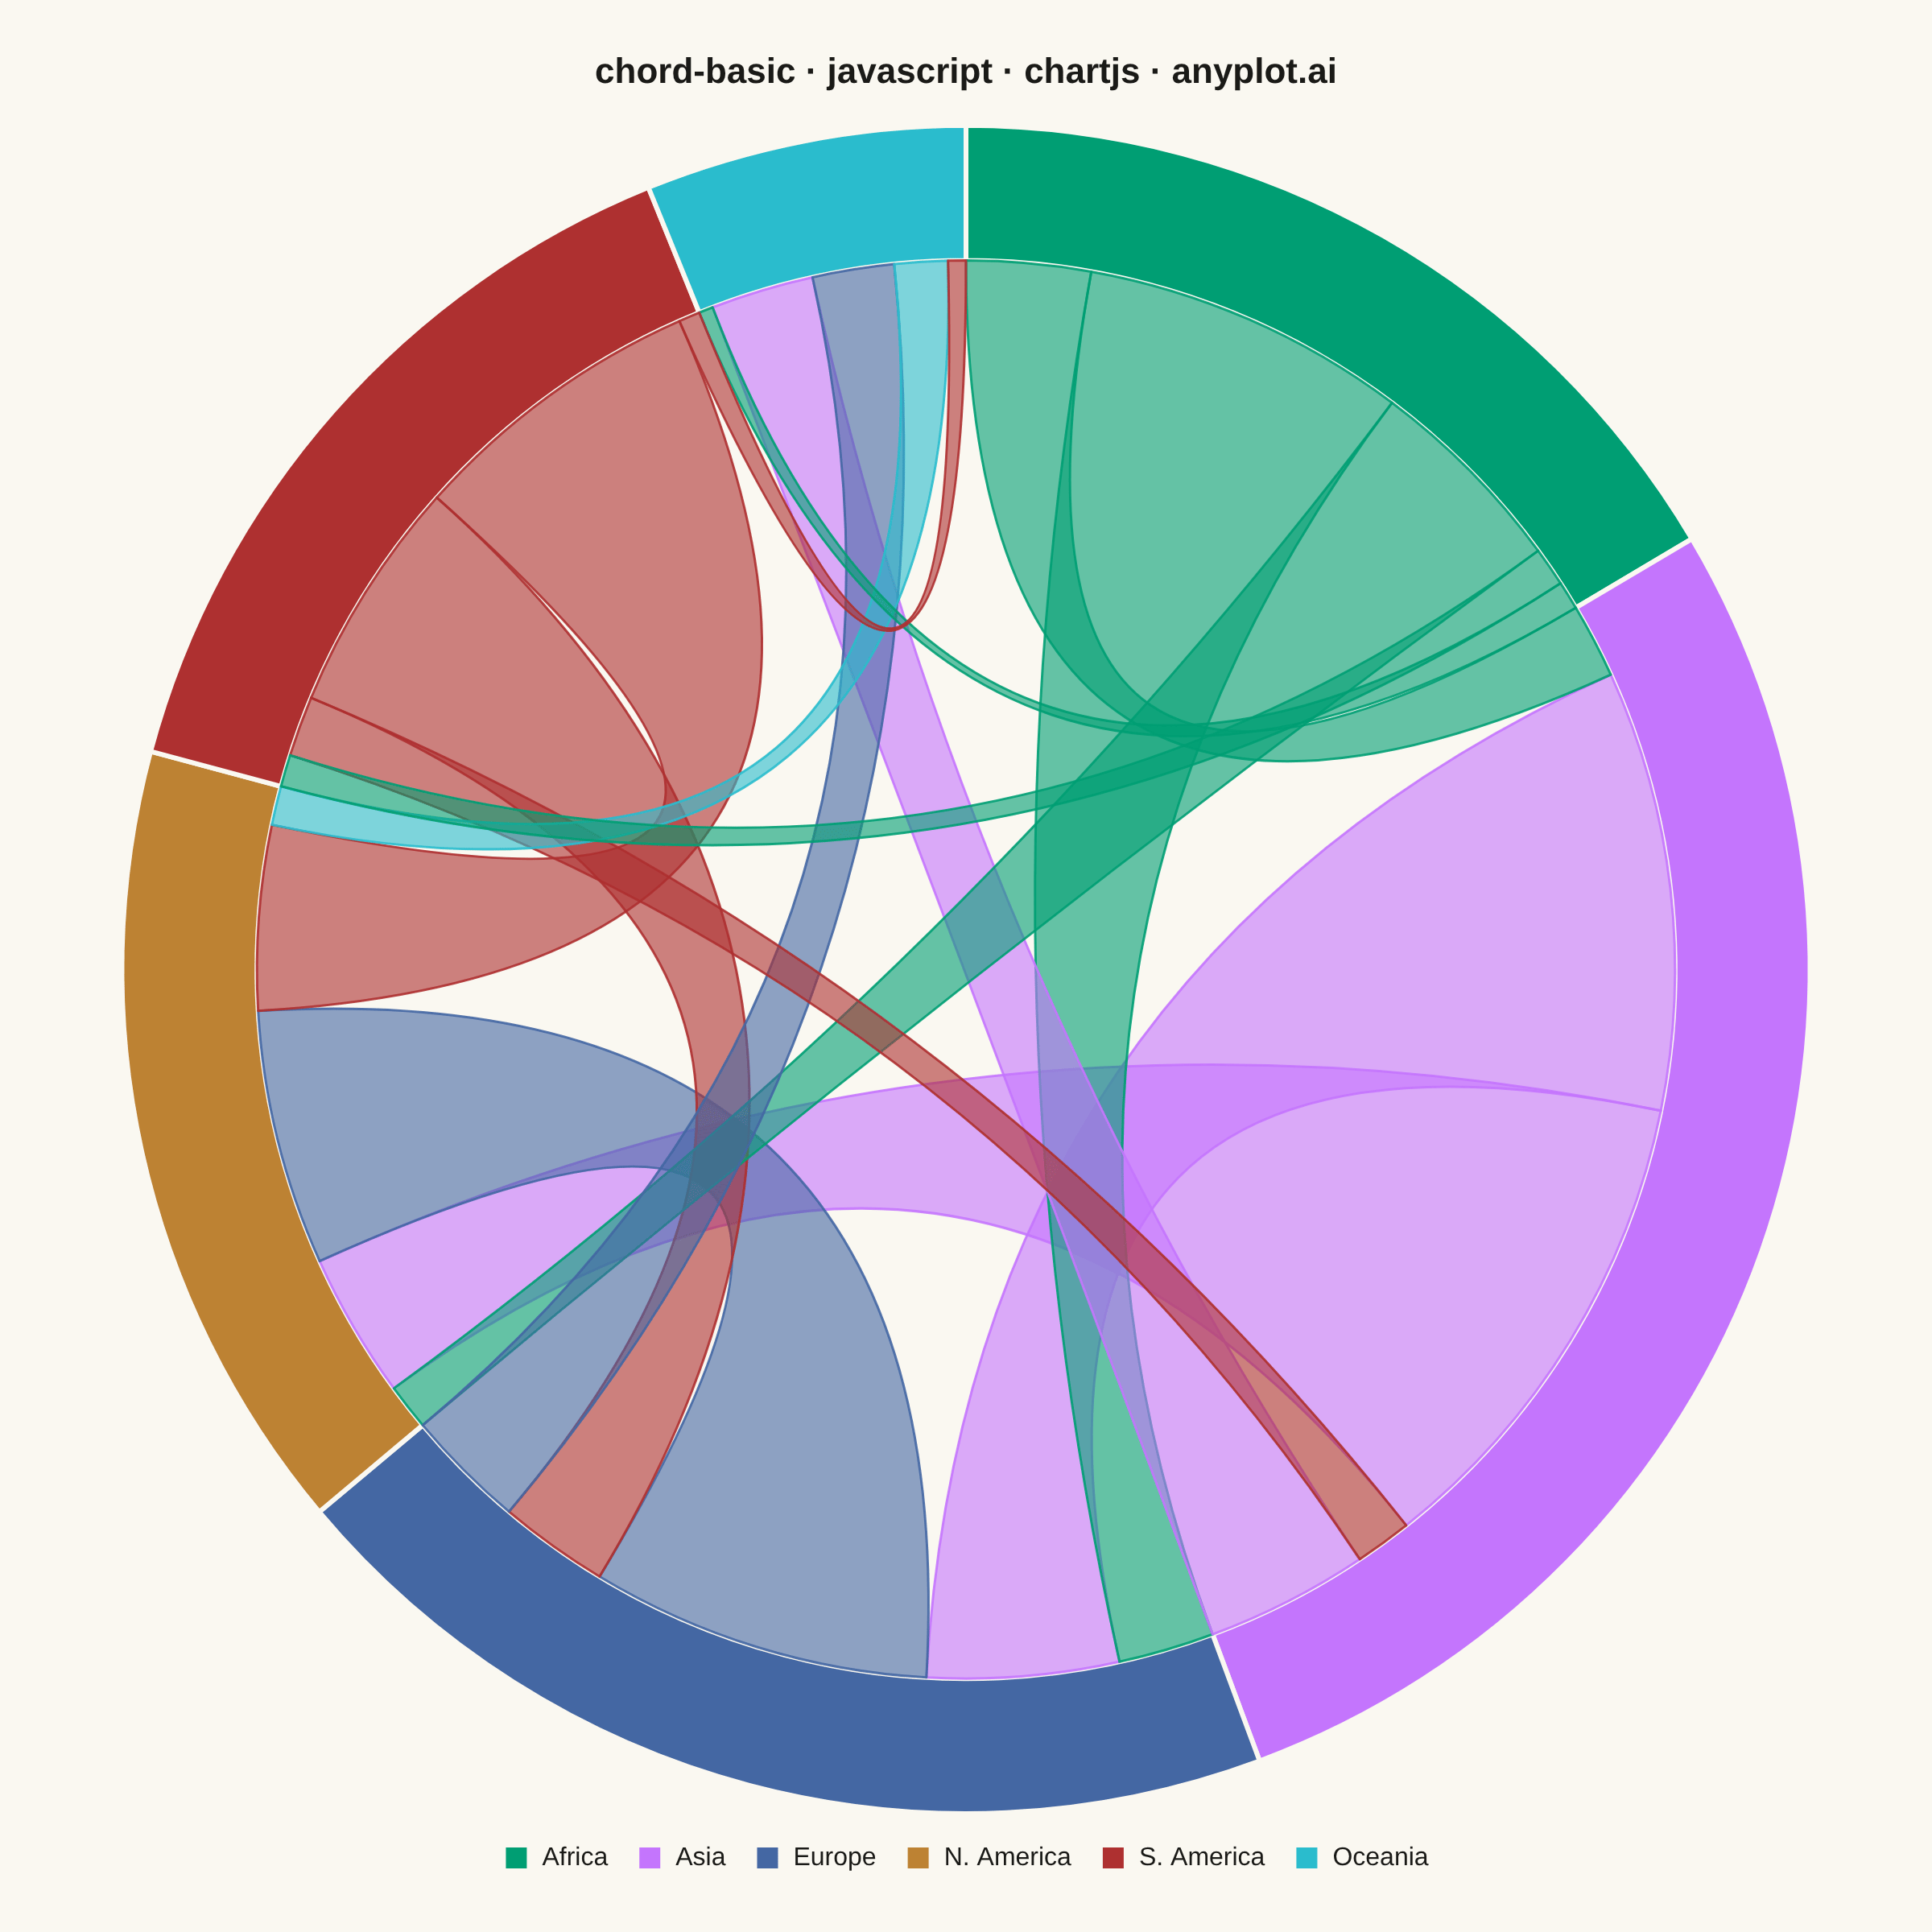
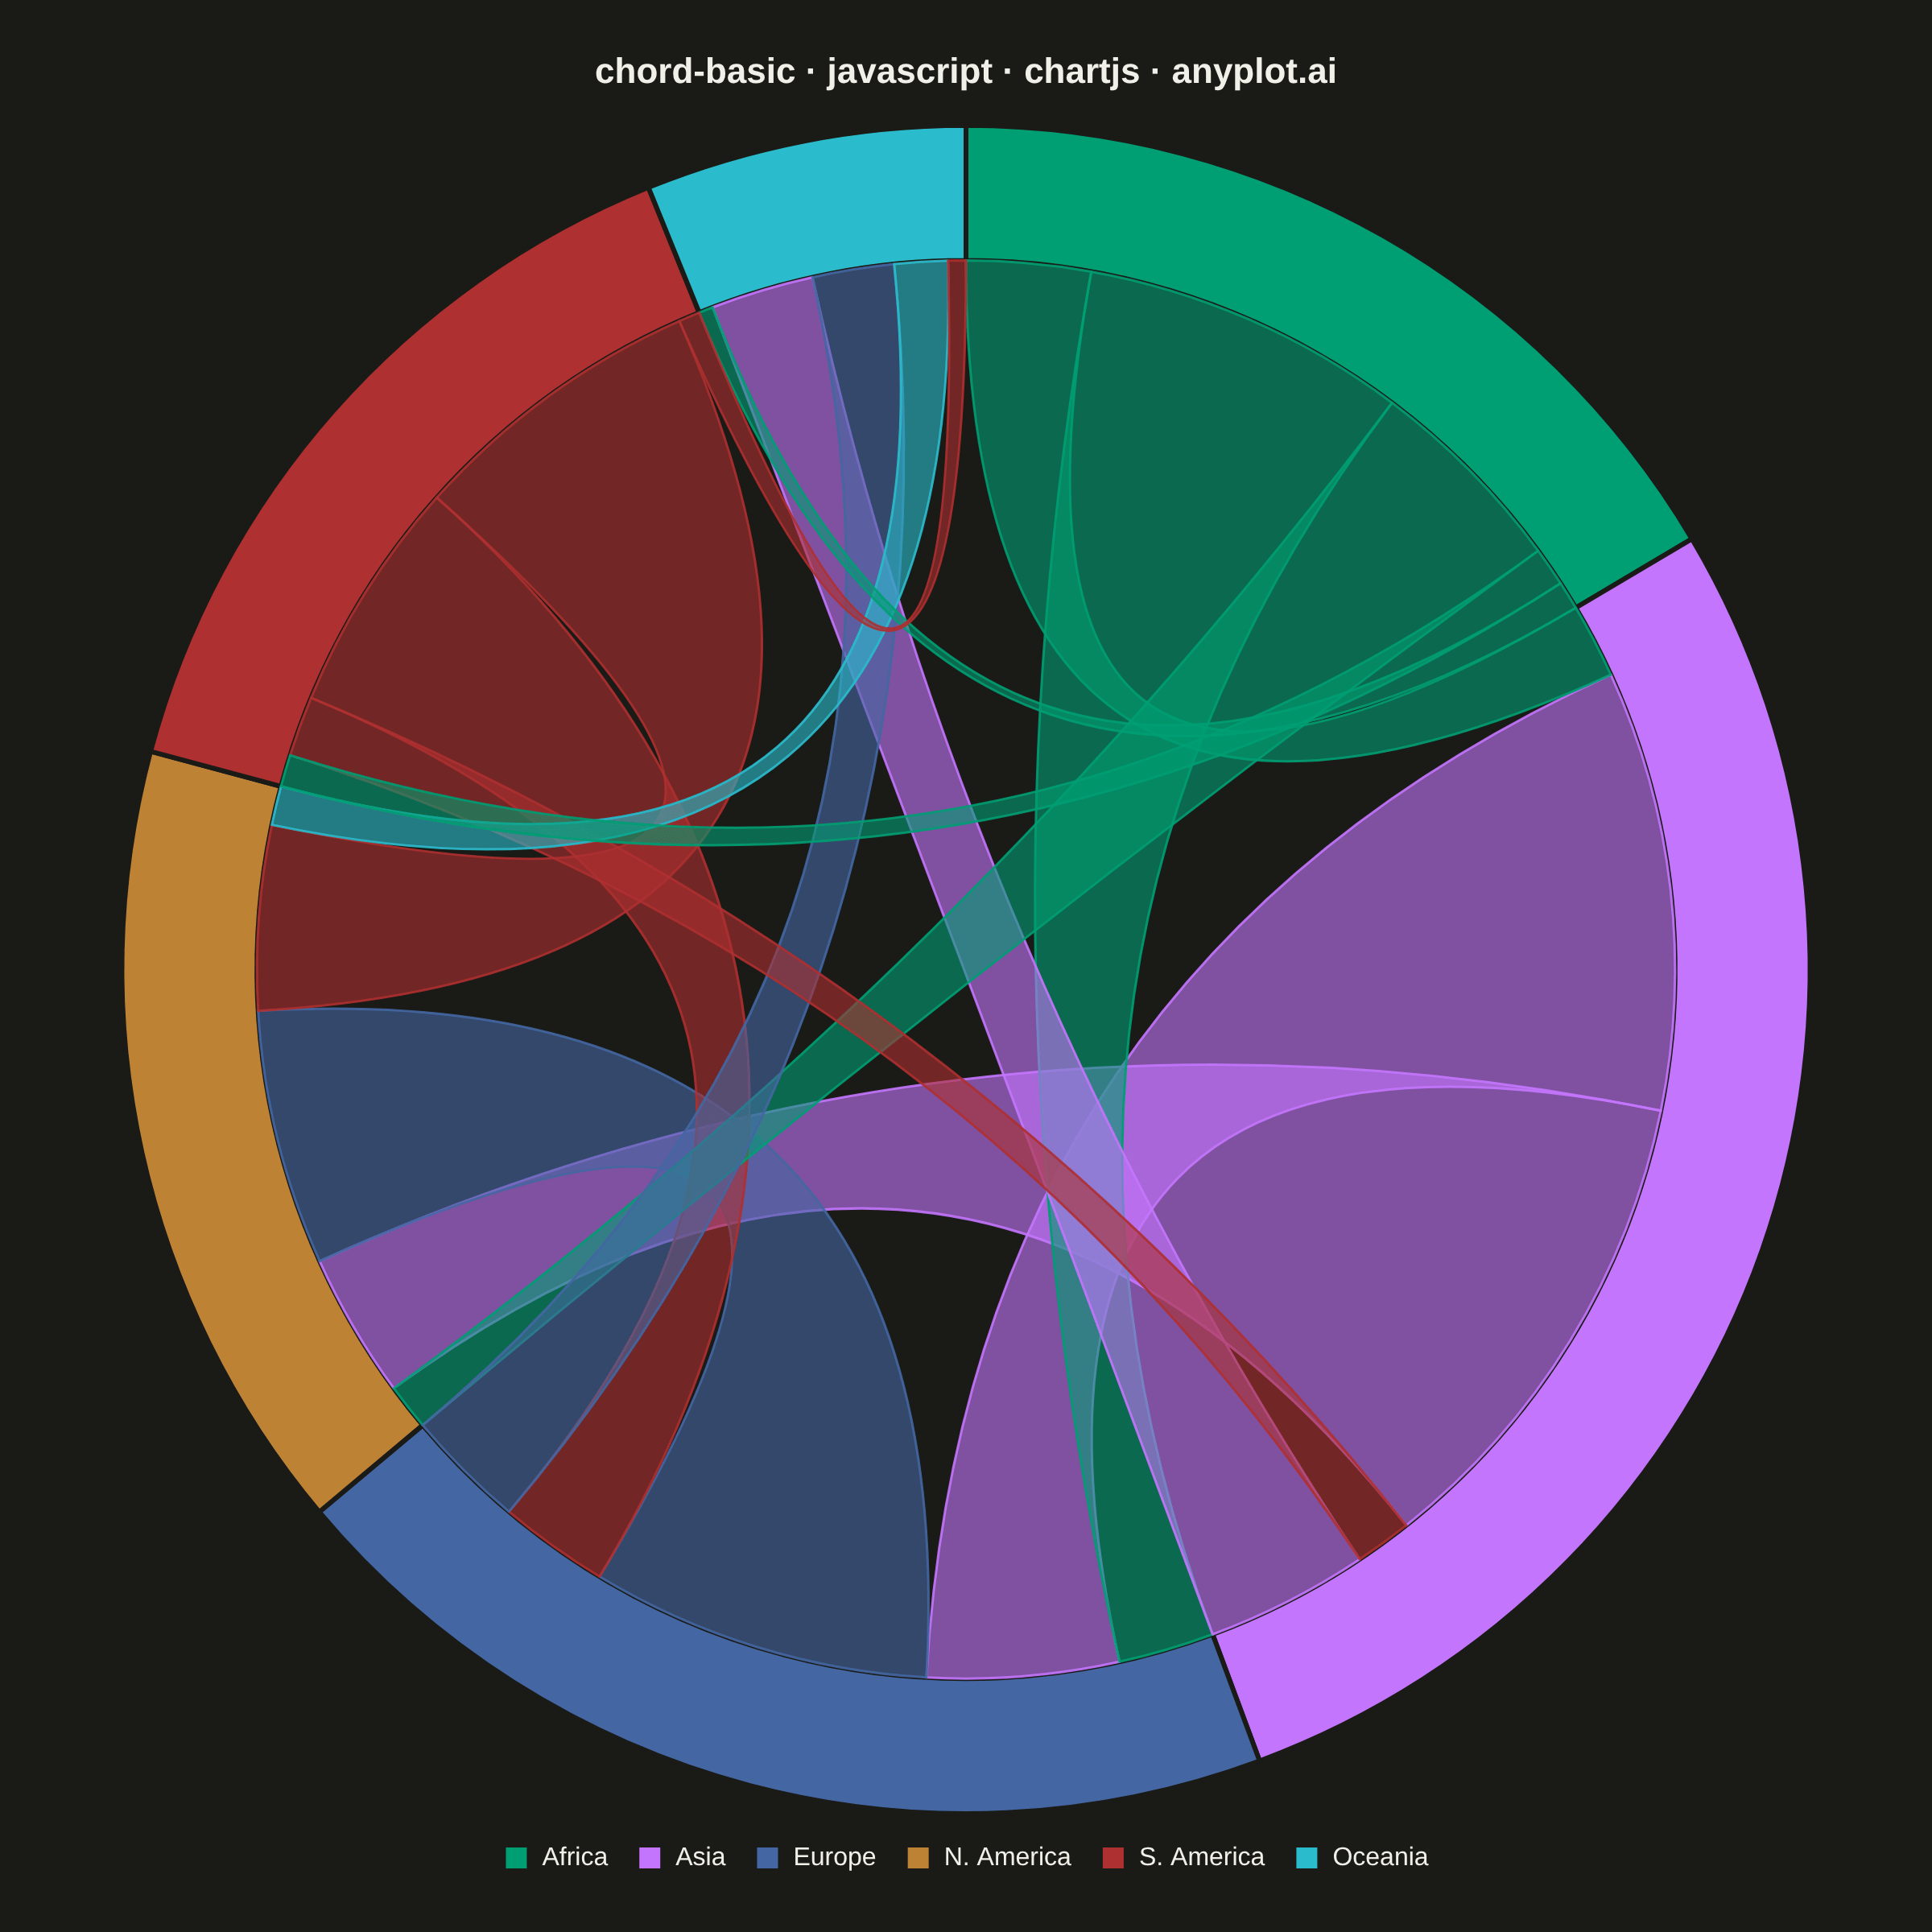
A chord diagram displays relationships or flows between entities arranged around a circle's perimeter. Arcs (chords) connect related entities, with chord width proportional to the flow magnitude. This visualization excels at revealing the overall structure of connections and identifying the strongest relationships within a system.
// anyplot.ai
// chord-basic: Basic Chord Diagram
// Library: chartjs 4.4.7 | JavaScript 22.22.3
// Quality: 90/100 | Created: 2026-06-17
//# anyplot-orientation: square

const t = window.ANYPLOT_TOKENS;

// --- Data: migration flows between 6 continents (thousands/year) -----------
// flow[i][j] = directed migration from entity i -> entity j. Diagonal is 0
// (no self-flow). Bidirectional pairs differ, so each ribbon has two unequal
// ends — exactly what a chord diagram reveals.
const labels = ["Africa", "Asia", "Europe", "N. America", "S. America", "Oceania"];
const flow = [
  //  Af   As   Eu   NA   SA   Oc
  [   0,  35,  92,  58,  11,   8],  // Africa
  [  21,   0, 124, 138,  16,  46],  // Asia
  [  27,  54,   0,  96,  31,  34],  // Europe
  [  13,  41,  72,   0,  52,  11],  // N. America
  [   9,  17,  66,  84,   0,   6],  // S. America
  [   4,  29,  23,  15,   5,   0],  // Oceania
];

// Each entity's arc length is proportional to its total outgoing flow, so the
// doughnut arcs and the ribbon slots tile the same angular budget.
const rowSum = flow.map((row) => row.reduce((a, b) => a + b, 0));

// Each entity keeps a distinct Imprint colour (brand green leads at slot 0).
const entityColors = labels.map((_, i) => t.palette[i % t.palette.length]);

// --- Theme-adaptive chrome -------------------------------------------------
const PAGE_BG = t.pageBg;
const INK = t.ink;

const hexToRgba = (hex, alpha) => {
  const h = hex.replace("#", "");
  const r = parseInt(h.slice(0, 2), 16);
  const g = parseInt(h.slice(2, 4), 16);
  const b = parseInt(h.slice(4, 6), 16);
  return `rgba(${r}, ${g}, ${b}, ${alpha})`;
};

// --- Chord ribbon plugin ---------------------------------------------------
// Chart.js has no native chord type, but its core plugin API exposes the live
// canvas + the doughnut's computed arc geometry. We anchor each flow ribbon to
// the inner edge of the ring and bow it through the centre — ribbon end-width
// is proportional to the flow value, drawn largest-first so thin flows stay on
// top. No external library, no community plugin: pure Chart.js extensibility.
const chordRibbons = {
  id: "chordRibbons",
  afterDatasetsDraw(chart) {
    const arcs = chart.getDatasetMeta(0).data;
    if (!arcs.length) return;

    const { x: cx, y: cy } = arcs[0].getProps(["x", "y"], true);
    const innerR = arcs[0].getProps(["innerRadius"], true).innerRadius;
    const n = labels.length;

    // Angular interval [a0, a1] of every ordered slot (i -> j) inside arc i.
    const slot = arcs.map((arc, i) => {
      const { startAngle, endAngle } = arc.getProps(["startAngle", "endAngle"], true);
      const span = endAngle - startAngle;
      let acc = 0;
      return flow[i].map((w) => {
        const a0 = startAngle + (acc / rowSum[i]) * span;
        acc += w;
        const a1 = startAngle + (acc / rowSum[i]) * span;
        return [a0, a1];
      });
    });

    const pointAt = (angle, r) => [cx + r * Math.cos(angle), cy + r * Math.sin(angle)];

    // One ribbon per unordered pair, ordered by combined flow (big first).
    const pairs = [];
    for (let i = 0; i < n; i++) {
      for (let j = i + 1; j < n; j++) {
        if (flow[i][j] + flow[j][i] === 0) continue;
        pairs.push([i, j, flow[i][j] + flow[j][i]]);
      }
    }
    pairs.sort((a, b) => b[2] - a[2]);

    const ctx = chart.ctx;
    ctx.save();
    ctx.lineJoin = "round";
    for (const [i, j] of pairs) {
      const [si0, si1] = slot[i][j]; // end resting on entity i
      const [sj0, sj1] = slot[j][i]; // end resting on entity j
      const [xi, yi] = pointAt(si0, innerR);

      ctx.beginPath();
      ctx.moveTo(xi, yi);
      ctx.arc(cx, cy, innerR, si0, si1);            // ride entity i's ring
      const [xj, yj] = pointAt(sj0, innerR);
      ctx.quadraticCurveTo(cx, cy, xj, yj);         // bow through the centre
      ctx.arc(cx, cy, innerR, sj0, sj1);            // ride entity j's ring
      ctx.quadraticCurveTo(cx, cy, xi, yi);         // bow back
      ctx.closePath();

      // Colour by the dominant direction's entity for a readable hierarchy.
      const dominant = flow[i][j] >= flow[j][i] ? i : j;
      ctx.fillStyle = hexToRgba(entityColors[dominant], 0.6);
      ctx.fill();
      ctx.lineWidth = 1.5;
      ctx.strokeStyle = hexToRgba(entityColors[dominant], 0.9);
      ctx.stroke();
    }
    ctx.restore();
  },
};

// --- Mount -----------------------------------------------------------------
const canvas = document.createElement("canvas");
document.getElementById("container").appendChild(canvas);

// --- Chart: doughnut ring of entities + chord ribbon plugin ----------------
new Chart(canvas, {
  type: "doughnut",
  data: {
    labels,
    datasets: [
      {
        label: "Total outgoing migration",
        data: rowSum,
        backgroundColor: entityColors,
        borderColor: PAGE_BG,
        borderWidth: 3,
        hoverOffset: 0,
      },
    ],
  },
  options: {
    responsive: true,
    maintainAspectRatio: false,
    animation: false,
    cutout: "84%",
    layout: { padding: 28 },
    plugins: {
      title: {
        display: true,
        text: "chord-basic · javascript · chartjs · anyplot.ai",
        color: INK,
        font: { size: 22, weight: "600" },
        padding: { top: 4, bottom: 18 },
      },
      legend: {
        position: "bottom",
        labels: {
          color: INK,
          font: { size: 16 },
          padding: 18,
          boxWidth: 16,
          boxHeight: 16,
        },
      },
      tooltip: {
        callbacks: {
          label: (item) => `${item.label}: ${item.parsed} k outgoing`,
        },
      },
    },
  },
  plugins: [chordRibbons],
});
Runnable source as JSON, for any HTTP client: https://api.anyplot.ai/specs/chord-basic/chartjs/code. Any spec id and library id listed in llms-full.txt fit the same URL shape; every URL below is complete and callable.
{
  "spec_id": "chord-basic",
  "language": "javascript",
  "library": "chartjs",
  "page": "https://anyplot.ai/chord-basic/javascript/chartjs",
  "hub": "https://anyplot.ai/chord-basic",
  "code_json": "https://api.anyplot.ai/specs/chord-basic/chartjs/code",
  "spec_json": "https://api.anyplot.ai/specs/chord-basic",
  "render_light_png": "https://storage.googleapis.com/anyplot-images/plots/chord-basic/javascript/chartjs/plot-light.png",
  "render_dark_png": "https://storage.googleapis.com/anyplot-images/plots/chord-basic/javascript/chartjs/plot-dark.png",
  "interactive_light_html": "https://storage.googleapis.com/anyplot-images/plots/chord-basic/javascript/chartjs/plot-light.html",
  "interactive_dark_html": "https://storage.googleapis.com/anyplot-images/plots/chord-basic/javascript/chartjs/plot-dark.html",
  "quality_score": 90.0,
  "license": "MIT",
  "guide": "https://anyplot.ai/llms.txt"
}
Part of Basic Chord Diagram on anyplot.ai.