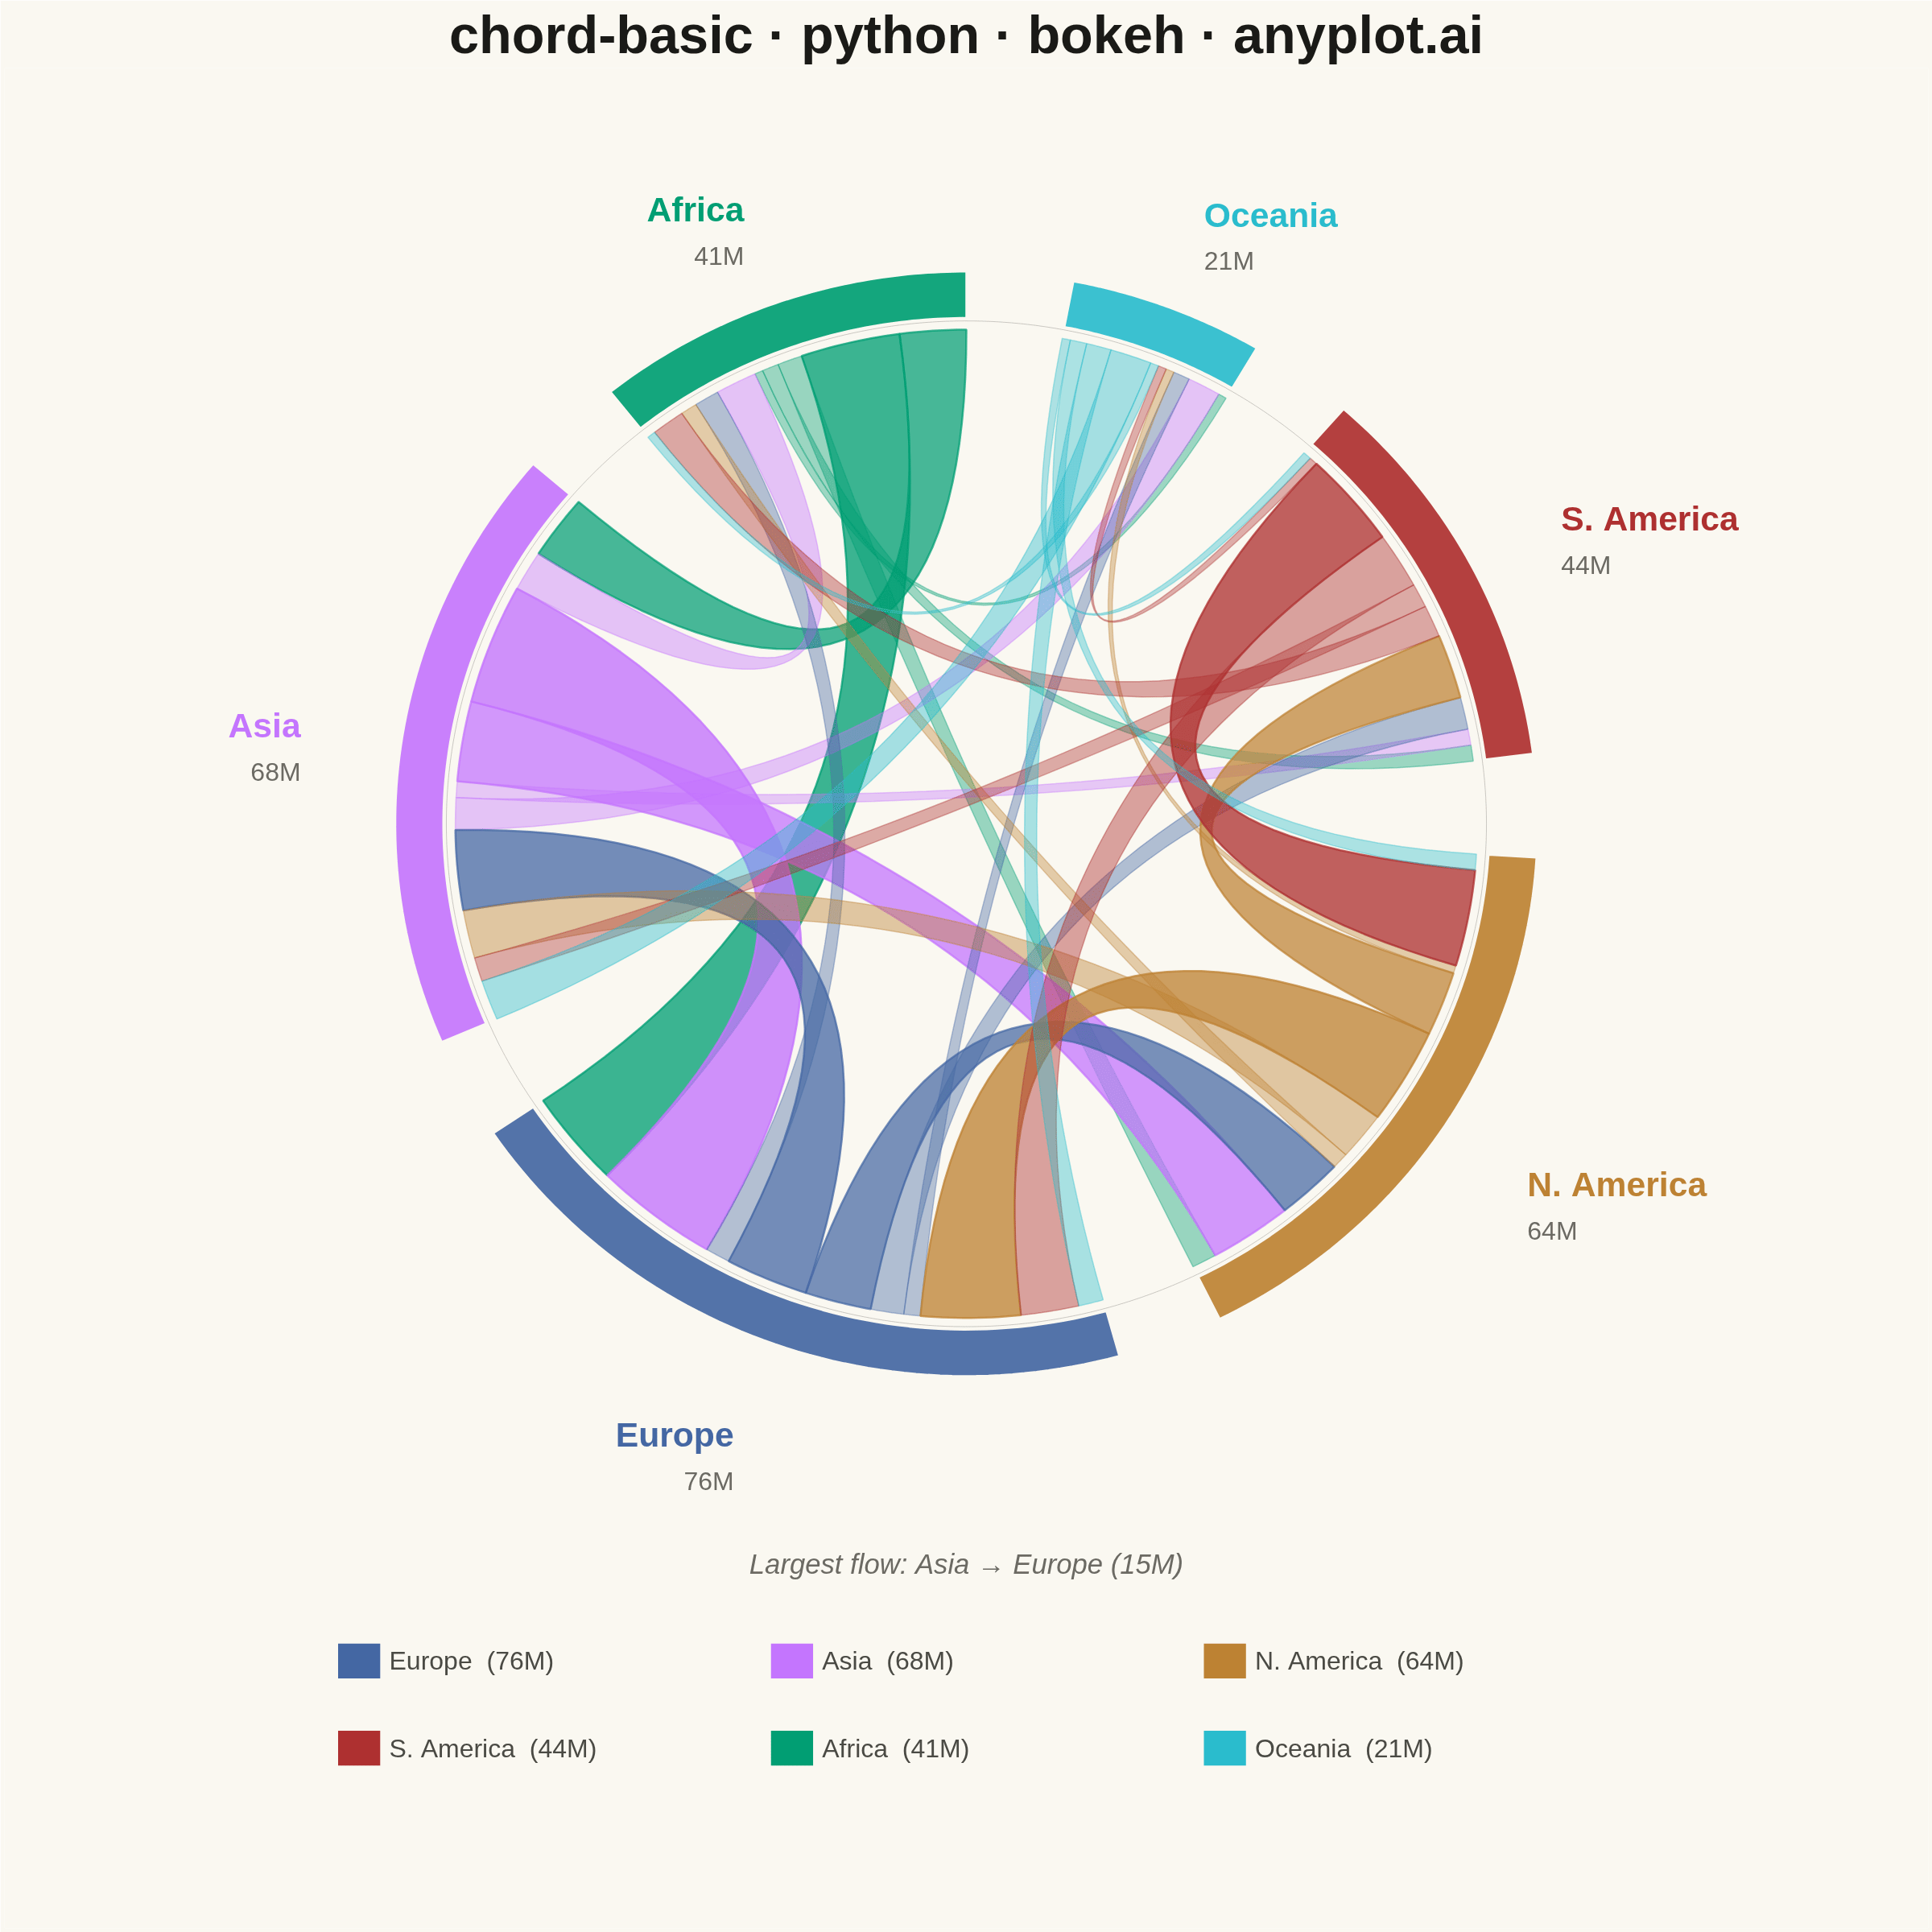
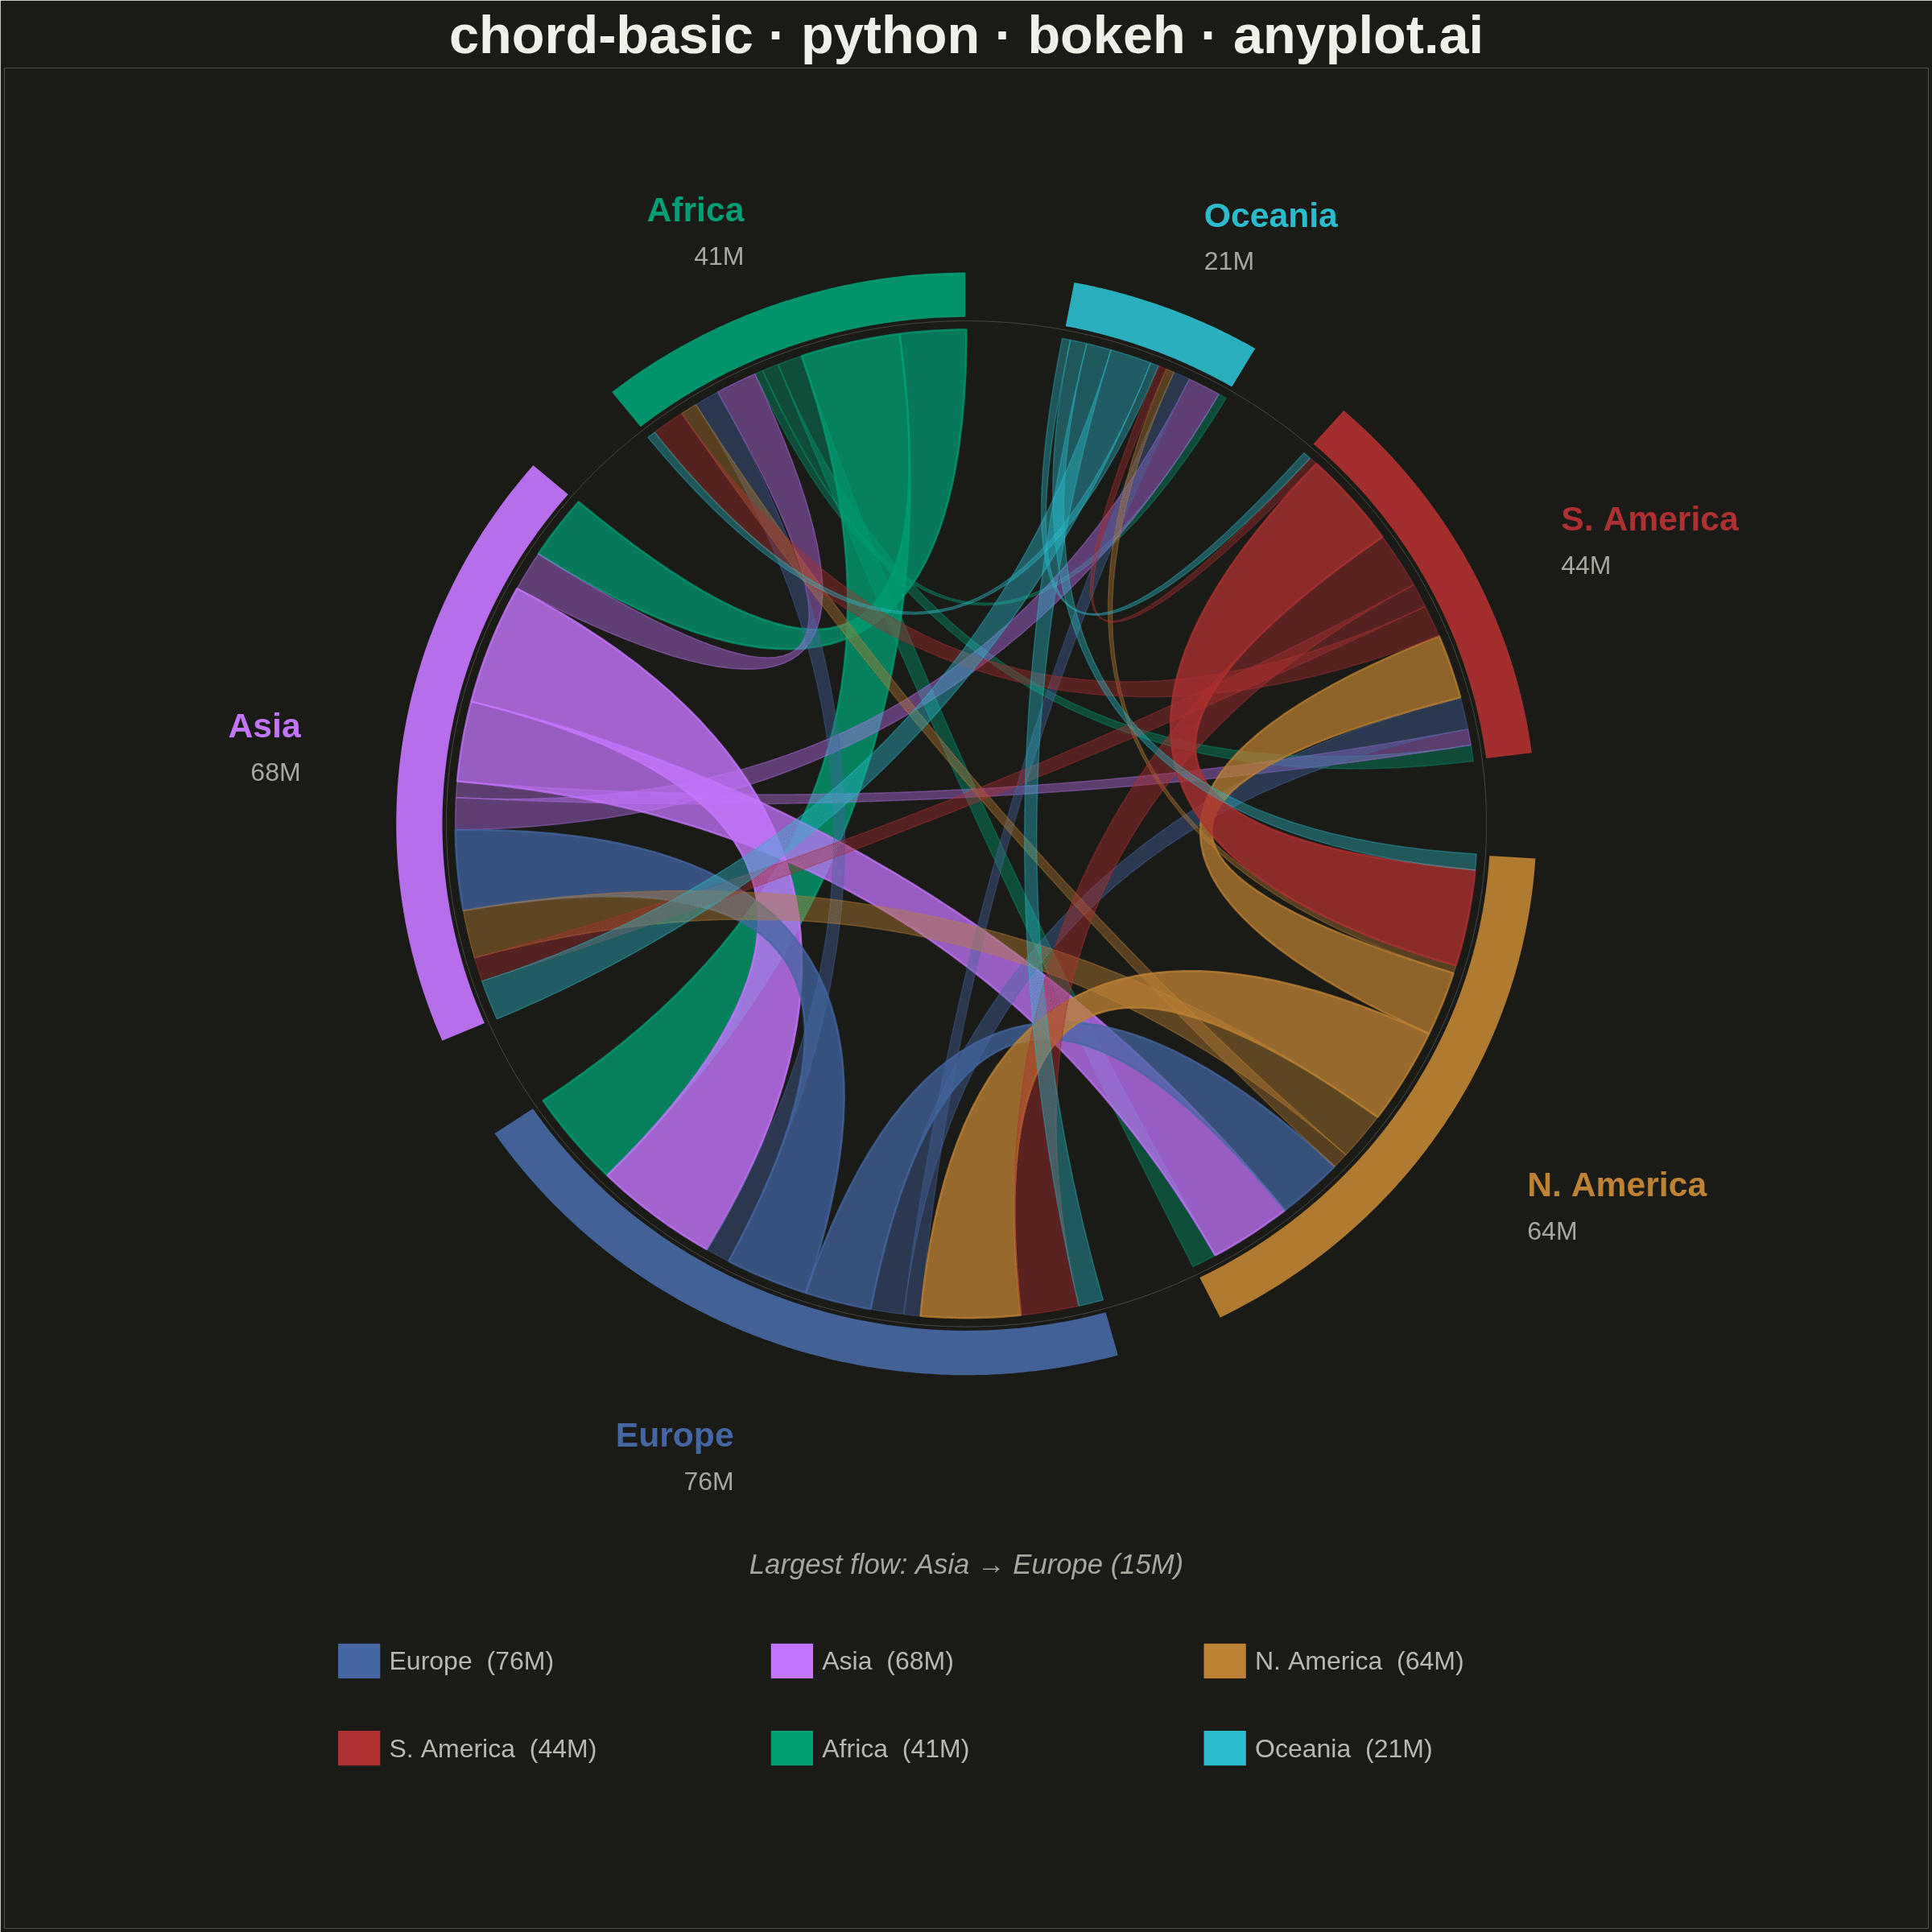
A chord diagram displays relationships or flows between entities arranged around a circle's perimeter. Arcs (chords) connect related entities, with chord width proportional to the flow magnitude. This visualization excels at revealing the overall structure of connections and identifying the strongest relationships within a system.
""" anyplot.ai
chord-basic: Basic Chord Diagram
Library: bokeh 3.9.1 | Python 3.13.13
Quality: 90/100 | Updated: 2026-06-17
"""

import os
import sys


# Prevent self-import: this file is named bokeh.py, which shadows the installed
# bokeh package when its directory sits at the front of sys.path.
_this_dir = os.path.dirname(os.path.abspath(__file__))
sys.path = [p for p in sys.path if os.path.abspath(p or ".") != _this_dir]

import time
from pathlib import Path

import numpy as np
from bokeh.io import output_file, save
from bokeh.models import ColumnDataSource, HoverTool, Label
from bokeh.plotting import figure
from selenium import webdriver
from selenium.webdriver.chrome.options import Options


# Theme-adaptive chrome
THEME = os.getenv("ANYPLOT_THEME", "light")
PAGE_BG = "#FAF8F1" if THEME == "light" else "#1A1A17"
ELEVATED_BG = "#FFFDF6" if THEME == "light" else "#242420"
INK = "#1A1A17" if THEME == "light" else "#F0EFE8"
INK_SOFT = "#4A4A44" if THEME == "light" else "#B8B7B0"
INK_MUTED = "#6B6A63" if THEME == "light" else "#A8A79F"

# Imprint palette — colorblind-safe, first series always #009E73
IMPRINT_PALETTE = ["#009E73", "#C475FD", "#4467A3", "#BD8233", "#AE3030", "#2ABCCD"]

# Data — Migration flows between continents (in millions)
entities = ["Africa", "Asia", "Europe", "N. America", "S. America", "Oceania"]
n = len(entities)
colors = IMPRINT_PALETTE[:n]

# Flow matrix (rows = source, cols = target)
flow_matrix = np.array(
    [
        [0, 8, 12, 3, 2, 1],  # Africa to others
        [5, 0, 15, 10, 2, 4],  # Asia to others
        [3, 10, 0, 8, 4, 2],  # Europe to others
        [2, 6, 12, 0, 8, 1],  # N. America to others
        [4, 3, 7, 12, 0, 1],  # S. America to others
        [1, 5, 3, 2, 1, 0],  # Oceania to others
    ]
)

# Total flows for each entity (outgoing + incoming)
total_flows = flow_matrix.sum(axis=1) + flow_matrix.sum(axis=0)
total_all = total_flows.sum()

# Arc angles for each entity
gap = 0.03 * 2 * np.pi
total_gap = gap * n
available = 2 * np.pi - total_gap
arc_angles = (total_flows / total_all) * available

# Start/end angles for each entity's arc (start from top)
arc_starts = np.zeros(n)
arc_ends = np.zeros(n)
current_angle = np.pi / 2
for i in range(n):
    arc_starts[i] = current_angle
    arc_ends[i] = current_angle + arc_angles[i]
    current_angle = arc_ends[i] + gap

arc_mids = (arc_starts + arc_ends) / 2

# Figure — square canvas (2400x2400), centered symmetric layout, no toolbar.
# Equal x/y data spans (3.2 each) keep the circle round on the square canvas.
title = "chord-basic · python · bokeh · anyplot.ai"
p = figure(
    width=2400, height=2400, title=title, x_range=(-1.6, 1.6), y_range=(-1.9, 1.3), toolbar_location=None, tools=""
)

p.axis.visible = False
p.grid.visible = False
p.outline_line_color = None
p.background_fill_color = PAGE_BG
p.border_fill_color = PAGE_BG
p.title.text_font_size = "50pt"
p.title.text_color = INK
p.title.align = "center"

# Determine top flows for storytelling emphasis
all_flows = [flow_matrix[i, j] for i in range(n) for j in range(n) if i != j and flow_matrix[i, j] > 0]
flow_75th = np.percentile(all_flows, 75)
flow_max = max(all_flows)

# Outer arcs
outer_radius = 0.95
inner_radius = 0.87
arc_resolution = 60

for i in range(n):
    theta = np.linspace(arc_starts[i], arc_ends[i], arc_resolution)
    x_outer = outer_radius * np.cos(theta)
    y_outer = outer_radius * np.sin(theta)
    x_inner = inner_radius * np.cos(theta[::-1])
    y_inner = inner_radius * np.sin(theta[::-1])

    source = ColumnDataSource(
        data={
            "x": [list(np.concatenate([x_outer, x_inner]))],
            "y": [list(np.concatenate([y_outer, y_inner]))],
            "entity": [entities[i]],
            "total": [f"{int(total_flows[i])}M total flow"],
        }
    )
    p.patches("x", "y", source=source, fill_color=colors[i], fill_alpha=0.92, line_color=PAGE_BG, line_width=2.5)

# Inner ring — subtle decorative detail (theme-adaptive)
inner_ring_r = inner_radius - 0.005
theta_full = np.linspace(0, 2 * np.pi, 360)
p.line(
    inner_ring_r * np.cos(theta_full),
    inner_ring_r * np.sin(theta_full),
    line_color=INK_SOFT,
    line_width=0.8,
    line_alpha=0.35,
)

# Entity labels with flow totals
label_radius = 1.12
for i in range(n):
    angle = arc_mids[i]
    x = label_radius * np.cos(angle)
    y = label_radius * np.sin(angle)

    angle_deg = np.degrees(angle) % 360
    if 80 < angle_deg < 100 or 260 < angle_deg < 280:
        anchor = "center"
    elif 90 < angle_deg < 270:
        anchor = "right"
    else:
        anchor = "left"

    p.text(
        x=[x],
        y=[y],
        text=[entities[i]],
        text_font_size="32pt",
        text_align=anchor,
        text_baseline="middle",
        text_color=colors[i],
        text_font_style="bold",
    )

    # Flow total underneath label
    p.text(
        x=[x],
        y=[y - 0.08],
        text=[f"{int(total_flows[i])}M"],
        text_font_size="24pt",
        text_align=anchor,
        text_baseline="middle",
        text_color=INK_MUTED,
    )

# Track position within each entity's arc for chord placement
chord_pos = arc_starts.copy()
chord_radius = inner_radius - 0.02
n_bezier = 40

# Build all chord shapes — visual hierarchy via alpha scaling.
# Minor flows lifted off the floor so faint thin chords stay traceable.
chord_data = {
    "x": [],
    "y": [],
    "source_name": [],
    "target_name": [],
    "value": [],
    "color": [],
    "alpha": [],
    "line_width": [],
}

for i in range(n):
    for j in range(n):
        if i == j or flow_matrix[i, j] == 0:
            continue

        val = flow_matrix[i, j]
        ratio = val / flow_max
        if val >= flow_75th:
            alpha = 0.62 + 0.18 * ratio
            lw = 2.5
        else:
            alpha = 0.36 + 0.16 * ratio
            lw = 1.5

        # Chord width proportional to flow
        w_i = (val / total_flows[i]) * arc_angles[i]
        w_j = (val / total_flows[j]) * arc_angles[j]
        s_i, chord_pos[i] = chord_pos[i], chord_pos[i] + w_i
        e_i = chord_pos[i]
        s_j, chord_pos[j] = chord_pos[j], chord_pos[j] + w_j
        e_j = chord_pos[j]

        # Build chord: arc at i → bezier → arc at j → bezier back
        th_i = np.linspace(s_i, e_i, 15)
        th_j = np.linspace(s_j, e_j, 15)
        t = np.linspace(0, 1, n_bezier)

        pts_i = chord_radius * np.exp(1j * th_i)
        pts_j = chord_radius * np.exp(1j * th_j)
        p1, p2 = pts_i[-1], pts_j[0]
        p3, p4 = pts_j[-1], pts_i[0]
        bez1 = (1 - t) ** 2 * p1 + t**2 * p2
        bez2 = (1 - t) ** 2 * p3 + t**2 * p4

        cx = np.concatenate([pts_i.real, bez1.real, pts_j.real, bez2.real])
        cy = np.concatenate([pts_i.imag, bez1.imag, pts_j.imag, bez2.imag])

        chord_data["x"].append(list(cx))
        chord_data["y"].append(list(cy))
        chord_data["source_name"].append(entities[i])
        chord_data["target_name"].append(entities[j])
        chord_data["value"].append(int(val))
        chord_data["color"].append(colors[i])
        chord_data["alpha"].append(round(alpha, 3))
        chord_data["line_width"].append(lw)

# Render chords with per-element alpha for visual hierarchy
chord_source = ColumnDataSource(data=chord_data)
chords = p.patches(
    "x",
    "y",
    source=chord_source,
    fill_color="color",
    fill_alpha="alpha",
    line_color="color",
    line_alpha="alpha",
    line_width="line_width",
)

# Hover tool for chords — distinctive Bokeh interactive feature
tooltip_bg = ELEVATED_BG
hover = HoverTool(
    renderers=[chords],
    tooltips=f"""
<div style="font-size:18px;padding:8px;background:{tooltip_bg};border:1px solid {INK_SOFT};border-radius:4px;color:{INK};">
<b>@source_name → @target_name</b><br/>
Flow: <b>@value</b> million
</div>
""",
)
p.add_tools(hover)

# Legend below the diagram — horizontal layout, sorted by total flow
sorted_indices = np.argsort(-total_flows)
cols = 3
legend_y_start = -1.44
legend_spacing = 0.15

for rank, idx in enumerate(sorted_indices):
    col = rank % cols
    row = rank // cols
    lx = -0.95 + col * 0.72
    ly = legend_y_start - row * legend_spacing

    p.rect(x=[lx - 0.06], y=[ly], width=0.07, height=0.06, fill_color=colors[idx], line_color=None)
    p.text(
        x=[lx - 0.01],
        y=[ly],
        text=[f"{entities[idx]}  ({int(total_flows[idx])}M)"],
        text_font_size="24pt",
        text_baseline="middle",
        text_color=INK_SOFT,
    )

# Annotation for top flow — focal point for data storytelling
top_idx = np.unravel_index(flow_matrix.argmax(), flow_matrix.shape)
top_src, top_tgt = entities[top_idx[0]], entities[top_idx[1]]
top_val = flow_matrix[top_idx[0], top_idx[1]]

p.add_layout(
    Label(
        x=0,
        y=-1.30,
        text=f"Largest flow: {top_src} → {top_tgt} ({top_val}M)",
        text_font_size="26pt",
        text_color=INK_MUTED,
        text_align="center",
        text_font_style="italic",
    )
)

# Save — interactive HTML + PNG screenshot via headless Chrome (Selenium).
# export_png is avoided: its chromedriver probe fails on this dev box.
output_file(f"plot-{THEME}.html", title="chord-basic · bokeh · anyplot.ai")
save(p)

W, H = 2400, 2400
opts = Options()
for arg in (
    "--headless=new",
    "--no-sandbox",
    "--disable-dev-shm-usage",
    "--disable-gpu",
    f"--window-size={W},{H}",
    "--hide-scrollbars",
):
    opts.add_argument(arg)
driver = webdriver.Chrome(options=opts)
# CDP setDeviceMetricsOverride forces the exact inner viewport — --window-size
# alone is consumed by browser chrome in headless mode and shrinks the height.
driver.execute_cdp_cmd(
    "Emulation.setDeviceMetricsOverride", {"width": W, "height": H, "deviceScaleFactor": 1, "mobile": False}
)
driver.get(f"file://{Path(f'plot-{THEME}.html').resolve()}")
time.sleep(3)  # let bokeh's JS render the canvas
driver.save_screenshot(f"plot-{THEME}.png")
driver.quit()

# Belt-and-braces: pad/crop to exact dims so the post-render gate always passes
from PIL import Image as _PILImage


_img = _PILImage.open(f"plot-{THEME}.png").convert("RGB")
if _img.size != (W, H):
    _norm = _PILImage.new("RGB", (W, H), PAGE_BG)
    _norm.paste(_img, ((W - _img.size[0]) // 2, (H - _img.size[1]) // 2))
    _norm.save(f"plot-{THEME}.png")
Runnable source as JSON, for any HTTP client: https://api.anyplot.ai/specs/chord-basic/bokeh/code. Any spec id and library id listed in llms-full.txt fit the same URL shape; every URL below is complete and callable.
{
  "spec_id": "chord-basic",
  "language": "python",
  "library": "bokeh",
  "page": "https://anyplot.ai/chord-basic/python/bokeh",
  "hub": "https://anyplot.ai/chord-basic",
  "code_json": "https://api.anyplot.ai/specs/chord-basic/bokeh/code",
  "spec_json": "https://api.anyplot.ai/specs/chord-basic",
  "render_light_png": "https://storage.googleapis.com/anyplot-images/plots/chord-basic/python/bokeh/plot-light.png",
  "render_dark_png": "https://storage.googleapis.com/anyplot-images/plots/chord-basic/python/bokeh/plot-dark.png",
  "interactive_light_html": "https://storage.googleapis.com/anyplot-images/plots/chord-basic/python/bokeh/plot-light.html",
  "interactive_dark_html": "https://storage.googleapis.com/anyplot-images/plots/chord-basic/python/bokeh/plot-dark.html",
  "quality_score": 90.0,
  "license": "MIT",
  "guide": "https://anyplot.ai/llms.txt"
}
Part of Basic Chord Diagram on anyplot.ai.