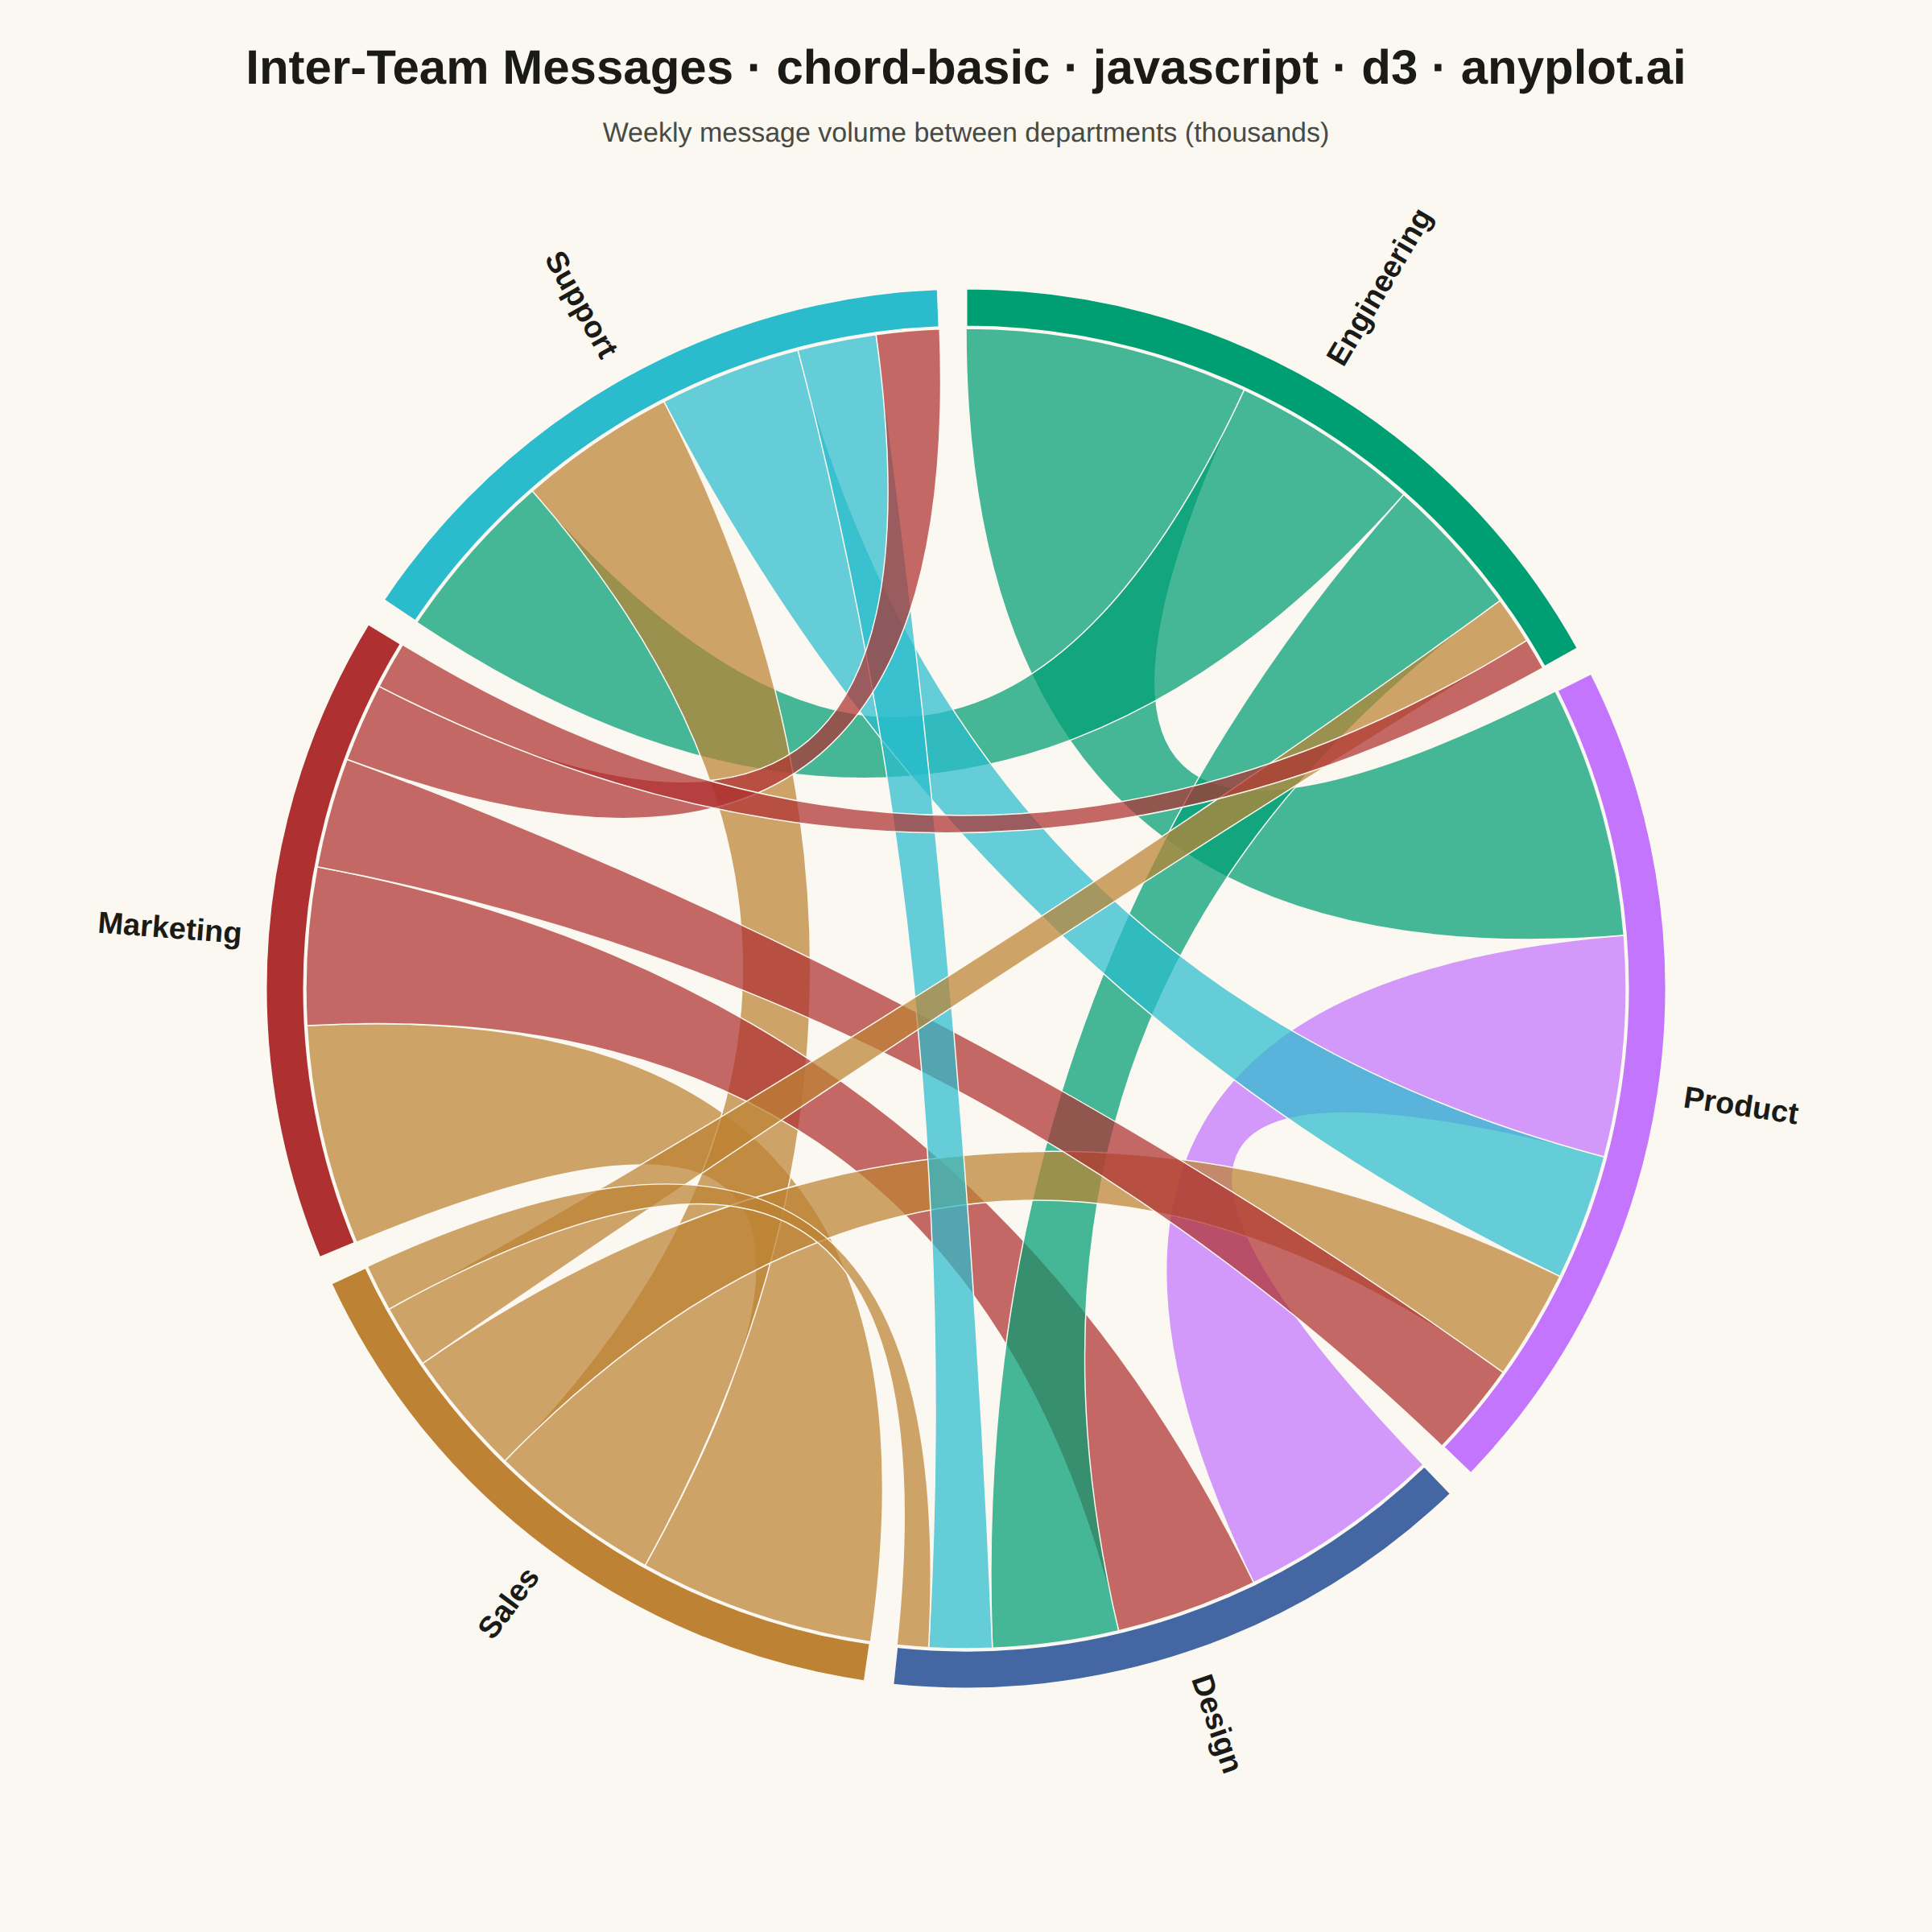
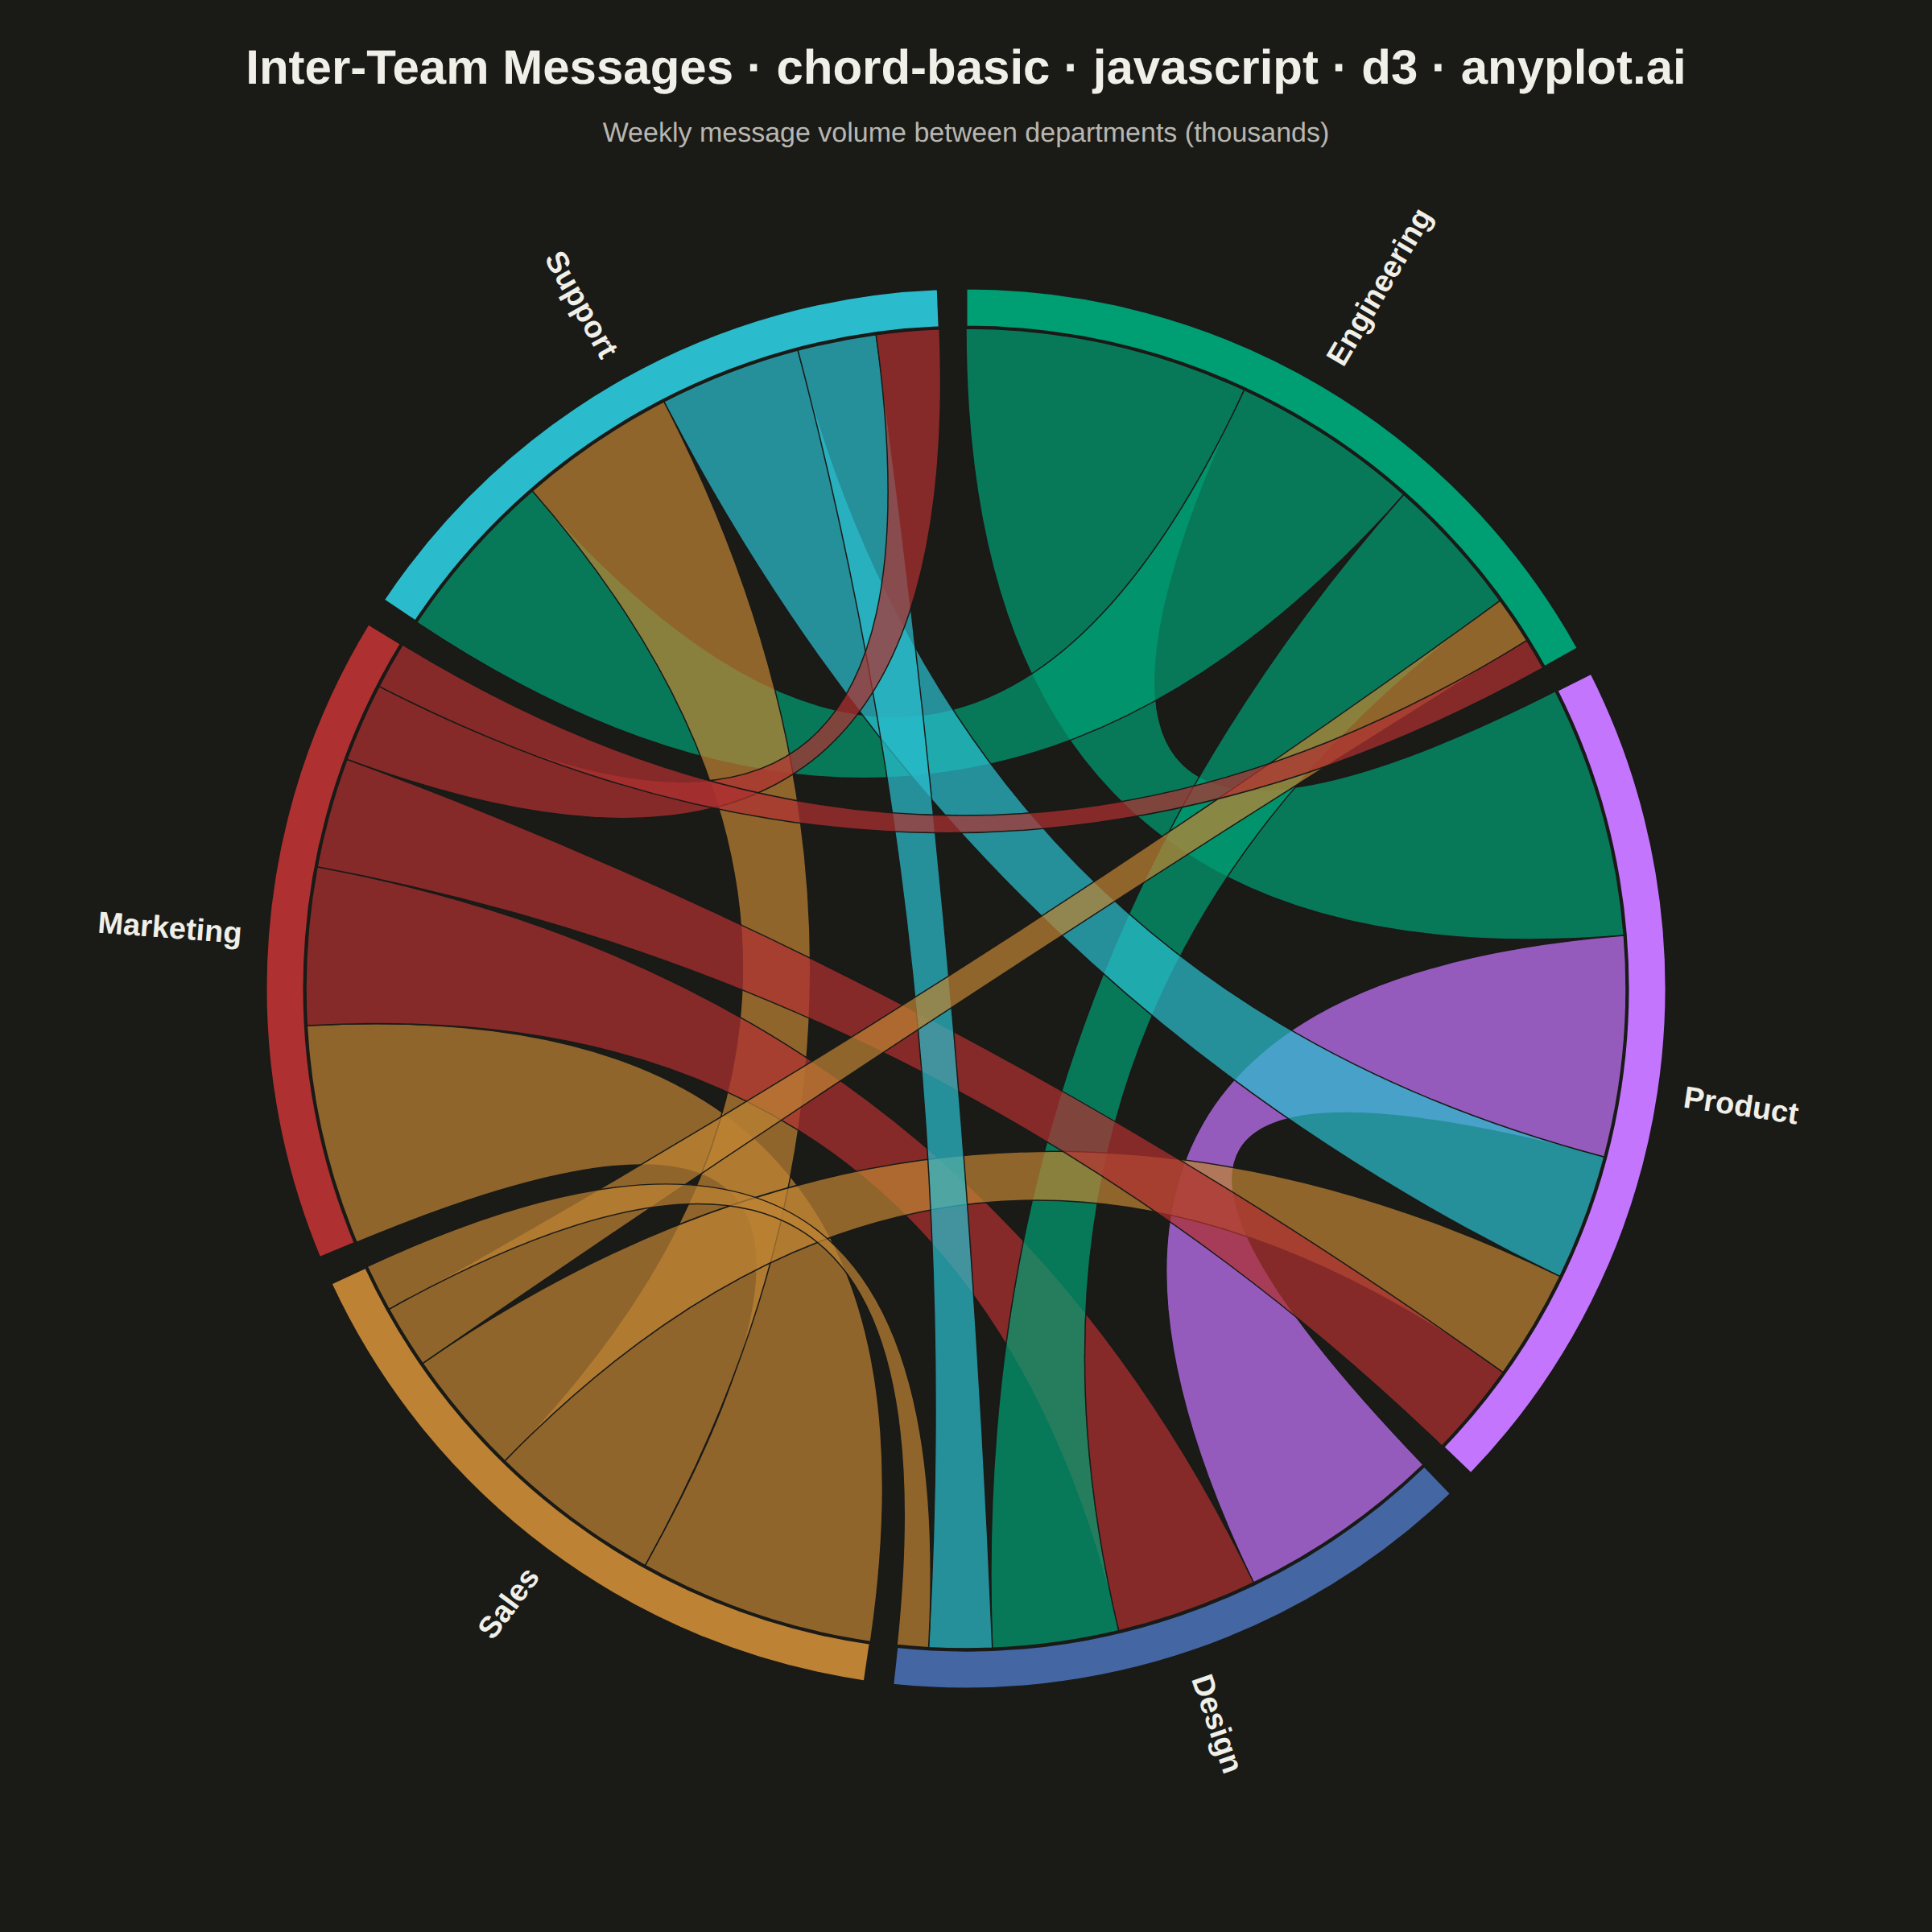
A chord diagram displays relationships or flows between entities arranged around a circle's perimeter. Arcs (chords) connect related entities, with chord width proportional to the flow magnitude. This visualization excels at revealing the overall structure of connections and identifying the strongest relationships within a system.
// anyplot.ai
// chord-basic: Basic Chord Diagram
// Library: d3 7.9.0 | JavaScript 22.22.3
// Quality: 92/100 | Created: 2026-06-17
//# anyplot-orientation: square
// anyplot.ai
// chord-basic: Basic Chord Diagram
// Library: d3 7.9.0 | JavaScript 22
// Quality: pending | Created: 2026-06-17

const t = window.ANYPLOT_TOKENS;
const { width, height } = window.ANYPLOT_SIZE;

// --- Data (in-memory, deterministic) ---------------------------------------
// Weekly cross-team messages (thousands) between six departments. The matrix is
// directional: matrix[i][j] = messages sent FROM department i TO department j.
const departments = [
  "Engineering",
  "Product",
  "Design",
  "Sales",
  "Marketing",
  "Support",
];

const matrix = [
  //  Eng  Prod Des  Sale Mkt  Supp
  [0, 18, 9, 3, 2, 12], // Engineering →
  [16, 0, 14, 7, 6, 8], // Product →
  [8, 13, 0, 2, 9, 4], // Design →
  [4, 8, 3, 0, 15, 11], // Sales →
  [3, 7, 10, 14, 0, 5], // Marketing →
  [11, 9, 5, 10, 4, 0], // Support →
];

// --- Geometry ---------------------------------------------------------------
const cx = width / 2;
const cy = height / 2 + 14; // nudge down to clear the title
const outerRadius = Math.min(width, height) * 0.5 - 165;
const innerRadius = outerRadius - 24;

// --- Imprint categorical colour per department (first = brand green) --------
const color = d3
  .scaleOrdinal()
  .domain(d3.range(departments.length))
  .range(t.palette);

// --- Chord layout -----------------------------------------------------------
const chord = d3
  .chord()
  .padAngle(0.04)
  .sortSubgroups(d3.descending)
  .sortChords(d3.descending);

const chords = chord(matrix);

const arc = d3.arc().innerRadius(innerRadius).outerRadius(outerRadius);
const ribbon = d3.ribbon().radius(innerRadius - 1);
const fmt = d3.format(",.0f");

// --- SVG mount --------------------------------------------------------------
const svg = d3
  .select("#container")
  .append("svg")
  .attr("width", width)
  .attr("height", height);

const g = svg.append("g").attr("transform", `translate(${cx},${cy})`);

// --- Ribbons (flows), coloured by source department -------------------------
g.append("g")
  .attr("fill-opacity", 0.72)
  .selectAll("path")
  .data(chords)
  .join("path")
  .attr("d", ribbon)
  .attr("fill", (d) => color(d.source.index))
  .attr("stroke", t.pageBg)
  .attr("stroke-width", 0.75)
  .append("title")
  .text(
    (d) =>
      `${departments[d.source.index]} → ${departments[d.target.index]}: ${fmt(
        d.source.value,
      )}k\n${departments[d.target.index]} → ${departments[d.source.index]}: ${fmt(
        d.target.value,
      )}k`,
  );

// --- Outer arcs (departments) ----------------------------------------------
const group = g
  .append("g")
  .selectAll("g")
  .data(chords.groups)
  .join("g");

group
  .append("path")
  .attr("d", arc)
  .attr("fill", (d) => color(d.index))
  .attr("stroke", t.pageBg)
  .attr("stroke-width", 1.5)
  .append("title")
  .text(
    (d) => `${departments[d.index]}: ${fmt(d.value)}k messages total`,
  );

// --- Department labels, rotated tangent to the arc --------------------------
group
  .append("text")
  .each((d) => {
    d.angle = (d.startAngle + d.endAngle) / 2;
  })
  .attr("dy", "0.35em")
  .attr("transform", (d) => {
    const rot = (d.angle * 180) / Math.PI - 90;
    const flip = d.angle > Math.PI ? "rotate(180)" : "";
    return `rotate(${rot}) translate(${outerRadius + 16},0) ${flip}`;
  })
  .attr("text-anchor", (d) => (d.angle > Math.PI ? "end" : "start"))
  .attr("fill", t.ink)
  .style("font-size", "19px")
  .style("font-weight", "600")
  .text((d) => departments[d.index]);

// --- Title ------------------------------------------------------------------
svg
  .append("text")
  .attr("x", width / 2)
  .attr("y", 52)
  .attr("text-anchor", "middle")
  .attr("fill", t.ink)
  .style("font-size", "30px")
  .style("font-weight", "600")
  .text("Inter-Team Messages · chord-basic · javascript · d3 · anyplot.ai");

// --- Subtitle ---------------------------------------------------------------
svg
  .append("text")
  .attr("x", width / 2)
  .attr("y", 88)
  .attr("text-anchor", "middle")
  .attr("fill", t.inkSoft)
  .style("font-size", "17px")
  .text("Weekly message volume between departments (thousands)");
Runnable source as JSON, for any HTTP client: https://api.anyplot.ai/specs/chord-basic/d3/code. Any spec id and library id listed in llms-full.txt fit the same URL shape; every URL below is complete and callable.
{
  "spec_id": "chord-basic",
  "language": "javascript",
  "library": "d3",
  "page": "https://anyplot.ai/chord-basic/javascript/d3",
  "hub": "https://anyplot.ai/chord-basic",
  "code_json": "https://api.anyplot.ai/specs/chord-basic/d3/code",
  "spec_json": "https://api.anyplot.ai/specs/chord-basic",
  "render_light_png": "https://storage.googleapis.com/anyplot-images/plots/chord-basic/javascript/d3/plot-light.png",
  "render_dark_png": "https://storage.googleapis.com/anyplot-images/plots/chord-basic/javascript/d3/plot-dark.png",
  "interactive_light_html": "https://storage.googleapis.com/anyplot-images/plots/chord-basic/javascript/d3/plot-light.html",
  "interactive_dark_html": "https://storage.googleapis.com/anyplot-images/plots/chord-basic/javascript/d3/plot-dark.html",
  "quality_score": 92.0,
  "license": "MIT",
  "guide": "https://anyplot.ai/llms.txt"
}
Part of Basic Chord Diagram on anyplot.ai.