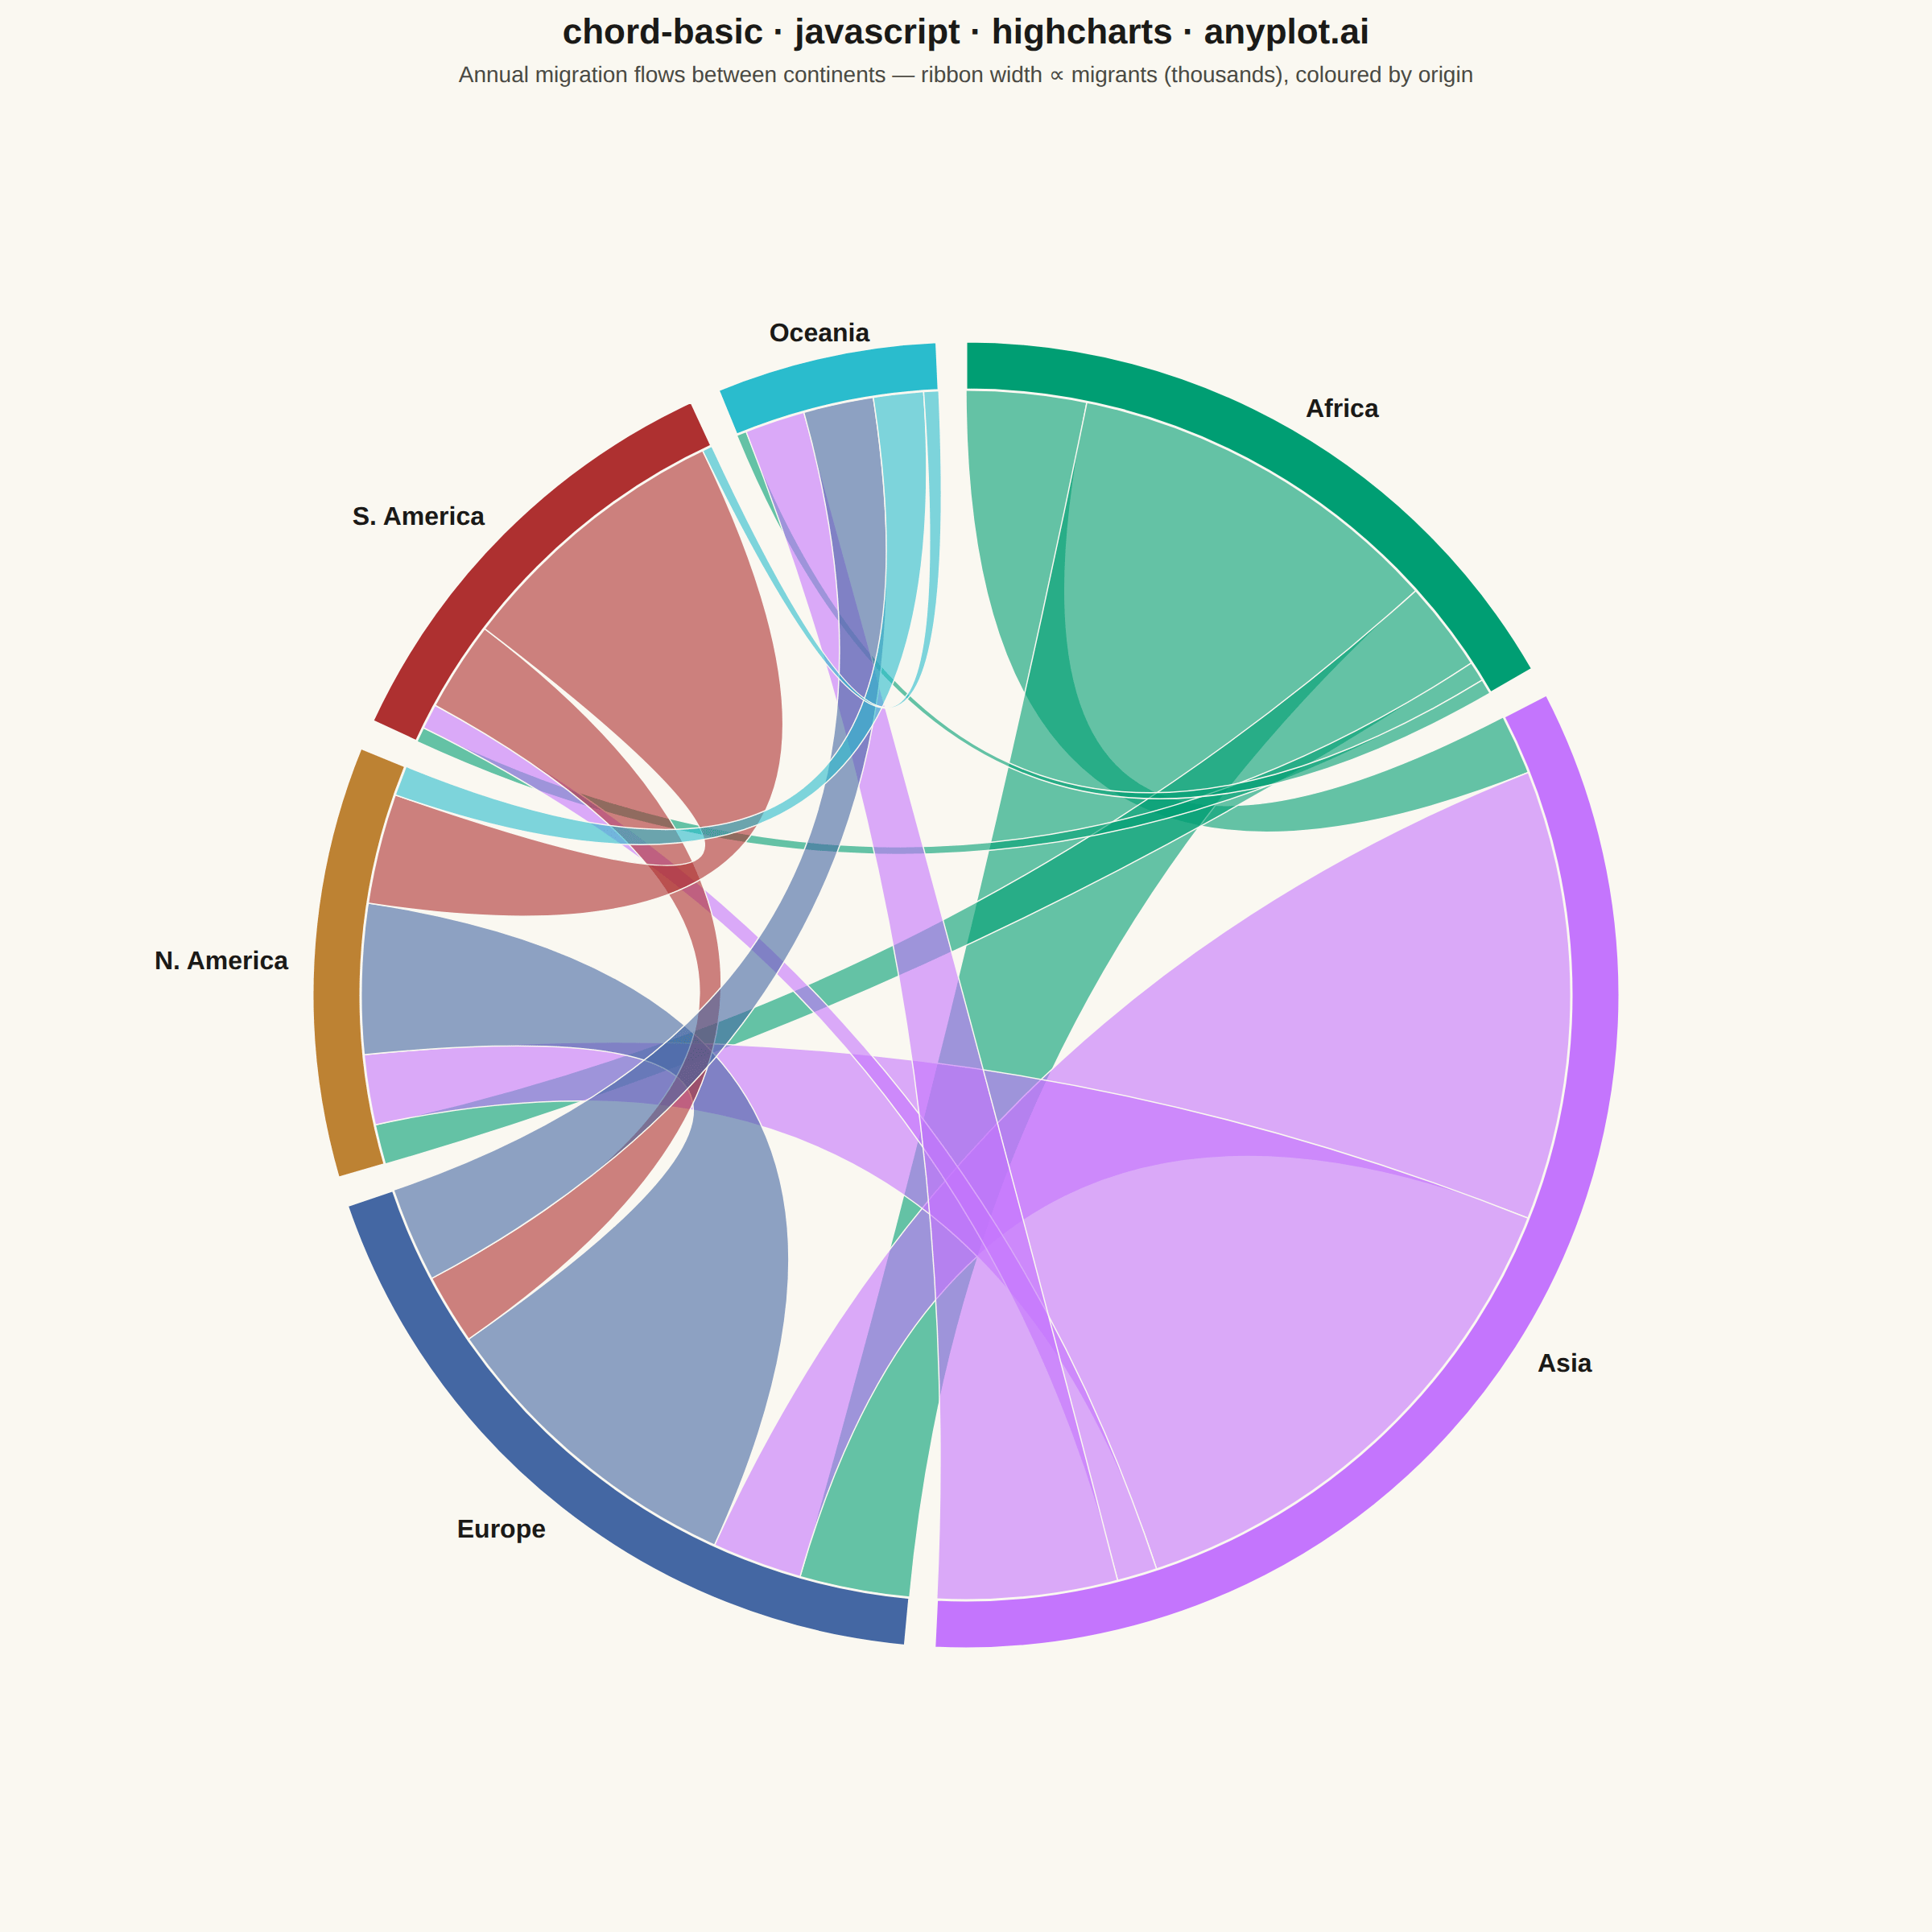
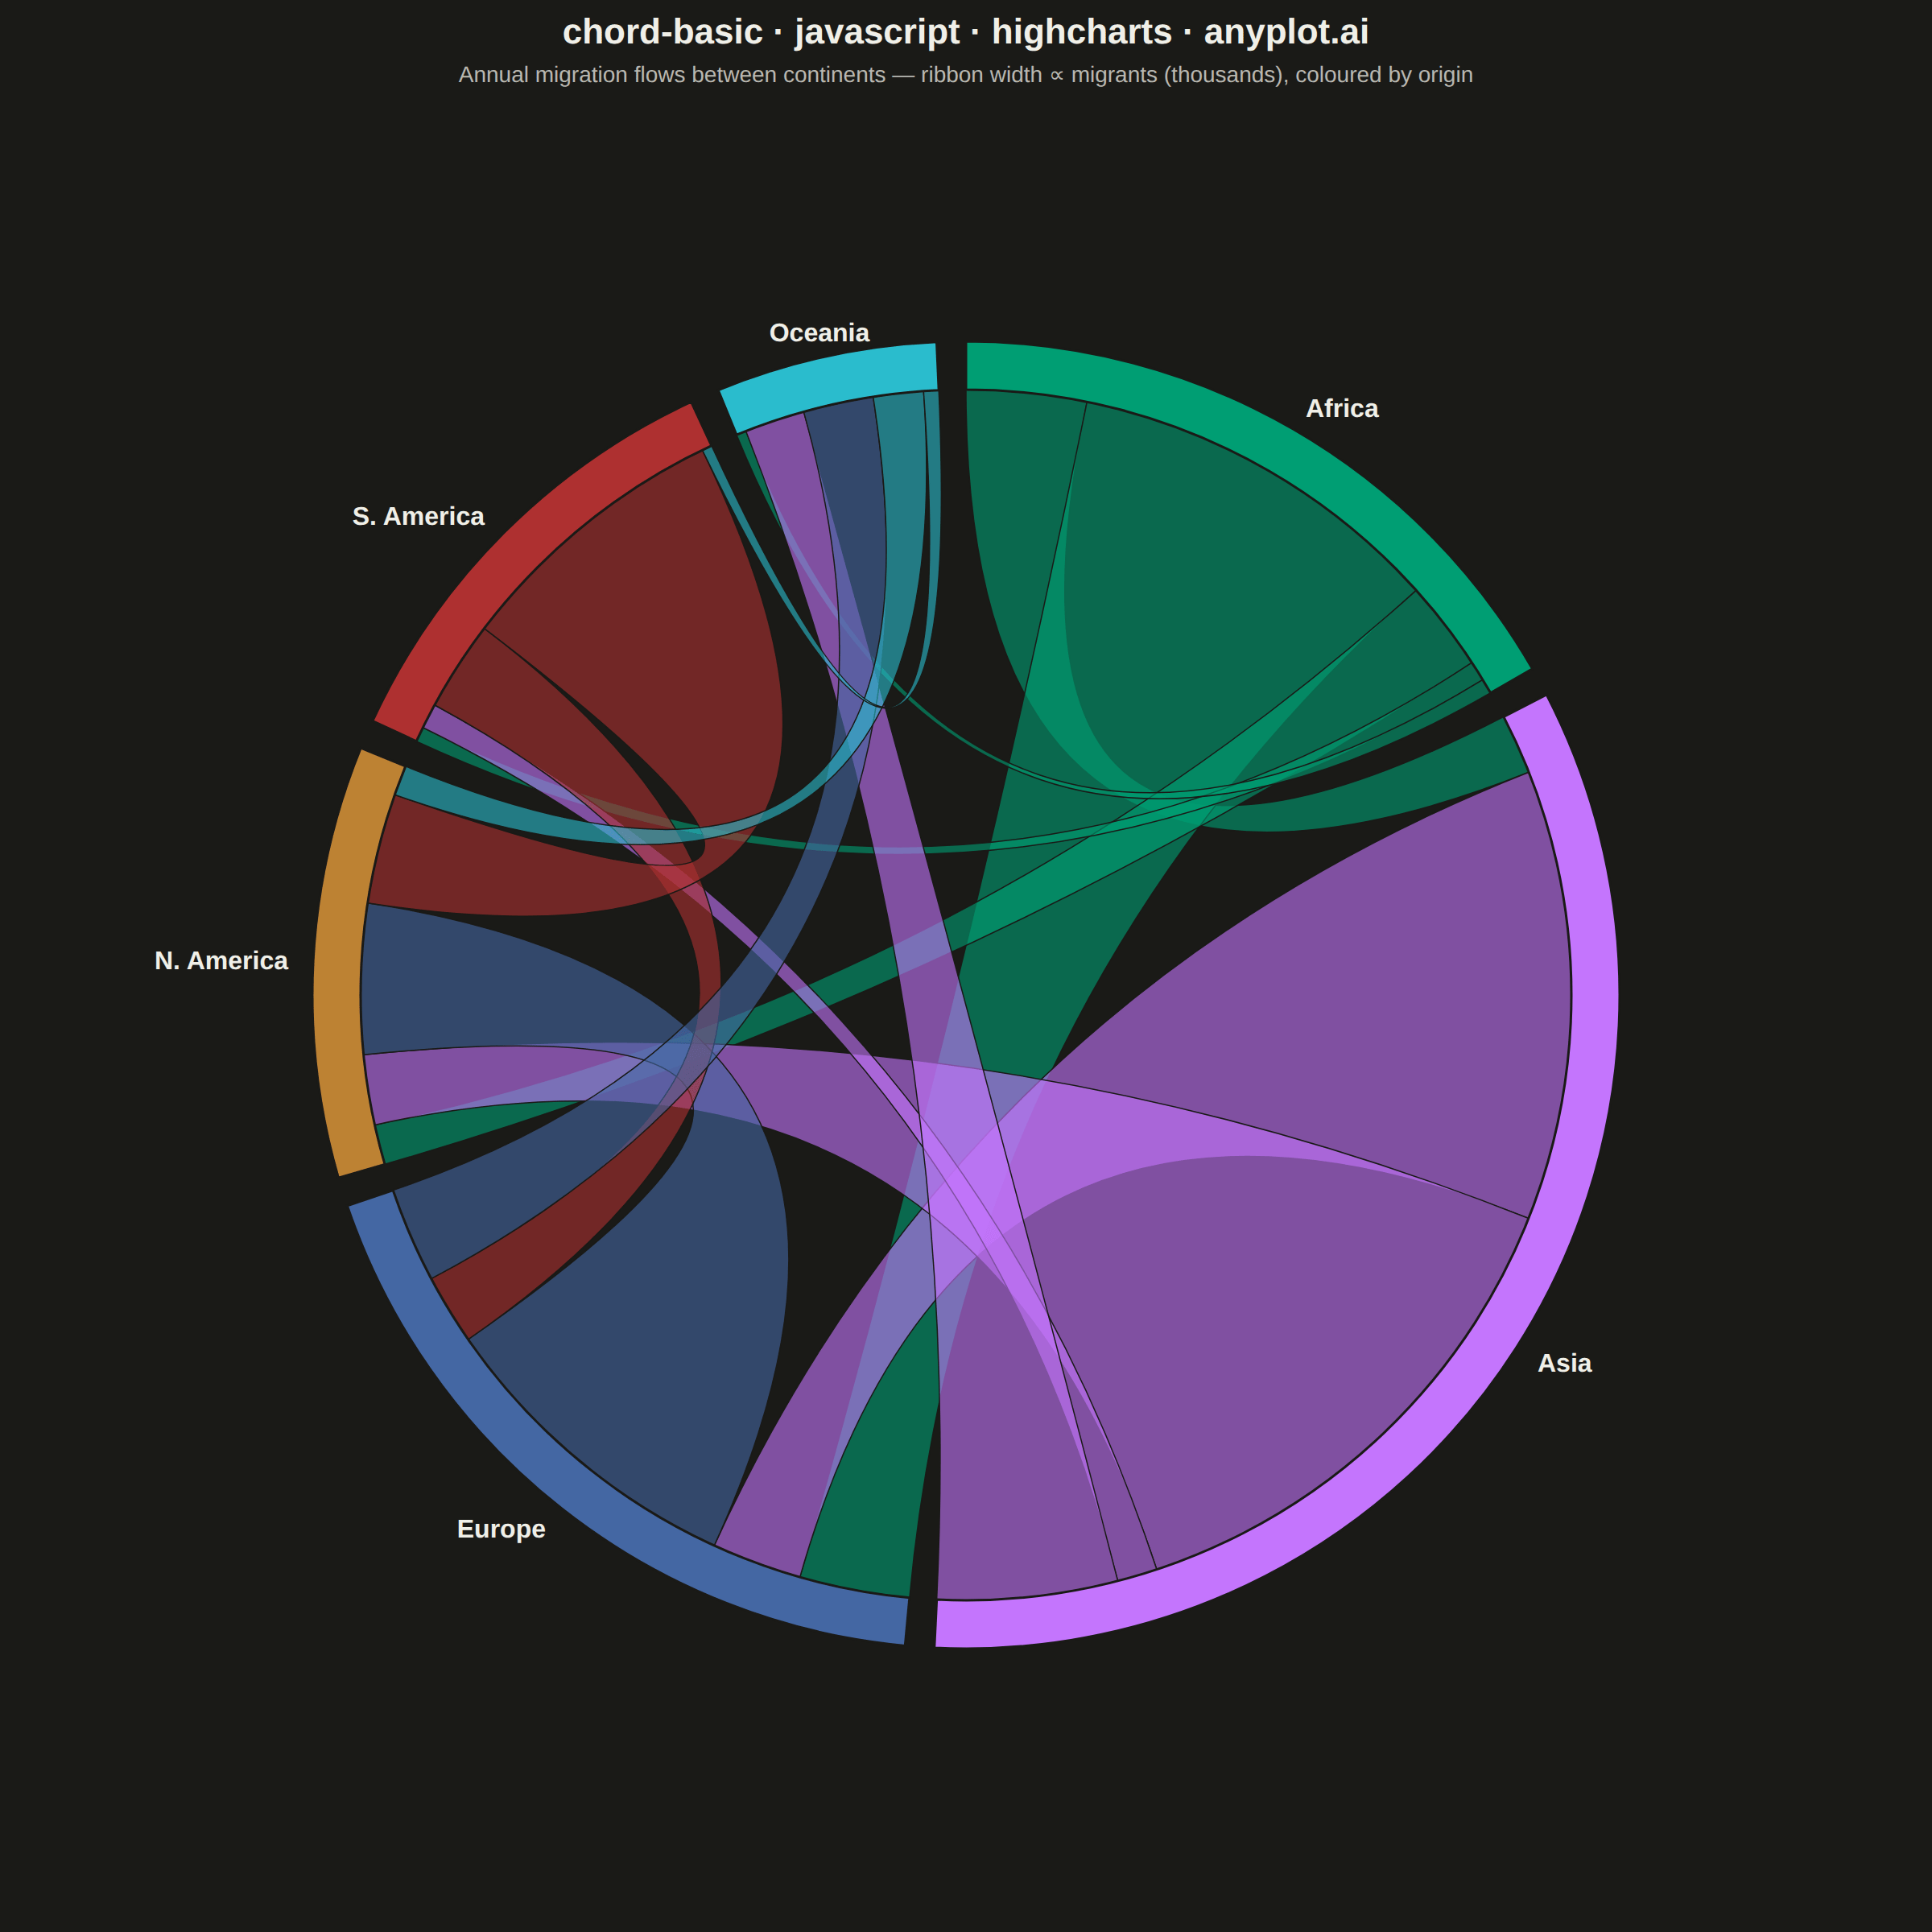
A chord diagram displays relationships or flows between entities arranged around a circle's perimeter. Arcs (chords) connect related entities, with chord width proportional to the flow magnitude. This visualization excels at revealing the overall structure of connections and identifying the strongest relationships within a system.
// anyplot.ai
// chord-basic: Basic Chord Diagram
// Library: highcharts 12.6.0 | JavaScript 22.22.3
// Quality: 93/100 | Created: 2026-06-17
//# anyplot-orientation: square

// Highcharts' dependency-wheel / sankey chord series lives in an add-on module
// that is not vendored — only the core bundle (with its SVGRenderer) is loaded.
// So we build a genuine chord diagram natively with `chart.renderer`: annular
// arcs for each continent and quadratic-bezier ribbons (width ∝ flow) for the
// migration links. No other charting library is used.

const t = window.ANYPLOT_TOKENS;

// --- Data: annual migration flows between 6 continents (thousands/year) ------
// matrix[i][j] = people moving FROM continent i TO continent j. Deterministic,
// in-memory. Diagonal is 0 (internal moves are not inter-continental flows).
const labels = [
  "Africa",
  "Asia",
  "Europe",
  "N. America",
  "S. America",
  "Oceania",
];
// prettier-ignore
const matrix = [
  //  Af   As   Eu   NA   SA   Oc
  [    0, 120, 380,  90,  20,  15 ], // Africa
  [   60,   0, 450, 520,  40, 180 ], // Asia
  [  110,  90,   0, 320,  70,  95 ], // Europe
  [   40,  70, 150,   0, 110,  30 ], // N. America
  [   15,  25,  90, 280,   0,  10 ], // S. America
  [   10,  60,  70,  50,  15,   0 ], // Oceania
];
const n = labels.length;

// Each continent is an abstract category, so the Imprint palette is used in
// canonical order — Africa = brand green (palette[0]).
const groupColor = (i) => t.palette[i % t.palette.length];

// --- Angular layout (d3-chord convention) -----------------------------------
// Group i's arc length is proportional to its total outgoing flow (row sum).
// Within that arc, a sub-arc of width matrix[i][j] is reserved for the link to
// j; the ribbon for pair (i,j) joins sub[i][j] on arc i with sub[j][i] on arc j.
const GAP = 0.045; // radians of padding between adjacent group arcs
const rowSum = matrix.map((row) => row.reduce((a, b) => a + b, 0));
const totalFlow = rowSum.reduce((a, b) => a + b, 0);
const scale = (2 * Math.PI - n * GAP) / totalFlow;

const groups = []; // [startAngle, endAngle] per continent
const sub = []; // sub[i][j] = [startAngle, endAngle] of the i→j slice on arc i
let angle = -Math.PI / 2; // start at the top, sweep clockwise
for (let i = 0; i < n; i++) {
  sub[i] = [];
  const gStart = angle;
  for (let j = 0; j < n; j++) {
    const w = matrix[i][j] * scale;
    sub[i][j] = [angle, angle + w];
    angle += w;
  }
  groups.push([gStart, angle]);
  angle += GAP;
}

// --- Build the chart shell, then draw with the SVG renderer ------------------
const chart = Highcharts.chart("container", {
  chart: {
    backgroundColor: "transparent",
    animation: false,
    style: { fontFamily: "inherit" },
    marginTop: 96,
    marginBottom: 60,
    marginLeft: 60,
    marginRight: 60,
  },
  credits: { enabled: false },
  colors: t.palette,
  title: {
    text: "chord-basic · javascript · highcharts · anyplot.ai",
    style: { color: t.ink, fontSize: "22px", fontWeight: "600" },
  },
  subtitle: {
    text: "Annual migration flows between continents — ribbon width ∝ migrants (thousands), coloured by origin",
    style: { color: t.inkSoft, fontSize: "14px" },
  },
  xAxis: { visible: false },
  yAxis: { visible: false },
  legend: { enabled: false },
  plotOptions: { series: { animation: false } },
  series: [],
});

// Geometry helpers in pixel space (independent of any axis).
const cx = chart.plotLeft + chart.plotWidth / 2;
const cy = chart.plotTop + chart.plotHeight / 2;
const radiusMax = Math.min(chart.plotWidth, chart.plotHeight) / 2;
const ro = radiusMax - 116; // outer edge of the arc band
const ri = ro - 30; // inner edge of the arc band == ribbon anchor radius

const pt = (a, r) => [cx + r * Math.cos(a), cy + r * Math.sin(a)];
const f = (v) => v.toFixed(2);
const large = (a0, a1) => (Math.abs(a1 - a0) > Math.PI ? 1 : 0);

// Annular sector (a group's arc band) as an SVG path string.
function arcBand(a0, a1, rIn, rOut) {
  const [x0o, y0o] = pt(a0, rOut);
  const [x1o, y1o] = pt(a1, rOut);
  const [x1i, y1i] = pt(a1, rIn);
  const [x0i, y0i] = pt(a0, rIn);
  const la = large(a0, a1);
  return (
    `M ${f(x0o)} ${f(y0o)} A ${f(rOut)} ${f(rOut)} 0 ${la} 1 ${f(x1o)} ${f(y1o)} ` +
    `L ${f(x1i)} ${f(y1i)} A ${f(rIn)} ${f(rIn)} 0 ${la} 0 ${f(x0i)} ${f(y0i)} Z`
  );
}

// Ribbon between two sub-arcs (each [a0,a1]) at radius r, curving through centre.
function ribbon([si0, si1], [sj0, sj1], r) {
  const [ax, ay] = pt(si0, r);
  const [bx, by] = pt(si1, r);
  const [cxp, cyp] = pt(sj0, r);
  const [dx, dy] = pt(sj1, r);
  return (
    `M ${f(ax)} ${f(ay)} A ${f(r)} ${f(r)} 0 ${large(si0, si1)} 1 ${f(bx)} ${f(by)} ` +
    `Q ${f(cx)} ${f(cy)} ${f(cxp)} ${f(cyp)} ` +
    `A ${f(r)} ${f(r)} 0 ${large(sj0, sj1)} 1 ${f(dx)} ${f(dy)} ` +
    `Q ${f(cx)} ${f(cy)} ${f(ax)} ${f(ay)} Z`
  );
}

const g = chart.renderer.g("chord").add();

// Ribbons first (one per unordered pair) so the solid arcs sit on top.
for (let i = 0; i < n; i++) {
  for (let j = i + 1; j < n; j++) {
    if (matrix[i][j] === 0 && matrix[j][i] === 0) continue;
    // Colour the ribbon by the dominant direction's origin.
    const src = matrix[i][j] >= matrix[j][i] ? i : j;
    const color = groupColor(src);
    const path = chart.renderer
      .path()
      .attr({
        fill: color,
        "fill-opacity": 0.6,
        stroke: t.pageBg,
        "stroke-width": 0.75,
      })
      .add(g);
    path.element.setAttribute("d", ribbon(sub[i][j], sub[j][i], ri));
    // Honest hover detail for the interactive HTML view (absent from the PNG).
    const title = document.createElementNS(
      "http://www.w3.org/2000/svg",
      "title",
    );
    title.textContent =
      `${labels[i]} → ${labels[j]}: ${matrix[i][j]}k · ` +
      `${labels[j]} → ${labels[i]}: ${matrix[j][i]}k`;
    path.element.appendChild(title);
  }
}

// Group arcs + radial labels on top.
for (let i = 0; i < n; i++) {
  const [a0, a1] = groups[i];
  const arc = chart.renderer
    .path()
    .attr({ fill: groupColor(i), stroke: t.pageBg, "stroke-width": 1.5 })
    .add(g);
  arc.element.setAttribute("d", arcBand(a0, a1, ri, ro));

  const mid = (a0 + a1) / 2;
  const [lx, ly] = pt(mid, ro + 16);
  const cosM = Math.cos(mid);
  const align = Math.abs(cosM) < 0.25 ? "center" : cosM > 0 ? "left" : "right";
  chart.renderer
    .text(labels[i], lx, ly + 6)
    .attr({ align })
    .css({ color: t.ink, fontSize: "16px", fontWeight: "600" })
    .add(g);
}

// Static-frame timing signal for the harness.
window.__anyplotReady = true;
Runnable source as JSON, for any HTTP client: https://api.anyplot.ai/specs/chord-basic/highcharts/code. Any spec id and library id listed in llms-full.txt fit the same URL shape; every URL below is complete and callable.
{
  "spec_id": "chord-basic",
  "language": "javascript",
  "library": "highcharts",
  "page": "https://anyplot.ai/chord-basic/javascript/highcharts",
  "hub": "https://anyplot.ai/chord-basic",
  "code_json": "https://api.anyplot.ai/specs/chord-basic/highcharts/code",
  "spec_json": "https://api.anyplot.ai/specs/chord-basic",
  "render_light_png": "https://storage.googleapis.com/anyplot-images/plots/chord-basic/javascript/highcharts/plot-light.png",
  "render_dark_png": "https://storage.googleapis.com/anyplot-images/plots/chord-basic/javascript/highcharts/plot-dark.png",
  "interactive_light_html": "https://storage.googleapis.com/anyplot-images/plots/chord-basic/javascript/highcharts/plot-light.html",
  "interactive_dark_html": "https://storage.googleapis.com/anyplot-images/plots/chord-basic/javascript/highcharts/plot-dark.html",
  "quality_score": 93.0,
  "license": "MIT",
  "guide": "https://anyplot.ai/llms.txt"
}
Part of Basic Chord Diagram on anyplot.ai.