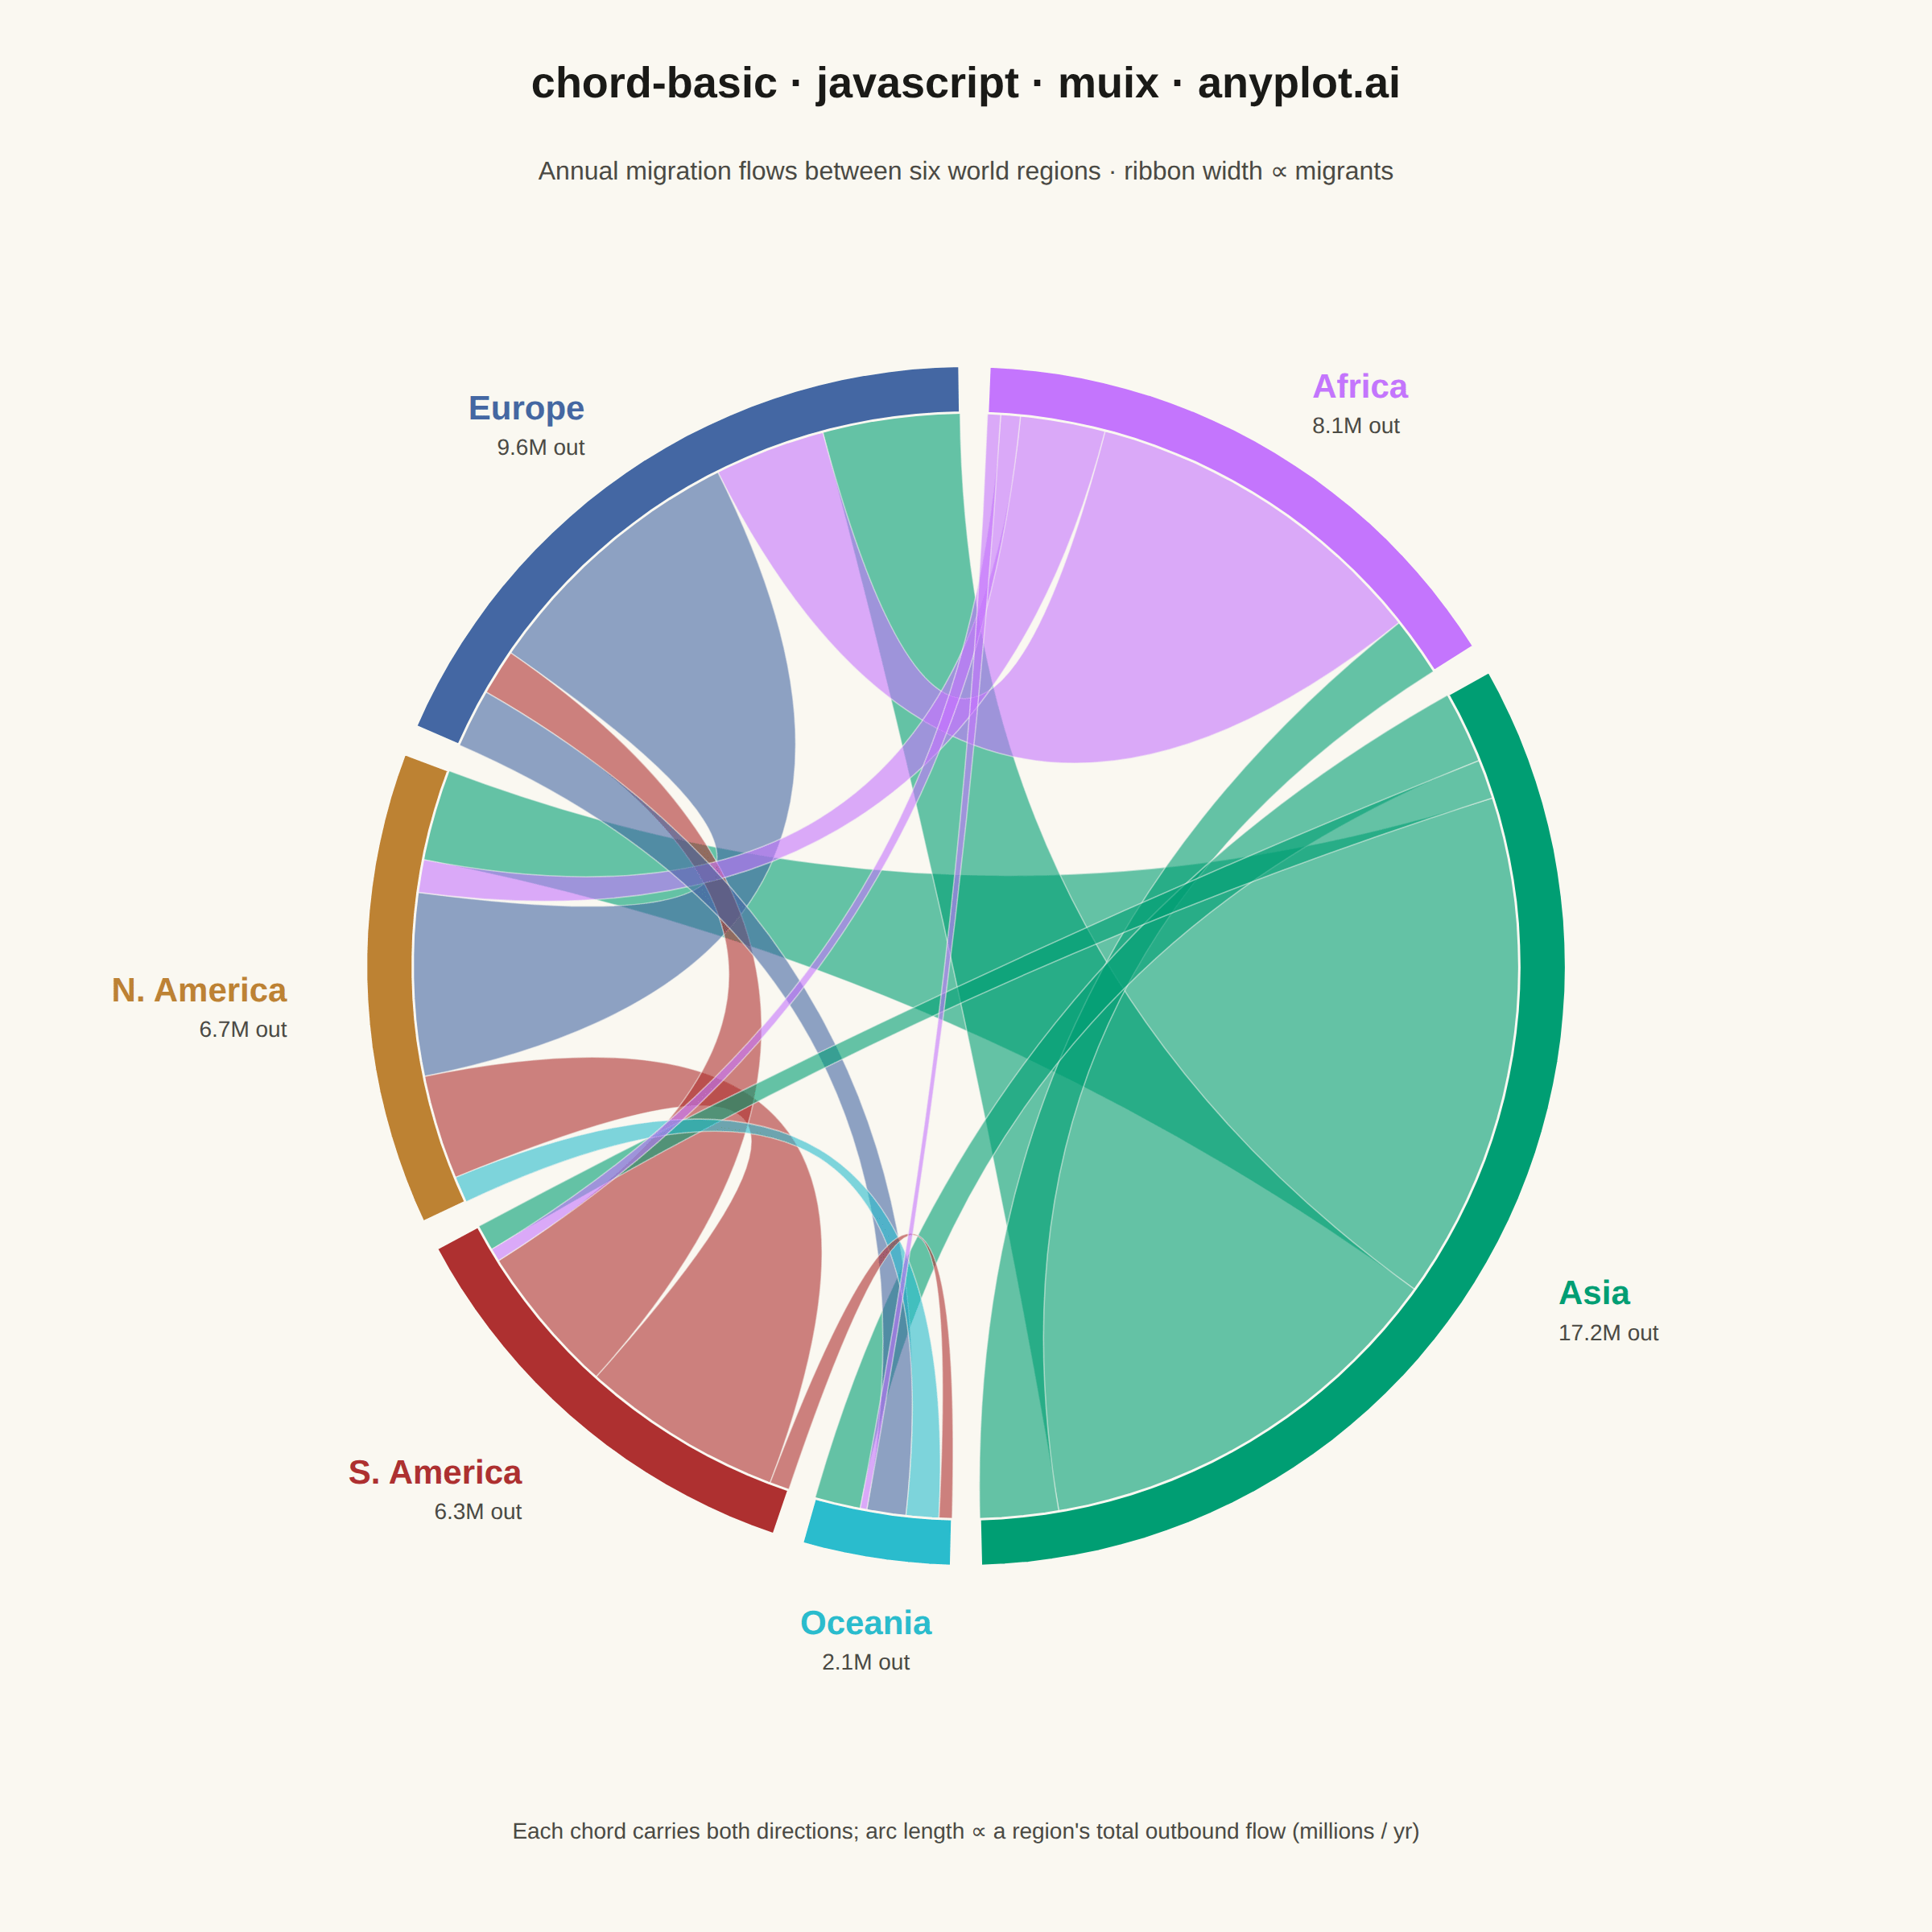
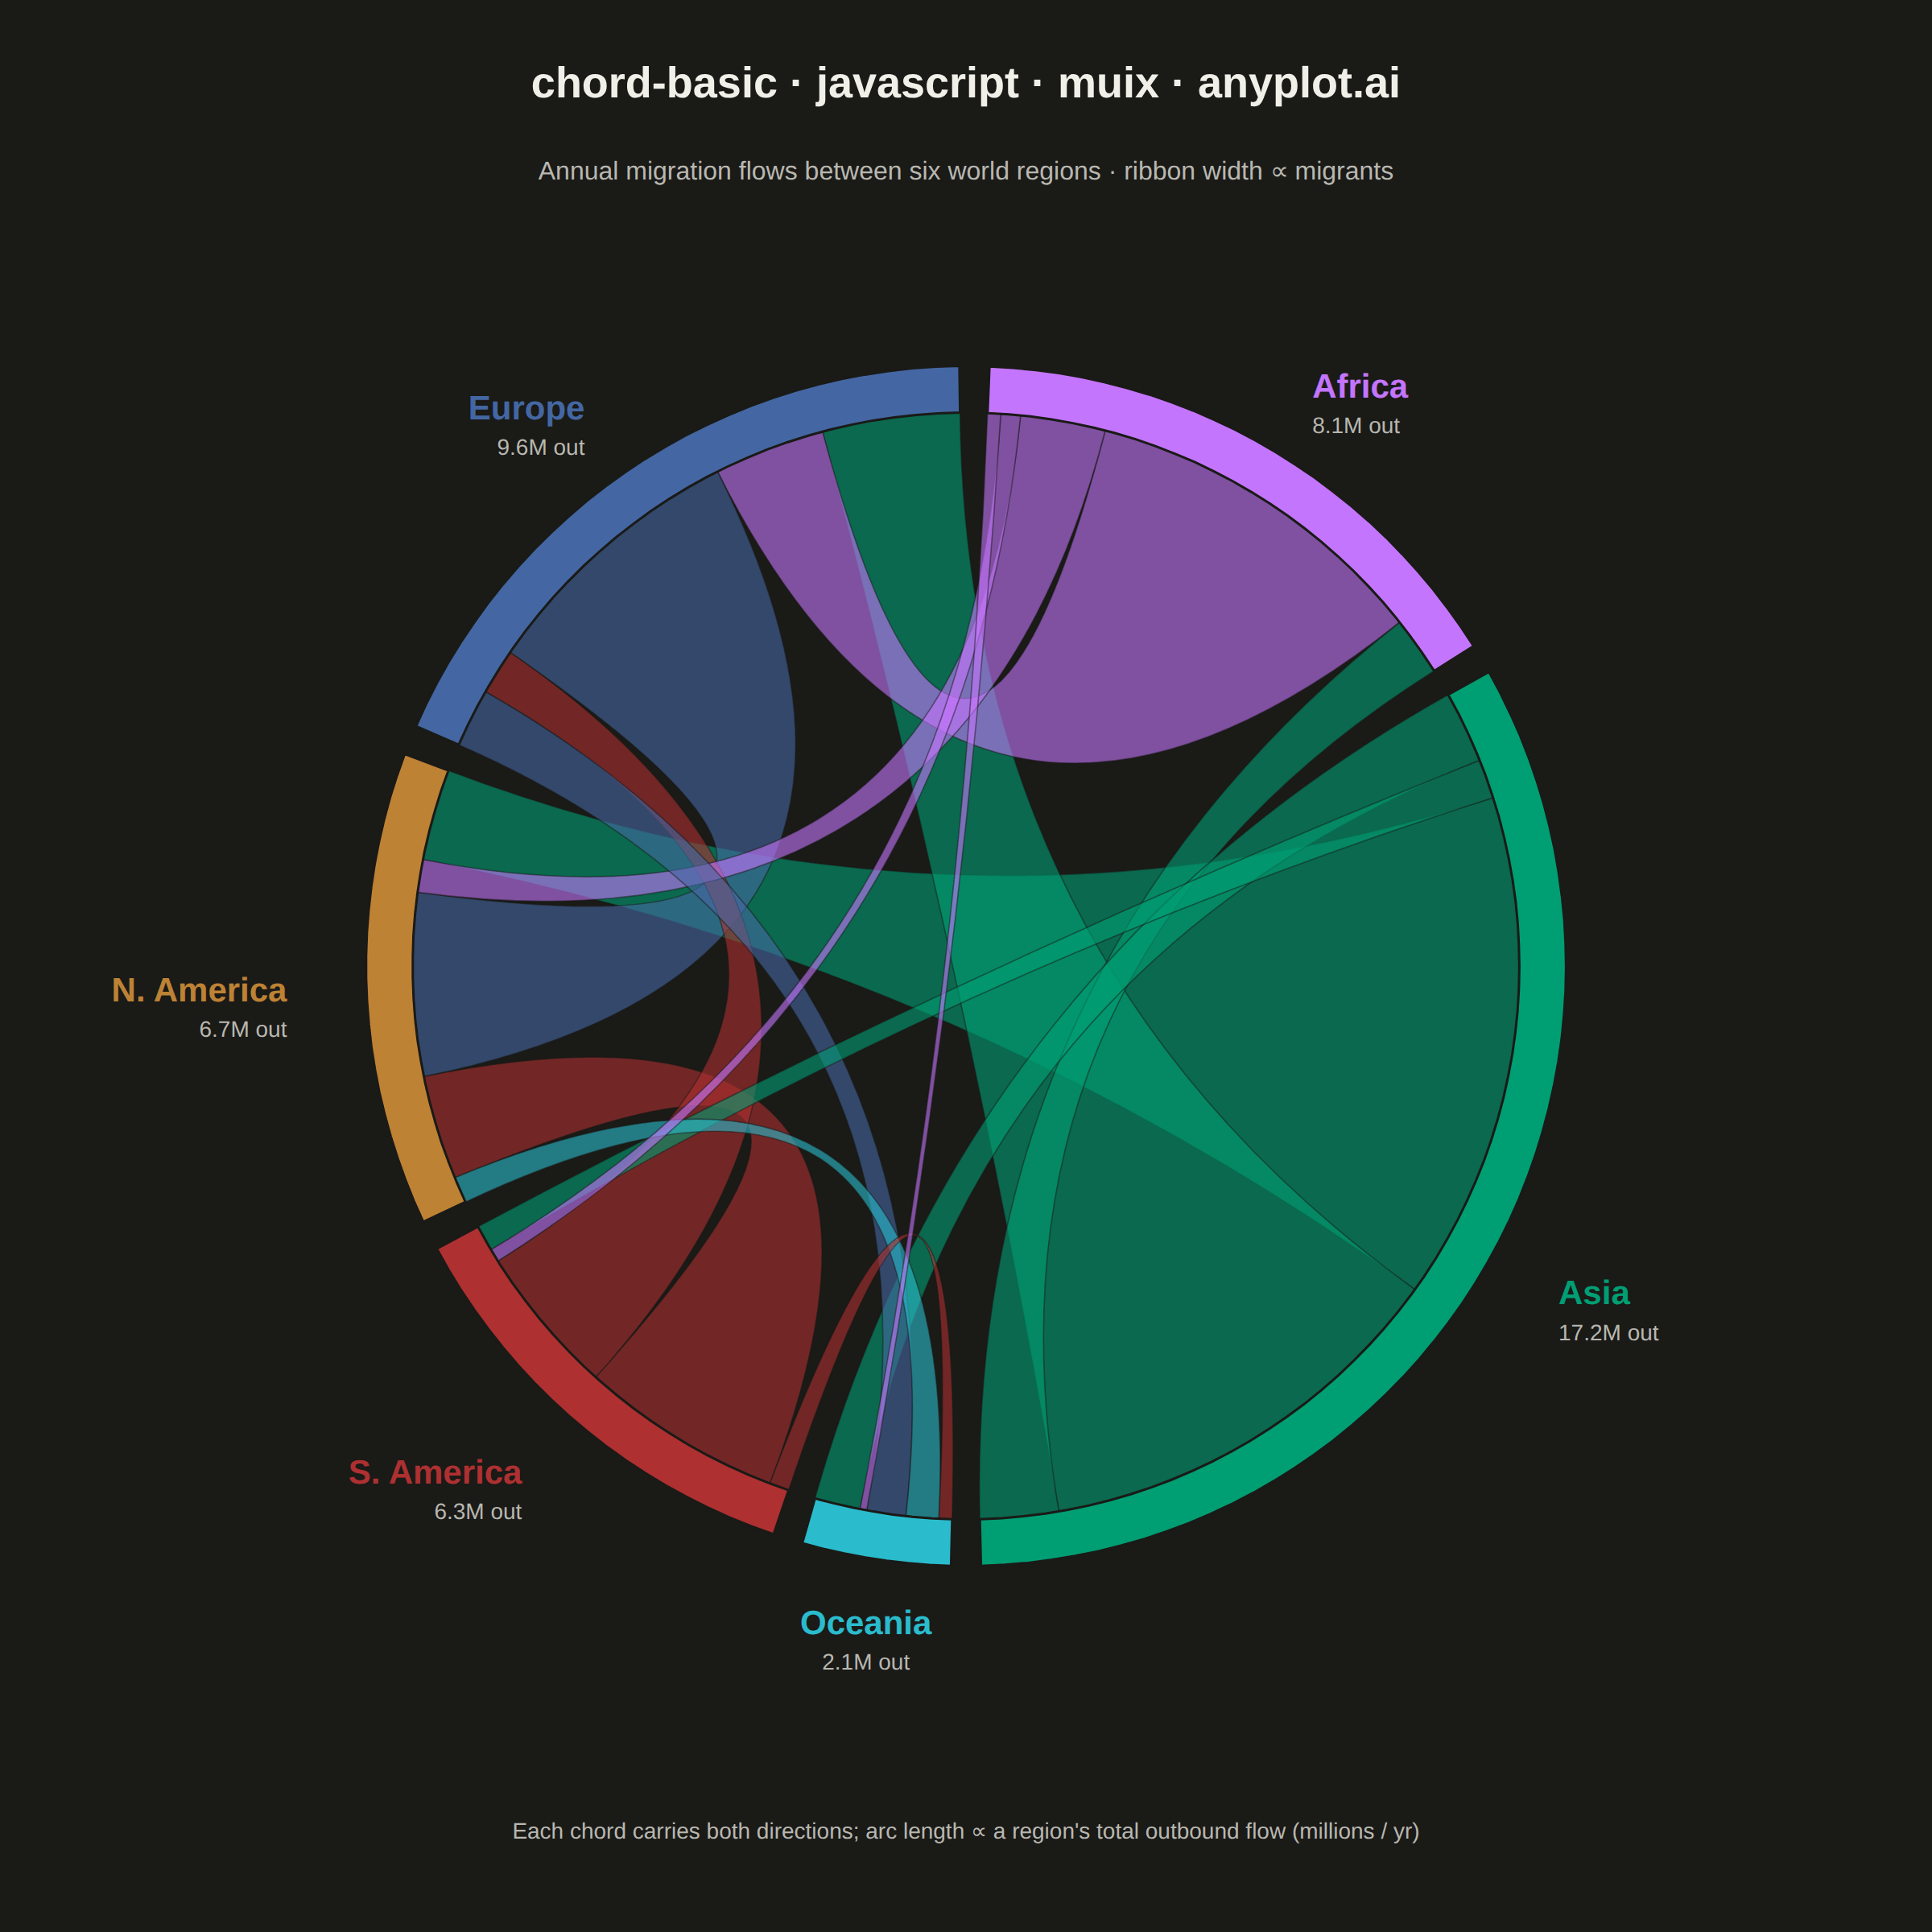
A chord diagram displays relationships or flows between entities arranged around a circle's perimeter. Arcs (chords) connect related entities, with chord width proportional to the flow magnitude. This visualization excels at revealing the overall structure of connections and identifying the strongest relationships within a system.
// anyplot.ai
// chord-basic: Basic Chord Diagram
// Library: muix 7.29.1 | JavaScript 22.22.3
// Quality: 94/100 | Created: 2026-06-17
//# anyplot-orientation: square
// anyplot.ai
// chord-basic: Basic Chord Diagram
// Library: MUI X Charts | React | Node 22
// License: @mui/x-charts — MIT (community). Pro/Premium are out of scope.
// Quality: pending | Created: 2026-06-17
//
// MUI X community has no chord/Sankey primitive, so the diagram is drawn with
// the supported escape hatch: a <ChartContainer> establishes a square linear
// coordinate space, and the chord ring + ribbons are SVG overlays positioned
// through the chart's own useXScale/useYScale hooks. Everything is community
// @mui/x-charts — no Pro, no second charting library.
import { ChartContainer } from "@mui/x-charts/ChartContainer";
import { useXScale, useYScale } from "@mui/x-charts/hooks";

const t = window.ANYPLOT_TOKENS;
const SIZE = window.ANYPLOT_SIZE;
const TITLE = "chord-basic · javascript · muix · anyplot.ai";

const FONT =
  '-apple-system, BlinkMacSystemFont, "Segoe UI", Roboto, Helvetica, Arial, sans-serif';

// Square drawing domain. The chord ring lives inside radius ~1; the band beyond
// it is reserved for region labels, the title, and the footnote.
const R = 1.42;

// --- Data: annual migration flows between six world regions (millions) -------
// Deterministic, in-memory. MATRIX[i][j] = migrants moving FROM region i TO
// region j (diagonal = 0, no internal moves). Both directions are kept, so each
// chord shows two magnitudes — one per ribbon end.
const ENTITIES = [
  { name: "Asia", color: t.palette[0] }, // first categorical series → brand green
  { name: "Africa", color: t.palette[1] },
  { name: "Europe", color: t.palette[2] },
  { name: "N. America", color: t.palette[3] },
  { name: "S. America", color: t.palette[4] },
  { name: "Oceania", color: t.palette[5] },
];

// rows = source, cols = target (Asia, Africa, Europe, N.Am, S.Am, Oceania)
const MATRIX = [
  [0.0, 1.2, 6.5, 7.8, 0.6, 1.1], // Asia →
  [0.9, 0.0, 5.4, 1.3, 0.3, 0.2], // Africa →
  [2.1, 1.7, 0.0, 4.2, 0.7, 0.9], // Europe →
  [1.4, 0.5, 2.8, 0.0, 1.6, 0.4], // N. America →
  [0.4, 0.2, 2.3, 3.1, 0.0, 0.3], // S. America →
  [0.7, 0.1, 0.6, 0.5, 0.2, 0.0], // Oceania →
];

const N = ENTITIES.length;

// --- Chord layout (manual; standard d3-chord arithmetic) ---------------------
// Each region subtends an arc proportional to its total outbound flow. Inside a
// region's arc, sub-segments (one per partner) carry the per-pair magnitude, so
// a ribbon's two ends can differ in width — that is the bidirectional flow.
const groupTotal = MATRIX.map((row) => row.reduce((a, b) => a + b, 0));
const grand = groupTotal.reduce((a, b) => a + b, 0);

const PAD = 0.05; // angular gap between region arcs (radians)
const avail = 2 * Math.PI - PAD * N;

const groups = [];
let cur = -Math.PI / 2 + PAD / 2; // start at top, sweep clockwise
for (let i = 0; i < N; i++) {
  const span = (groupTotal[i] / grand) * avail;
  const gStart = cur;
  const gEnd = cur + span;
  const subs = [];
  let sc = gStart;
  for (let j = 0; j < N; j++) {
    const sspan = groupTotal[i] > 0 ? (MATRIX[i][j] / groupTotal[i]) * span : 0;
    subs.push([sc, sc + sspan]);
    sc += sspan;
  }
  groups.push({ i, gStart, gEnd, mid: (gStart + gEnd) / 2, subs });
  cur = gEnd + PAD;
}

// One ribbon per unordered region pair, connecting subgroup(i,j) ↔ subgroup(j,i).
const ribbons = [];
for (let i = 0; i < N; i++) {
  for (let j = 0; j < i; j++) {
    const a = MATRIX[i][j]; // i → j
    const b = MATRIX[j][i]; // j → i
    if (a + b <= 0) continue;
    const dom = a >= b ? i : j; // colour by the dominant origin region
    ribbons.push({
      i,
      j,
      a,
      b,
      color: ENTITIES[dom].color,
      mag: a + b,
      sI: groups[i].subs[j],
      sJ: groups[j].subs[i],
    });
  }
}
// Draw fat ribbons first so thin ones stay legible on top.
ribbons.sort((x, y) => y.mag - x.mag);

// Ring geometry (data-space radii).
const R_OUT = 0.9; // outer edge of region band
const R_IN = 0.83; // inner edge of region band = ribbon attach radius
const R_RIB = 0.83;
const R_LABEL = 1.0;

// --- Geometry helpers (data coordinates → SVG path via the chart scales) -----
function arcPts(a0, a1, r) {
  const steps = Math.max(2, Math.ceil(Math.abs(a1 - a0) / 0.04));
  const pts = [];
  for (let k = 0; k <= steps; k++) {
    const a = a0 + (a1 - a0) * (k / steps);
    pts.push([r * Math.cos(a), r * Math.sin(a)]);
  }
  return pts;
}

function ribbonPath(xs, ys, sI, sJ, r) {
  const cx = xs(0).toFixed(1);
  const cy = ys(0).toFixed(1);
  const A = arcPts(sI[0], sI[1], r);
  const B = arcPts(sJ[0], sJ[1], r);
  const p = (pt) => `${xs(pt[0]).toFixed(1)} ${ys(pt[1]).toFixed(1)}`;
  let d = `M ${p(A[0])}`;
  for (let k = 1; k < A.length; k++) d += ` L ${p(A[k])}`;
  d += ` Q ${cx} ${cy} ${p(B[0])}`;
  for (let k = 1; k < B.length; k++) d += ` L ${p(B[k])}`;
  d += ` Q ${cx} ${cy} ${p(A[0])} Z`;
  return d;
}

function bandPath(xs, ys, a0, a1, rIn, rOut) {
  const outer = arcPts(a0, a1, rOut);
  const inner = arcPts(a1, a0, rIn);
  const p = (pt) => `${xs(pt[0]).toFixed(1)} ${ys(pt[1]).toFixed(1)}`;
  let d = `M ${p(outer[0])}`;
  for (let k = 1; k < outer.length; k++) d += ` L ${p(outer[k])}`;
  for (let k = 0; k < inner.length; k++) d += ` L ${p(inner[k])}`;
  return d + " Z";
}

const fmt = (v) => `${v.toFixed(1)}M`;

// --- Overlay layers ----------------------------------------------------------
function Ribbons() {
  const xs = useXScale();
  const ys = useYScale();
  return (
    <g>
      {ribbons.map((rb, k) => (
        <path
          key={k}
          d={ribbonPath(xs, ys, rb.sI, rb.sJ, R_RIB)}
          fill={rb.color}
          fillOpacity={0.6}
          stroke={t.pageBg}
          strokeWidth={0.8}
          strokeOpacity={0.5}
        >
          <title>
            {`${ENTITIES[rb.i].name} → ${ENTITIES[rb.j].name}: ${fmt(rb.a)}\n` +
              `${ENTITIES[rb.j].name} → ${ENTITIES[rb.i].name}: ${fmt(rb.b)}`}
          </title>
        </path>
      ))}
    </g>
  );
}

function Ring() {
  const xs = useXScale();
  const ys = useYScale();
  return (
    <g>
      {groups.map((g) => (
        <path
          key={g.i}
          d={bandPath(xs, ys, g.gStart, g.gEnd, R_IN, R_OUT)}
          fill={ENTITIES[g.i].color}
          stroke={t.pageBg}
          strokeWidth={1.5}
        >
          <title>{`${ENTITIES[g.i].name} · total outbound ${fmt(groupTotal[g.i])}`}</title>
        </path>
      ))}
    </g>
  );
}

function Labels() {
  const xs = useXScale();
  const ys = useYScale();
  return (
    <g fontFamily={FONT}>
      {groups.map((g) => {
        const mid = g.mid;
        const c = Math.cos(mid);
        const lx = R_LABEL * c;
        const ly = R_LABEL * Math.sin(mid);
        const anchor = c > 0.33 ? "start" : c < -0.33 ? "end" : "middle";
        const dx = c > 0.33 ? 8 : c < -0.33 ? -8 : 0;
        return (
          <g key={g.i}>
            <text
              x={xs(lx) + dx}
              y={ys(ly)}
              textAnchor={anchor}
              dominantBaseline="middle"
              fontSize={21}
              fontWeight={700}
              fill={ENTITIES[g.i].color}
            >
              {ENTITIES[g.i].name}
            </text>
            <text
              x={xs(lx) + dx}
              y={ys(ly) + 24}
              textAnchor={anchor}
              dominantBaseline="middle"
              fontSize={14}
              fill={t.inkSoft}
            >
              {fmt(groupTotal[g.i])} out
            </text>
          </g>
        );
      })}
    </g>
  );
}

function Frame() {
  const xs = useXScale();
  const ys = useYScale();
  return (
    <g fontFamily={FONT}>
      <text
        x={xs(0)}
        y={ys(1.32)}
        textAnchor="middle"
        dominantBaseline="middle"
        fontSize={27}
        fontWeight={600}
        fill={t.ink}
      >
        {TITLE}
      </text>
      <text
        x={xs(0)}
        y={ys(1.19)}
        textAnchor="middle"
        dominantBaseline="middle"
        fontSize={16}
        fill={t.inkSoft}
      >
        Annual migration flows between six world regions · ribbon width ∝ migrants
      </text>
      <text
        x={xs(0)}
        y={ys(-1.3)}
        textAnchor="middle"
        dominantBaseline="middle"
        fontSize={14}
        fill={t.inkSoft}
      >
        Each chord carries both directions; arc length ∝ a region's total outbound flow (millions / yr)
      </text>
    </g>
  );
}

// --- Chart (default-exported component — the harness mounts it) --------------
export default function Chart() {
  return (
    <ChartContainer
      width={SIZE.width}
      height={SIZE.height}
      margin={{ top: 12, right: 12, bottom: 12, left: 12 }}
      series={[]}
      xAxis={[{ id: "x", scaleType: "linear", min: -R, max: R }]}
      yAxis={[{ id: "y", scaleType: "linear", min: -R, max: R }]}
      skipAnimation
    >
      <Ribbons />
      <Ring />
      <Labels />
      <Frame />
    </ChartContainer>
  );
}
Runnable source as JSON, for any HTTP client: https://api.anyplot.ai/specs/chord-basic/muix/code. Any spec id and library id listed in llms-full.txt fit the same URL shape; every URL below is complete and callable.
{
  "spec_id": "chord-basic",
  "language": "javascript",
  "library": "muix",
  "page": "https://anyplot.ai/chord-basic/javascript/muix",
  "hub": "https://anyplot.ai/chord-basic",
  "code_json": "https://api.anyplot.ai/specs/chord-basic/muix/code",
  "spec_json": "https://api.anyplot.ai/specs/chord-basic",
  "render_light_png": "https://storage.googleapis.com/anyplot-images/plots/chord-basic/javascript/muix/plot-light.png",
  "render_dark_png": "https://storage.googleapis.com/anyplot-images/plots/chord-basic/javascript/muix/plot-dark.png",
  "interactive_light_html": "https://storage.googleapis.com/anyplot-images/plots/chord-basic/javascript/muix/plot-light.html",
  "interactive_dark_html": "https://storage.googleapis.com/anyplot-images/plots/chord-basic/javascript/muix/plot-dark.html",
  "quality_score": 94.0,
  "license": "MIT",
  "guide": "https://anyplot.ai/llms.txt"
}
Part of Basic Chord Diagram on anyplot.ai.