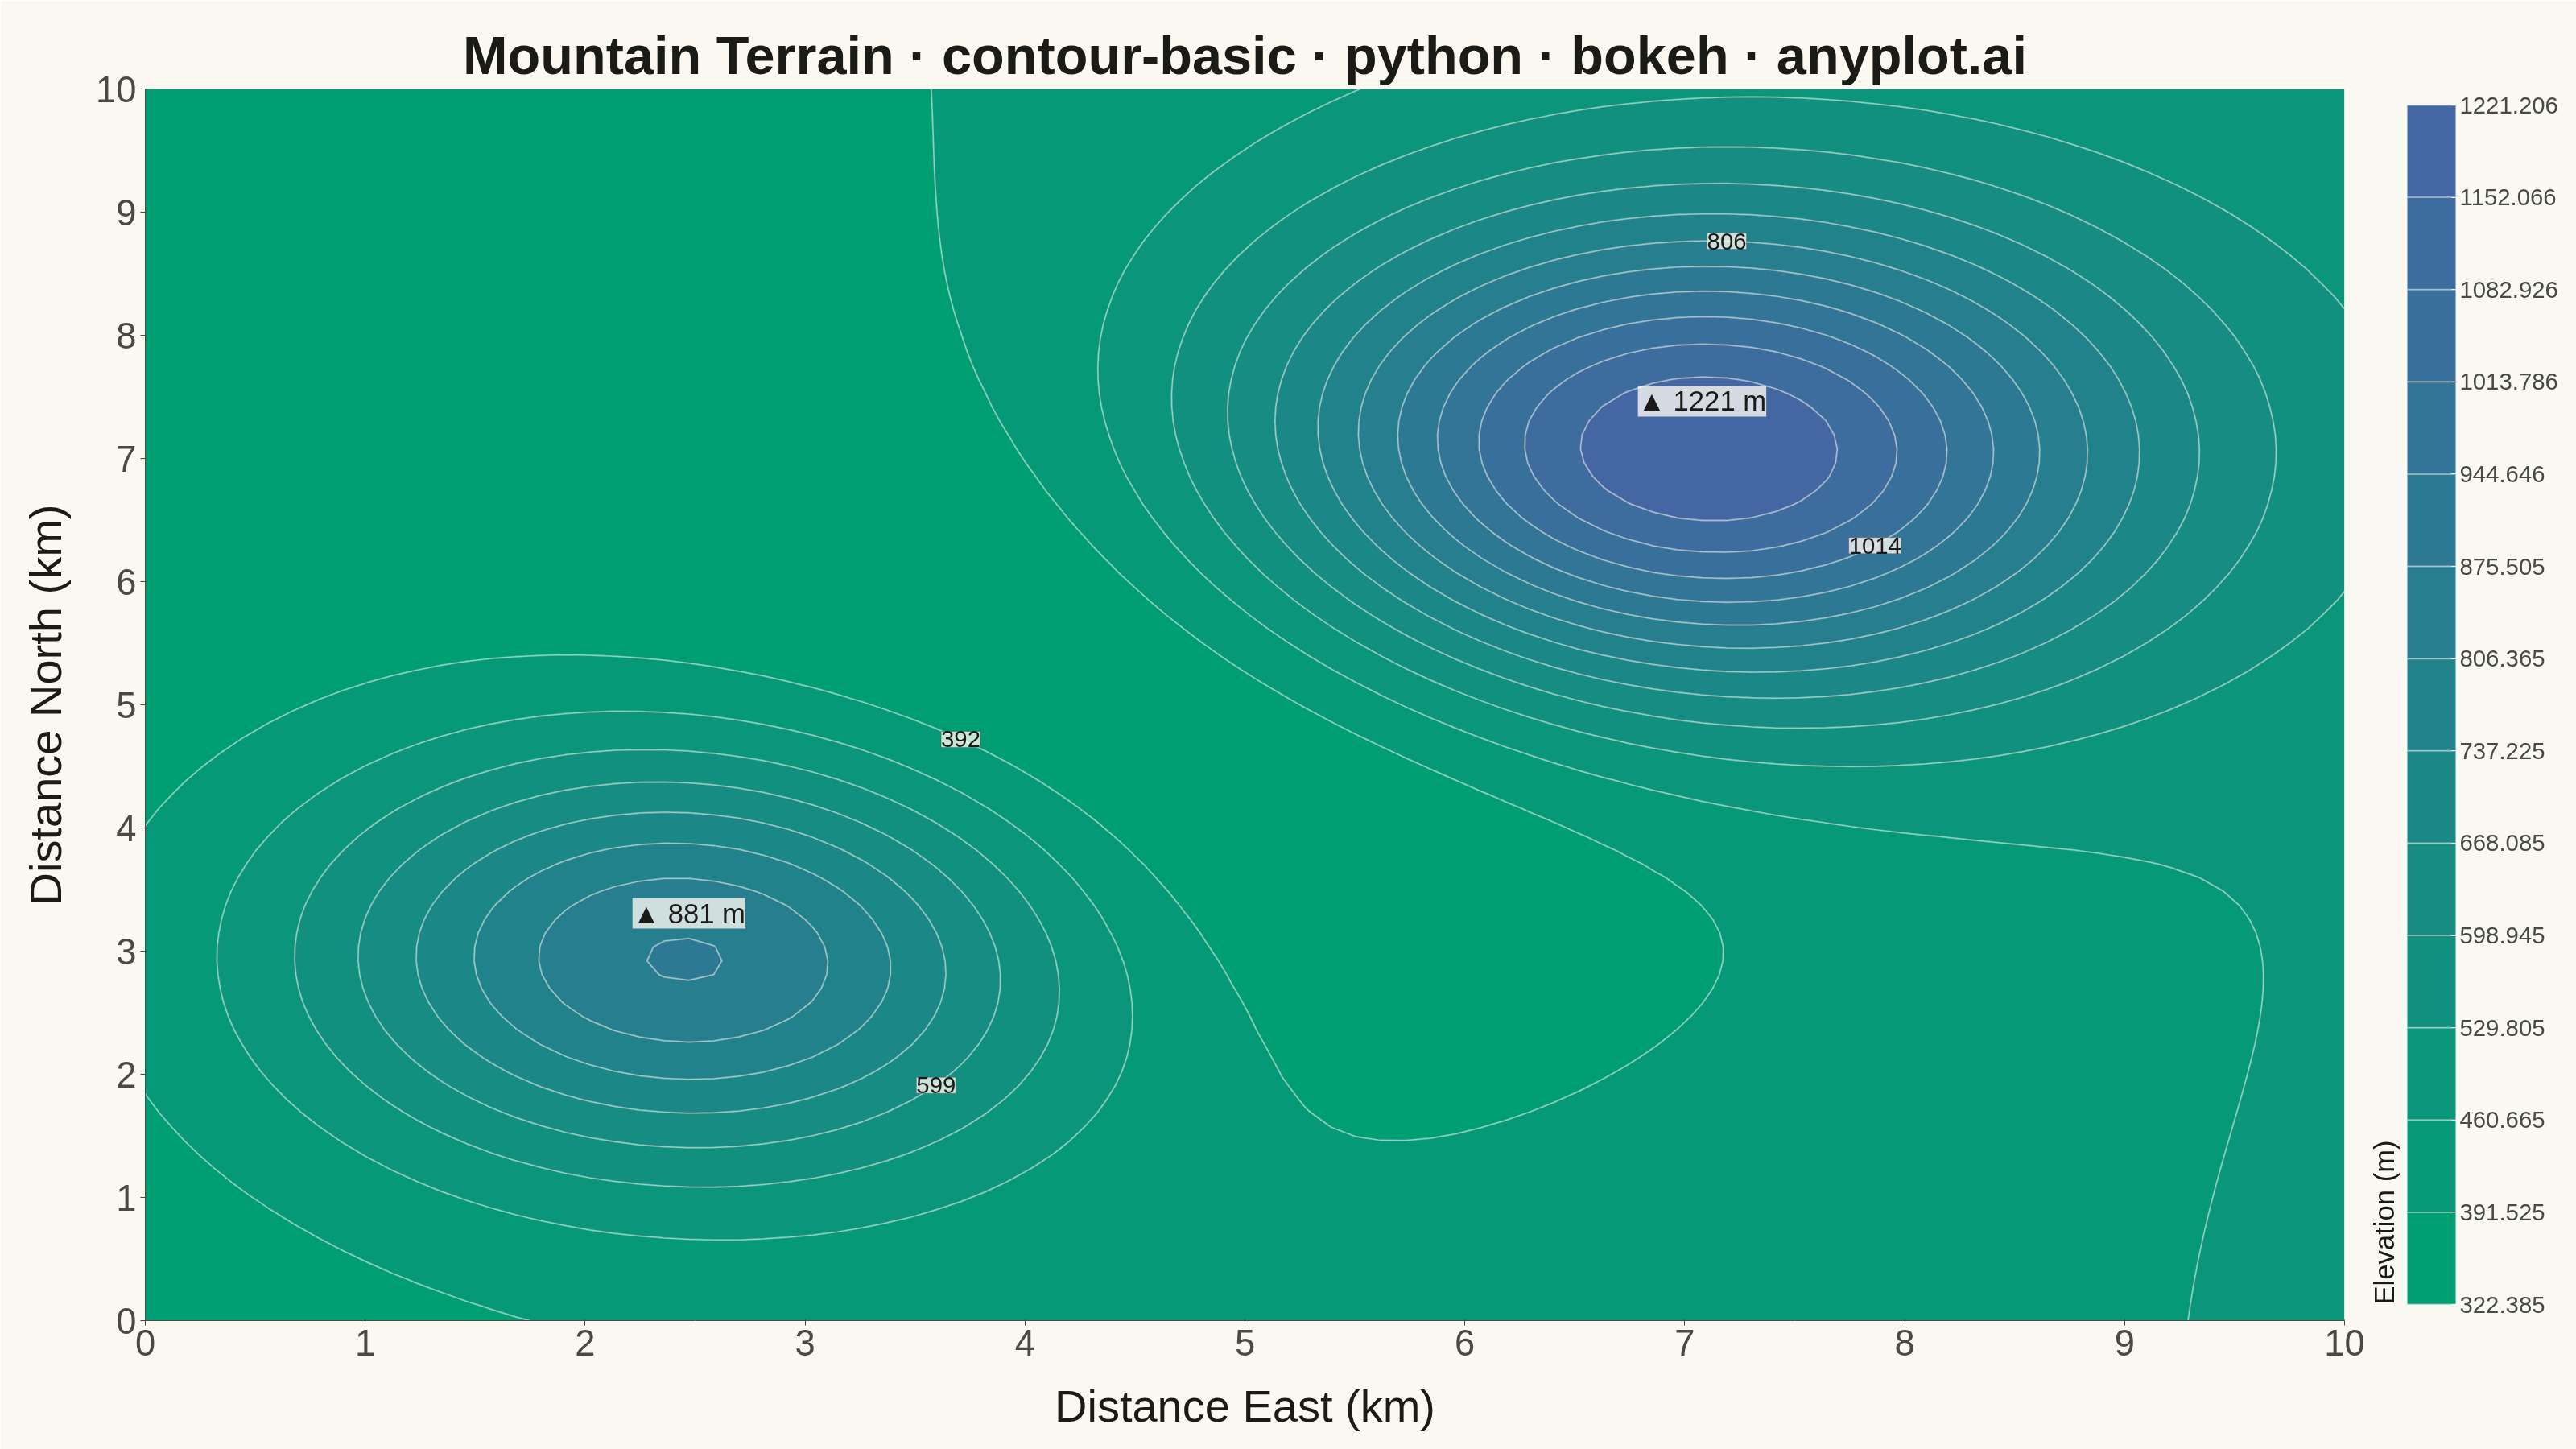
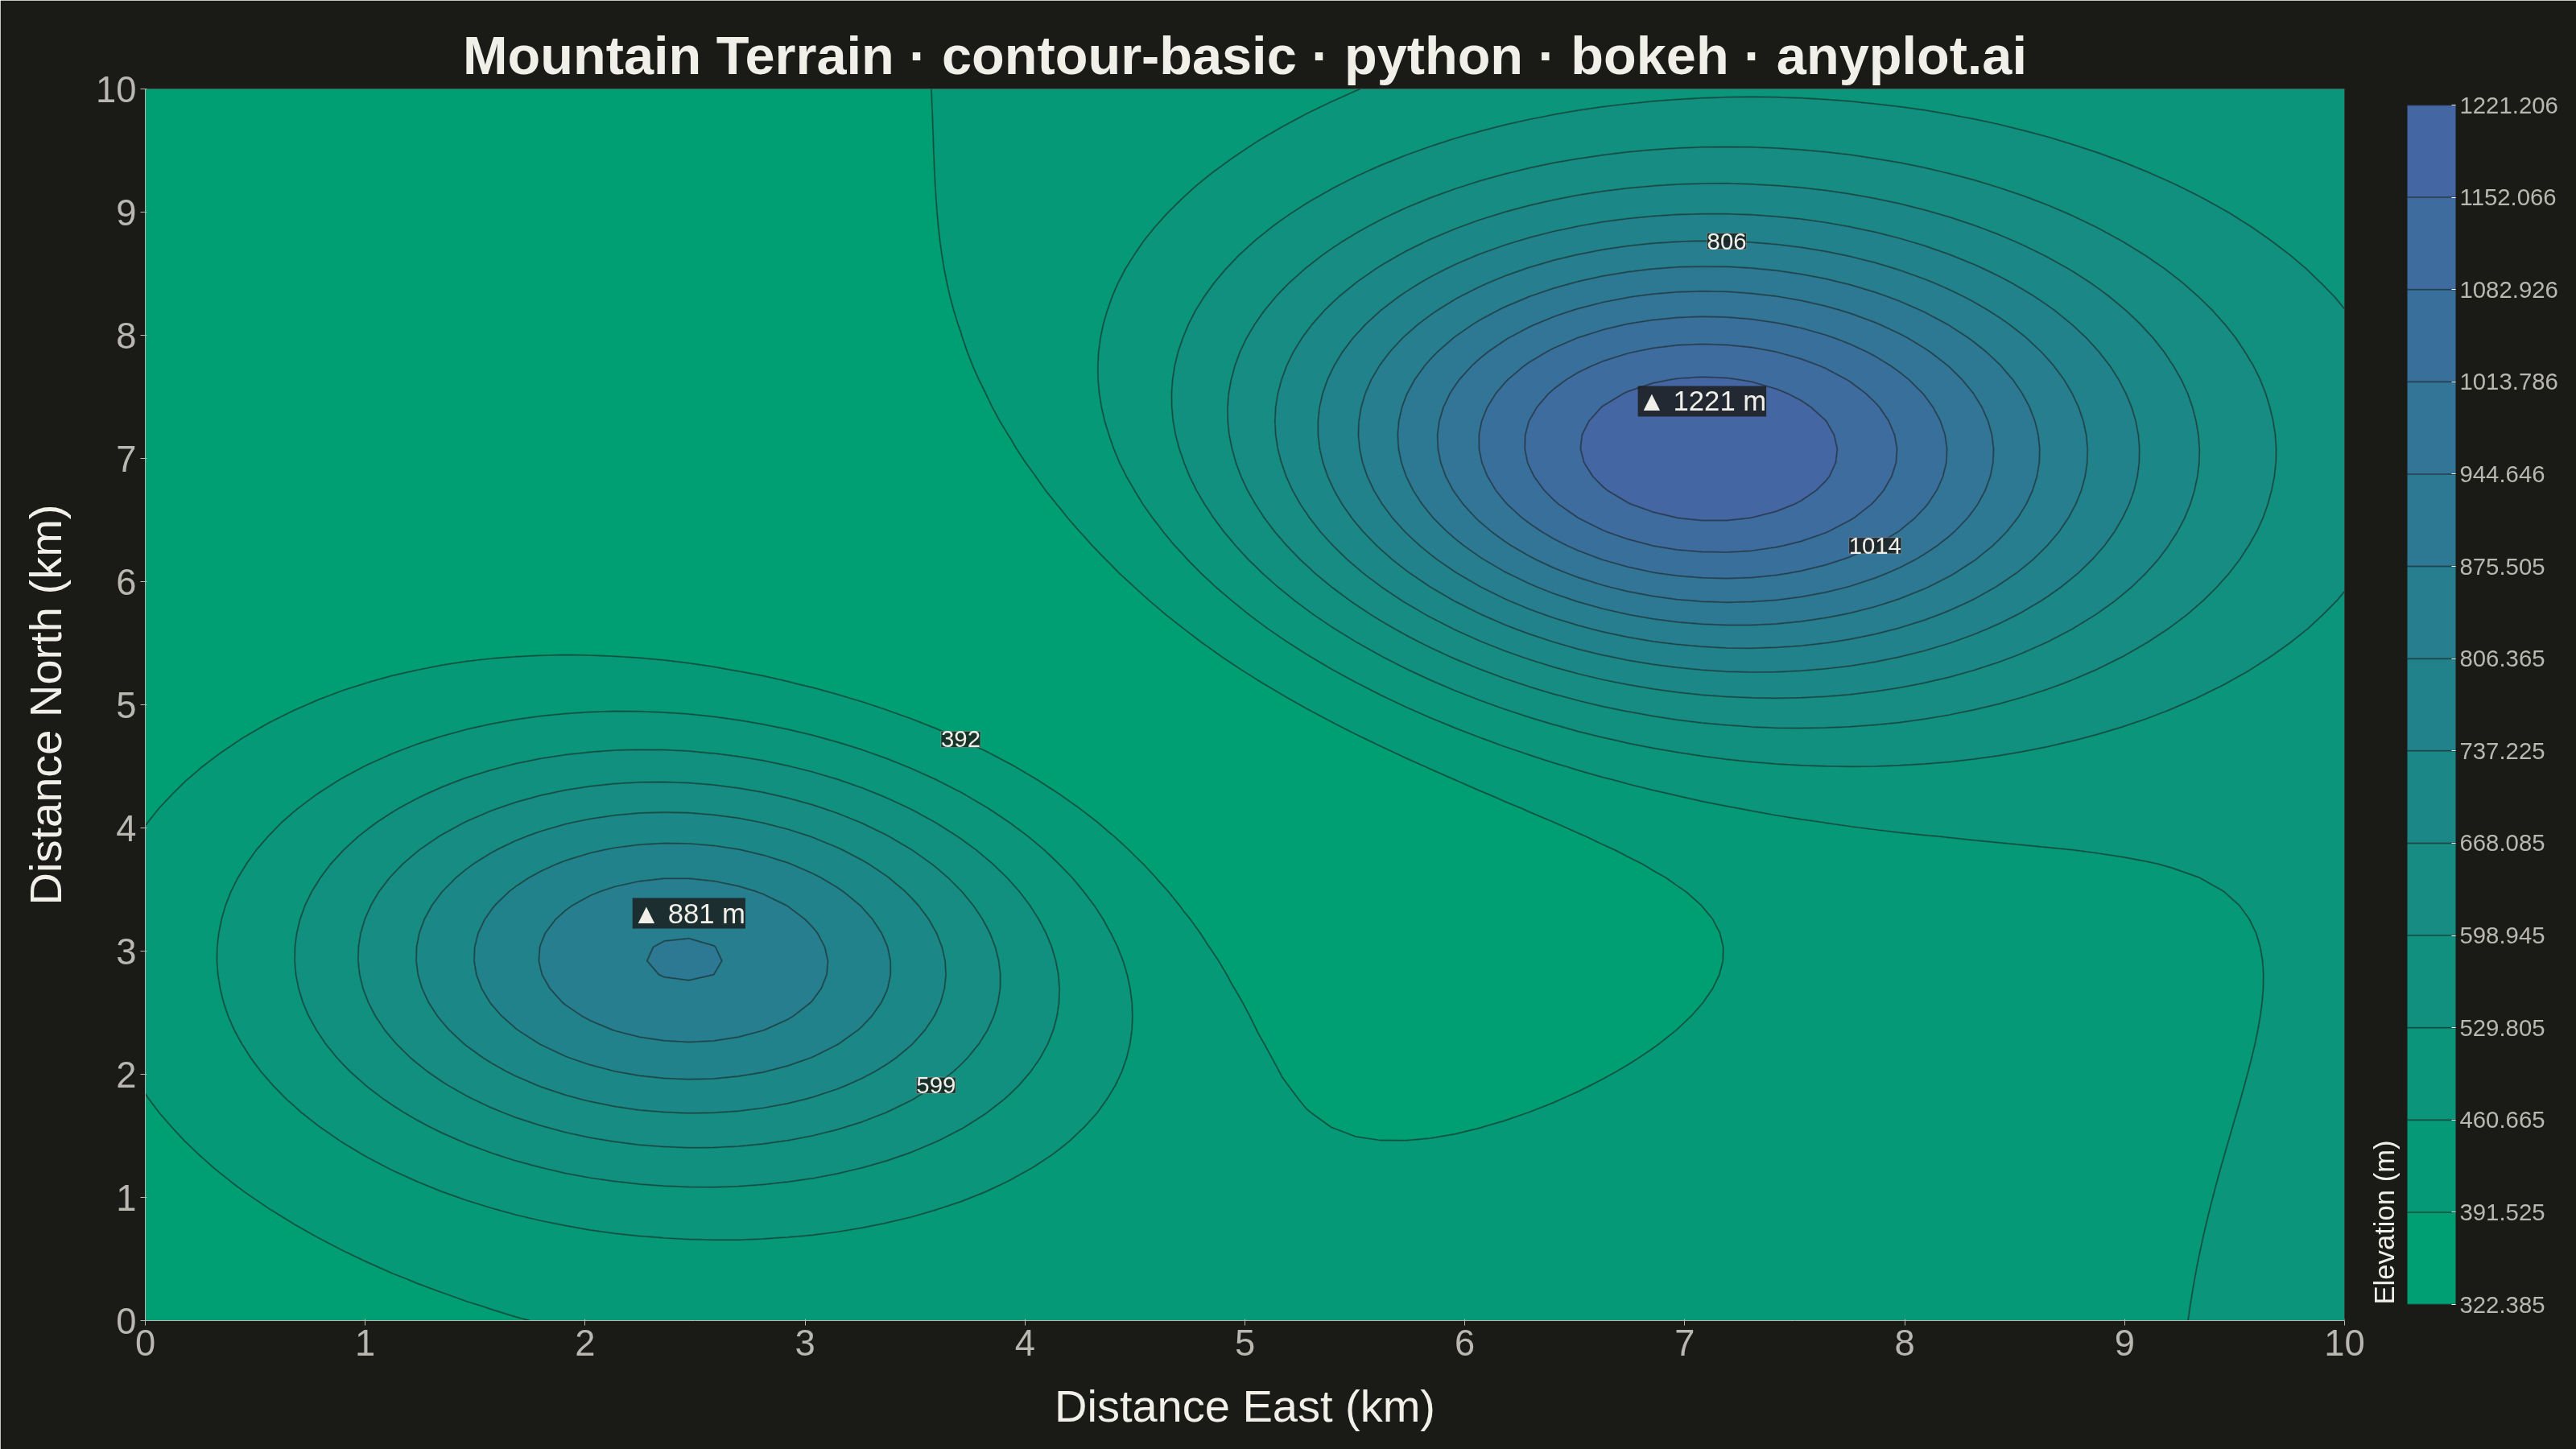
A contour plot displays isolines (level curves) of a 2D scalar field, connecting points of equal value across a surface. It transforms 3D data into an intuitive 2D representation, making it easy to identify regions of high and low values, gradients, and patterns. Contour plots are essential for visualizing continuous surfaces where the relationship between X, Y coordinates and a Z value needs to be understood.
Preview render from the Bokeh implementation.