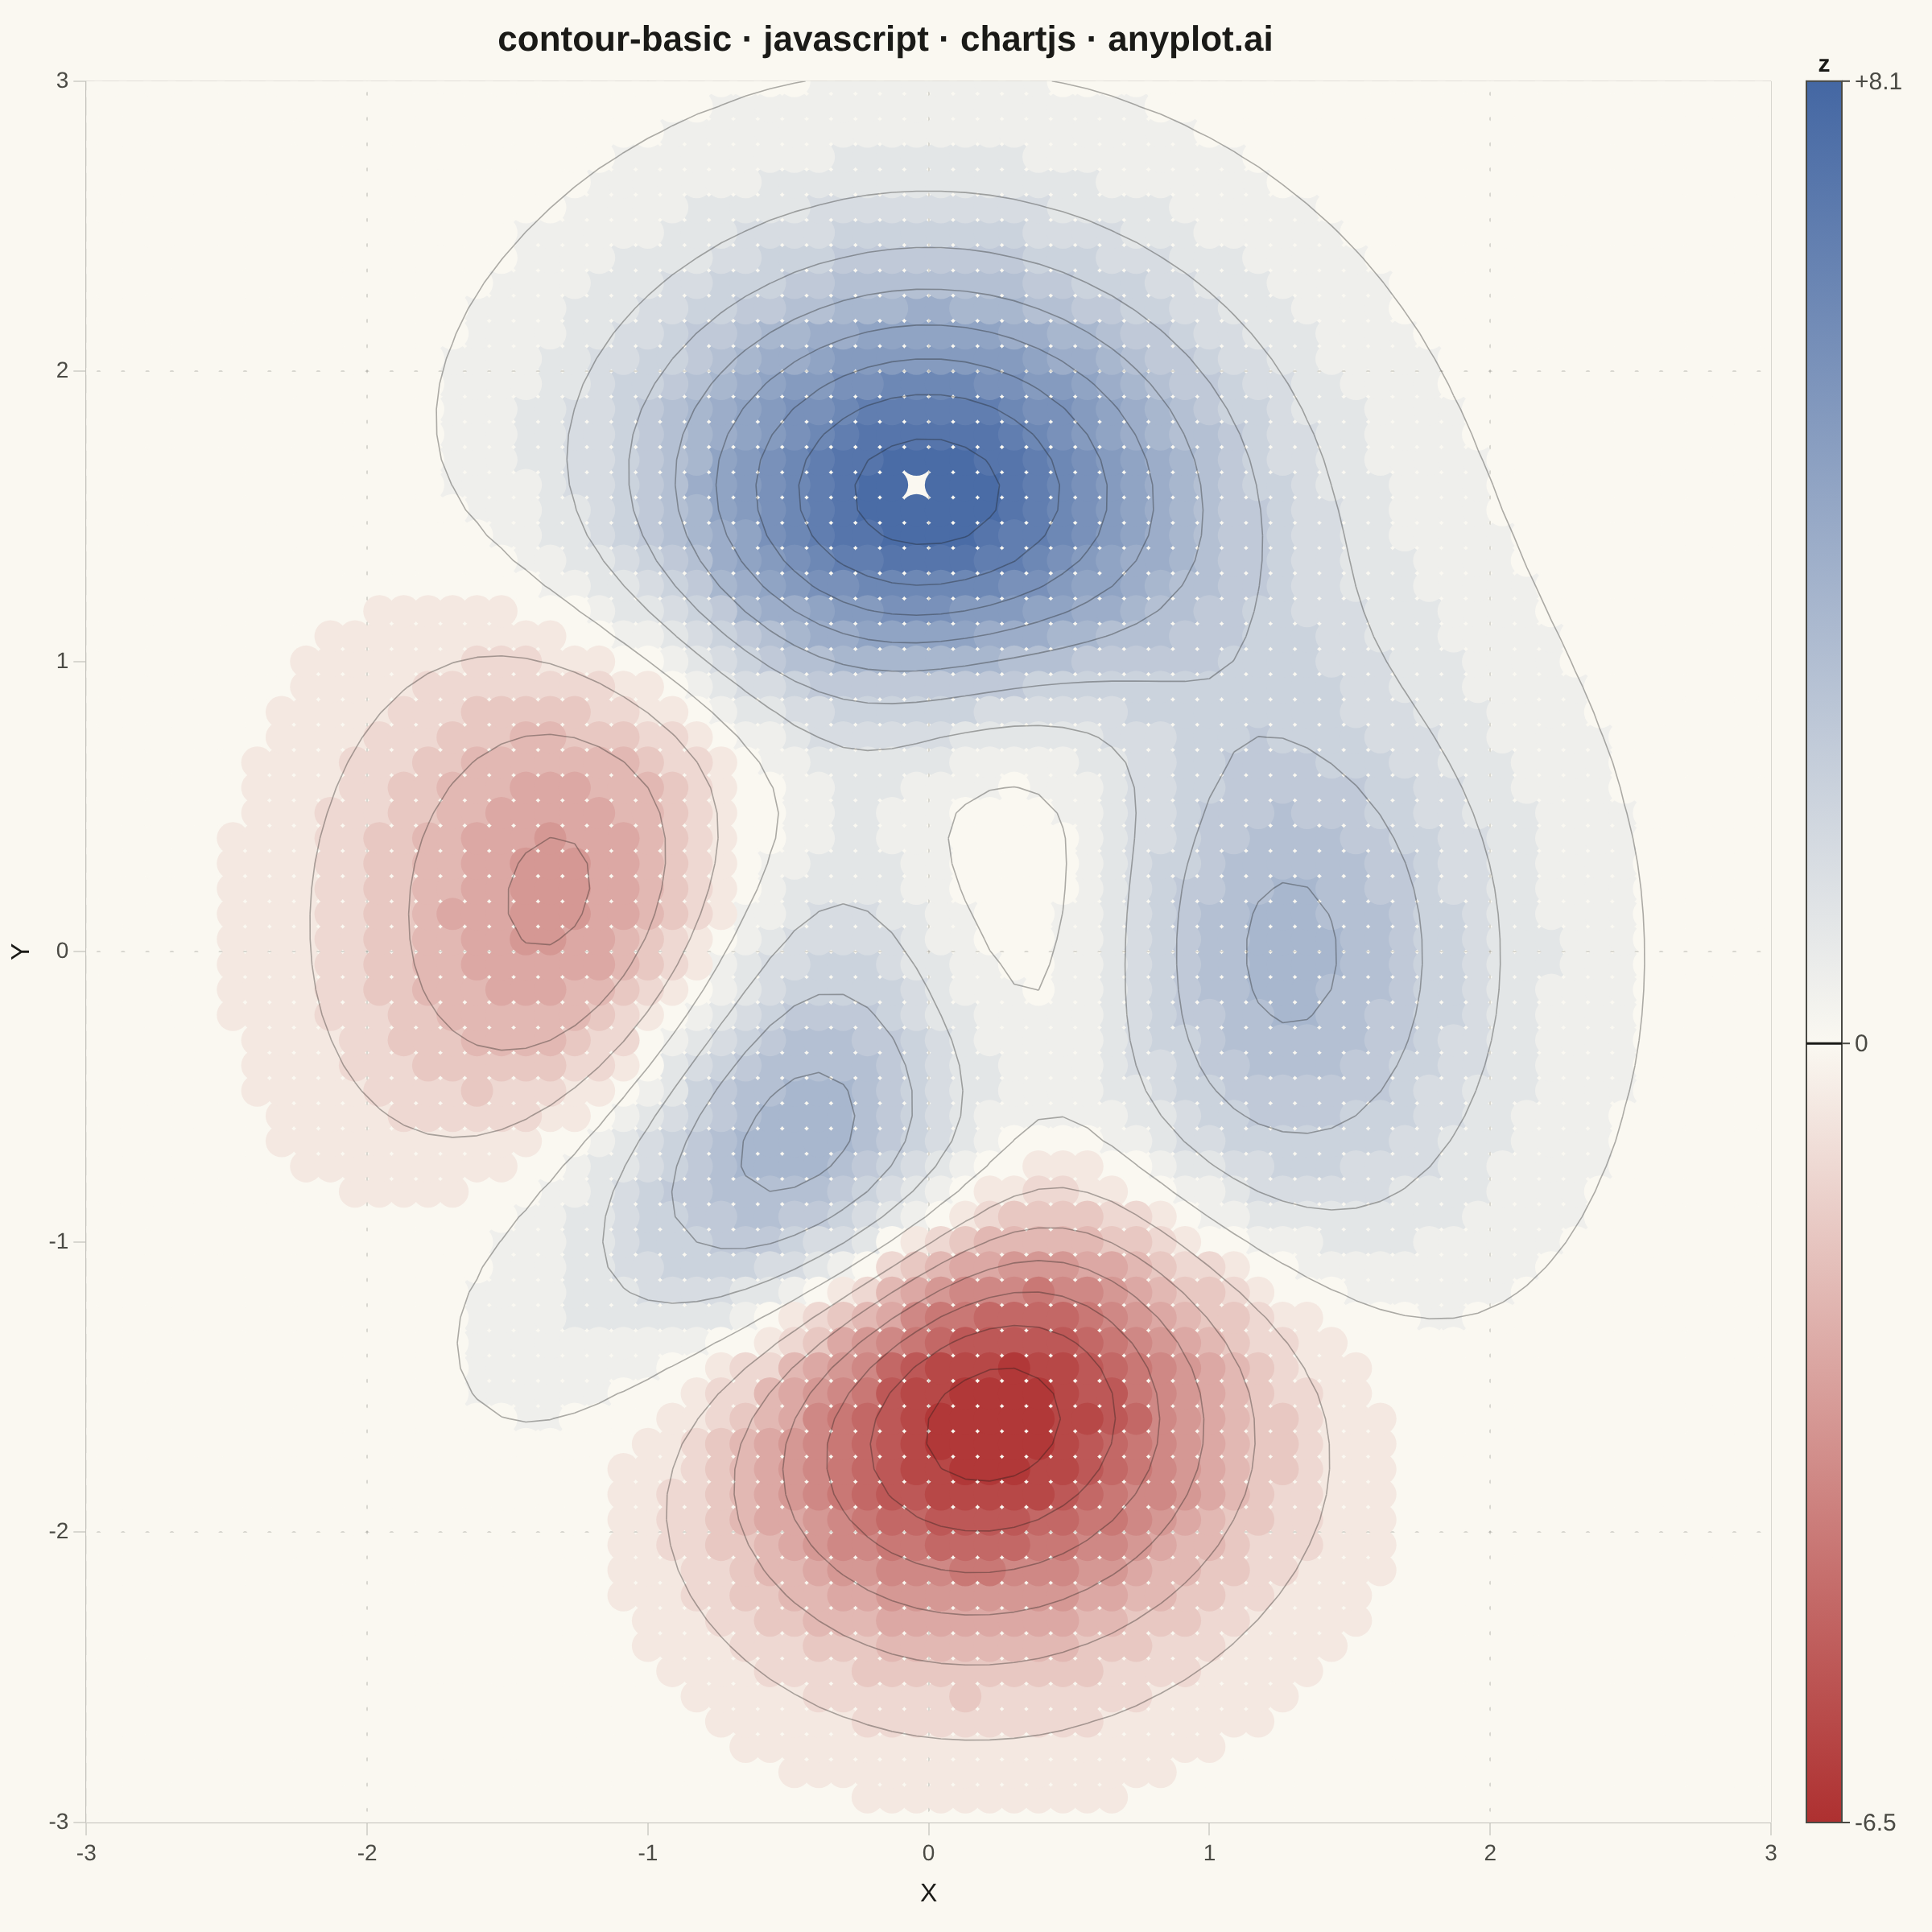
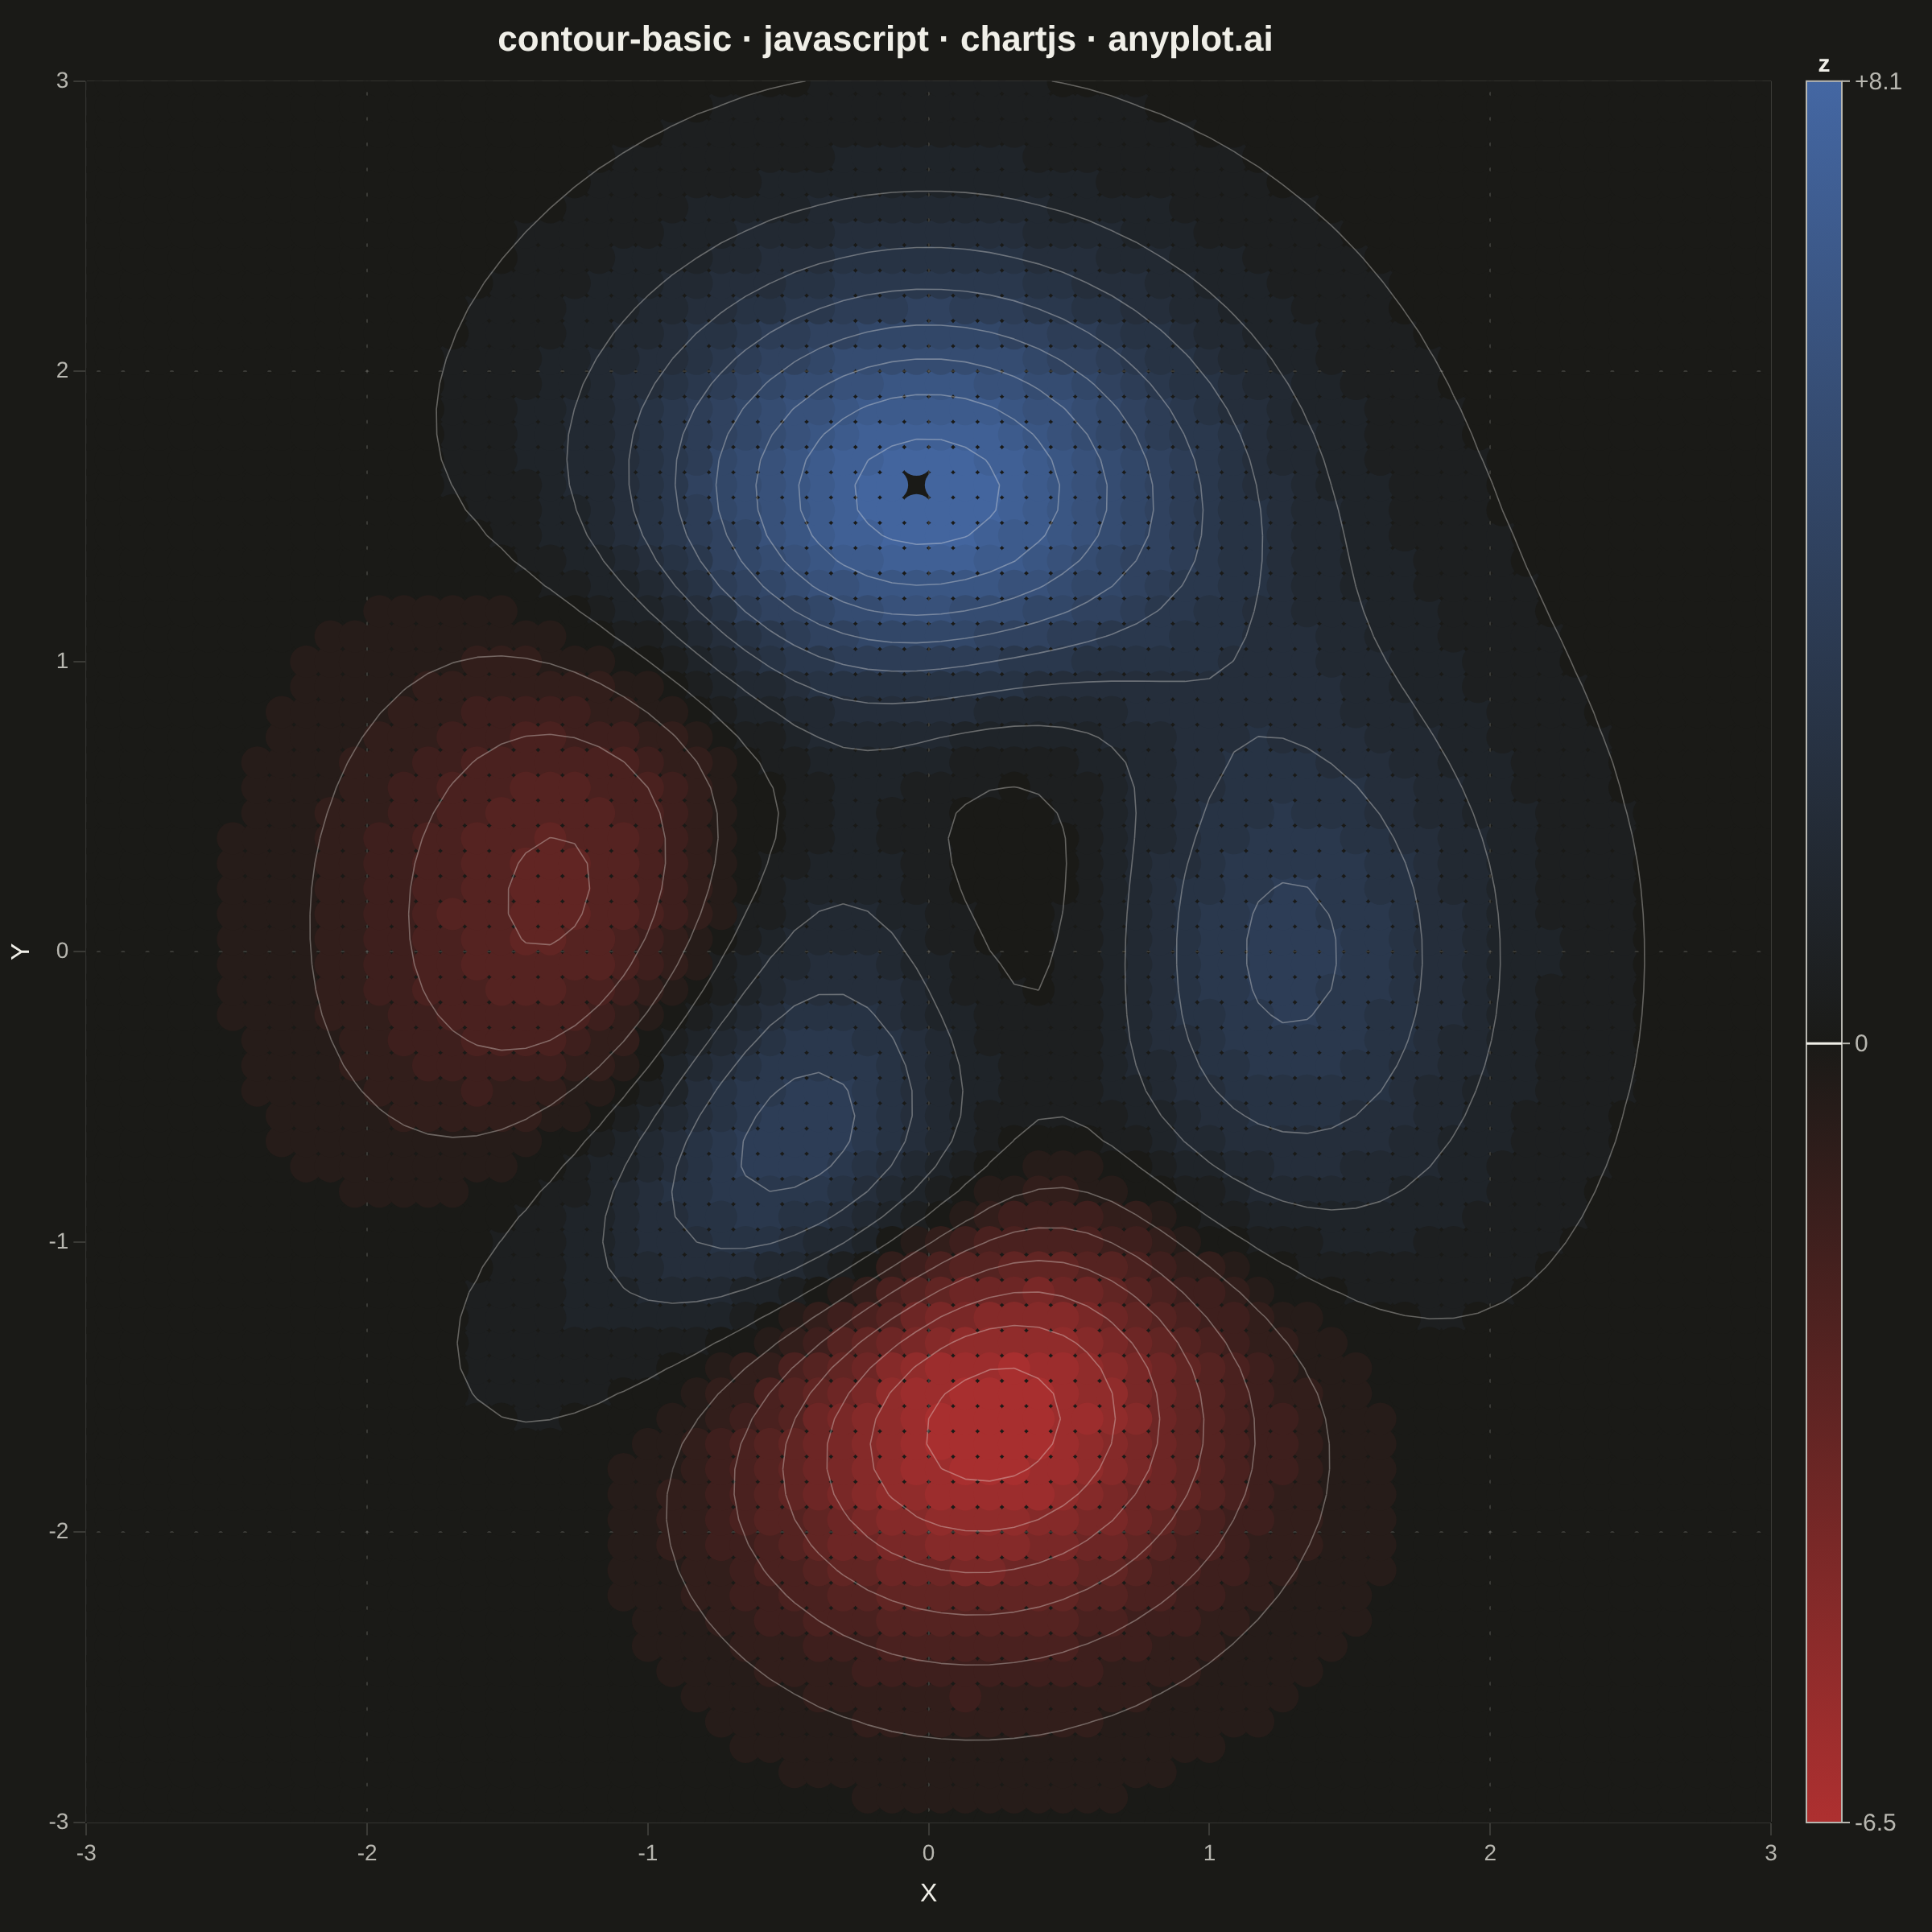
The same plot in 14 other libraries — JavaScript: D3.js, Apache ECharts, Highcharts, MUI X Charts; Python: Altair, Bokeh, lets-plot, Matplotlib, Plotly, plotnine, Pygal, Seaborn; R: ggplot2; Julia: Makie.jl. Compare all 15 side by side: Basic Contour Plot in Python, R, Julia and JavaScript.
A contour plot displays isolines (level curves) of a 2D scalar field, connecting points of equal value across a surface. It transforms 3D data into an intuitive 2D representation, making it easy to identify regions of high and low values, gradients, and patterns. Contour plots are essential for visualizing continuous surfaces where the relationship between X, Y coordinates and a Z value needs to be understood.
// anyplot.ai
// contour-basic: Basic Contour Plot
// Library: chartjs 4.4.7 | JavaScript 22.23.0
// Quality: 82/100 | Created: 2026-06-25

//# anyplot-orientation: square

const t = window.ANYPLOT_TOKENS;

// --- Data ---
const N = 70;
const RANGE = 3;
const NUM_LEVELS = 28;

// Grid coordinates (symmetric grid — xArr === yArr but kept separate for clarity)
const xArr = [], yArr = [];
for (let k = 0; k < N; k++) {
  xArr.push(-RANGE + (2 * RANGE * k) / (N - 1));
  yArr.push(-RANGE + (2 * RANGE * k) / (N - 1));
}

// Peaks function on grid — builds zGrid and tracks Z_MIN/Z_MAX in one pass
let Z_MIN = Infinity, Z_MAX = -Infinity;
const zGrid = [];
for (let i = 0; i < N; i++) {
  zGrid.push([]);
  for (let j = 0; j < N; j++) {
    const x = xArr[i], y = yArr[j];
    const z =
      3 * (1 - x) ** 2 * Math.exp(-(x ** 2) - (y + 1) ** 2) -
      10 * (x / 5 - x ** 3 - y ** 5) * Math.exp(-(x ** 2) - y ** 2) -
      (1 / 3) * Math.exp(-((x + 1) ** 2) - y ** 2);
    zGrid[i].push(z);
    if (z < Z_MIN) Z_MIN = z;
    if (z > Z_MAX) Z_MAX = z;
  }
}

const Z_ZERO_FRAC = (0 - Z_MIN) / (Z_MAX - Z_MIN);
const step = (Z_MAX - Z_MIN) / NUM_LEVELS;

// --- Imprint diverging colormap (t.div tokens) ---
function hexToRgb(hex) {
  return [parseInt(hex.slice(1, 3), 16), parseInt(hex.slice(3, 5), 16), parseInt(hex.slice(5, 7), 16)];
}
function lerpColor(h1, h2, frac) {
  const [r1, g1, b1] = hexToRgb(h1);
  const [r2, g2, b2] = hexToRgb(h2);
  return `rgb(${Math.round(r1 + (r2 - r1) * frac)},${Math.round(g1 + (g2 - g1) * frac)},${Math.round(b1 + (b2 - b1) * frac)})`;
}
function divColor(z) {
  const frac = Math.max(0, Math.min(1, (z - Z_MIN) / (Z_MAX - Z_MIN)));
  if (frac <= Z_ZERO_FRAC) return lerpColor(t.div[0], t.div[1], frac / Z_ZERO_FRAC);
  return lerpColor(t.div[1], t.div[2], (frac - Z_ZERO_FRAC) / (1 - Z_ZERO_FRAC));
}

// --- Contour band datasets (filled regions) ---
const datasets = [];
for (let lvl = 0; lvl < NUM_LEVELS; lvl++) {
  const zLow = Z_MIN + lvl * step;
  const zHigh = zLow + step;
  const color = divColor((zLow + zHigh) / 2);
  const isLast = lvl === NUM_LEVELS - 1;
  const points = [];
  for (let i = 0; i < N; i++) {
    for (let j = 0; j < N; j++) {
      const z = zGrid[i][j];
      if (z >= zLow && (isLast ? z <= zHigh : z < zHigh)) {
        points.push({ x: xArr[i], y: yArr[j] });
      }
    }
  }
  if (points.length > 0) {
    datasets.push({
      data: points,
      backgroundColor: color,
      borderColor: color,
      borderWidth: 0,
      pointRadius: 10,
      pointHoverRadius: 10,
      showLine: false,
    });
  }
}

// --- Marching squares for contour isolines ---
// For each 4-bit corner code (BL=bit0, BR=bit1, TR=bit2, TL=bit3, 1=above threshold),
// which pairs of edge indices to connect as a line segment.
// Edges: 0=bottom (BL→BR), 1=right (BR→TR), 2=top (TL→TR), 3=left (BL→TL)
const SEG = [
  [],               // 0: all below
  [[0, 3]],         // 1: BL
  [[0, 1]],         // 2: BR
  [[3, 1]],         // 3: BL,BR
  [[1, 2]],         // 4: TR
  [[0, 3], [1, 2]], // 5: BL,TR (saddle)
  [[0, 2]],         // 6: BR,TR
  [[3, 2]],         // 7: BL,BR,TR
  [[3, 2]],         // 8: TL
  [[0, 2]],         // 9: BL,TL
  [[0, 1], [2, 3]], // 10: BR,TL (saddle)
  [[1, 2]],         // 11: BL,BR,TL
  [[3, 1]],         // 12: TR,TL
  [[0, 1]],         // 13: BL,TR,TL
  [[0, 3]],         // 14: BR,TR,TL
  [],               // 15: all above
];

// Isoline thresholds — every other band boundary (14 lines) for clarity
const isoThresholds = [];
for (let lvl = 1; lvl < NUM_LEVELS; lvl += 2) {
  isoThresholds.push(Z_MIN + lvl * step);
}

// --- Colorbar + isoline plugin ---
const colorbarPlugin = {
  id: 'colorbar',
  afterDraw(chart) {
    const ctx = chart.ctx;
    const ca = chart.chartArea;
    if (!ca) return;

    const xs = chart.scales.x;
    const ys = chart.scales.y;

    // Precompute pixel positions for all grid nodes (avoids repeated getPixelForValue calls)
    const xPx = xArr.map((v) => xs.getPixelForValue(v));
    const yPx = yArr.map((v) => ys.getPixelForValue(v));

    // Returns the pixel [px, py] where the isoline crosses a given edge of cell (i,j)
    function edgePx(e, i, j, z00, z10, z11, z01, thresh) {
      const f = (a, b, za, zb) => a + ((thresh - za) / (zb - za)) * (b - a);
      switch (e) {
        case 0: return [f(xPx[i], xPx[i + 1], z00, z10), yPx[j]];
        case 1: return [xPx[i + 1], f(yPx[j], yPx[j + 1], z10, z11)];
        case 2: return [f(xPx[i], xPx[i + 1], z01, z11), yPx[j + 1]];
        case 3: return [xPx[i], f(yPx[j], yPx[j + 1], z00, z01)];
      }
    }

    // Draw isolines clipped to chart area
    ctx.save();
    ctx.beginPath();
    ctx.rect(ca.left, ca.top, ca.right - ca.left, ca.bottom - ca.top);
    ctx.clip();

    ctx.beginPath();
    ctx.strokeStyle = t.ink;
    ctx.lineWidth = 0.8;
    ctx.globalAlpha = 0.35;

    for (const thresh of isoThresholds) {
      for (let i = 0; i < N - 1; i++) {
        for (let j = 0; j < N - 1; j++) {
          const z00 = zGrid[i][j], z10 = zGrid[i + 1][j];
          const z11 = zGrid[i + 1][j + 1], z01 = zGrid[i][j + 1];
          const code =
            (z00 >= thresh ? 1 : 0) |
            (z10 >= thresh ? 2 : 0) |
            (z11 >= thresh ? 4 : 0) |
            (z01 >= thresh ? 8 : 0);
          for (const [e0, e1] of SEG[code]) {
            const [ax, ay] = edgePx(e0, i, j, z00, z10, z11, z01, thresh);
            const [bx, by] = edgePx(e1, i, j, z00, z10, z11, z01, thresh);
            ctx.moveTo(ax, ay);
            ctx.lineTo(bx, by);
          }
        }
      }
    }
    ctx.stroke();
    ctx.restore();

    // --- Colorbar ---
    const barX = ca.right + 22;
    const barW = 22;
    const barH = ca.bottom - ca.top;

    const grad = ctx.createLinearGradient(0, ca.bottom, 0, ca.top);
    grad.addColorStop(0, t.div[0]);
    grad.addColorStop(Z_ZERO_FRAC, t.div[1]);
    grad.addColorStop(1, t.div[2]);
    ctx.fillStyle = grad;
    ctx.fillRect(barX, ca.top, barW, barH);

    ctx.strokeStyle = t.inkSoft;
    ctx.lineWidth = 1;
    ctx.strokeRect(barX, ca.top, barW, barH);

    // Zero-line marks the valley/peak boundary
    const zeroBarY = ca.bottom - Z_ZERO_FRAC * barH;
    ctx.strokeStyle = t.ink;
    ctx.lineWidth = 1.5;
    ctx.beginPath();
    ctx.moveTo(barX, zeroBarY);
    ctx.lineTo(barX + barW, zeroBarY);
    ctx.stroke();

    // "z" label
    ctx.fillStyle = t.ink;
    ctx.font = 'bold 15px sans-serif';
    ctx.textAlign = 'center';
    ctx.fillText('z', barX + barW / 2, ca.top - 6);

    // Tick marks at max, 0, min
    const ticks = [
      { frac: 1, label: `+${Z_MAX.toFixed(1)}` },
      { frac: Z_ZERO_FRAC, label: '0' },
      { frac: 0, label: Z_MIN.toFixed(1) },
    ];
    ctx.strokeStyle = t.inkSoft;
    ctx.lineWidth = 1;
    ctx.fillStyle = t.inkSoft;
    ctx.font = '15px sans-serif';
    ctx.textAlign = 'left';
    for (const tk of ticks) {
      const ty = ca.bottom - tk.frac * barH;
      ctx.beginPath();
      ctx.moveTo(barX + barW, ty);
      ctx.lineTo(barX + barW + 5, ty);
      ctx.stroke();
      ctx.fillText(tk.label, barX + barW + 8, ty + 5);
    }
  },
};

// --- Mount ---
const canvas = document.createElement('canvas');
document.getElementById('container').appendChild(canvas);

// --- Chart ---
new Chart(canvas, {
  type: 'scatter',
  data: { datasets },
  options: {
    responsive: true,
    maintainAspectRatio: false,
    animation: false,
    layout: { padding: { right: 100, bottom: 10 } },
    plugins: {
      title: {
        display: true,
        text: 'contour-basic · javascript · chartjs · anyplot.ai',
        color: t.ink,
        font: { size: 22 },
        padding: { top: 12, bottom: 12 },
      },
      legend: { display: false },
    },
    scales: {
      x: {
        type: 'linear',
        min: -RANGE,
        max: RANGE,
        ticks: { color: t.inkSoft, font: { size: 14 } },
        grid: { color: t.grid },
        title: { display: true, text: 'X', color: t.ink, font: { size: 16 } },
      },
      y: {
        type: 'linear',
        min: -RANGE,
        max: RANGE,
        ticks: { color: t.inkSoft, font: { size: 14 } },
        grid: { color: t.grid },
        title: { display: true, text: 'Y', color: t.ink, font: { size: 16 } },
      },
    },
  },
  plugins: [colorbarPlugin],
});
Runnable source as JSON, for any HTTP client: https://api.anyplot.ai/specs/contour-basic/chartjs/code. Any spec id and library id listed in llms-full.txt fit the same URL shape; every URL below is complete and callable.
{
  "spec_id": "contour-basic",
  "language": "javascript",
  "library": "chartjs",
  "page": "https://anyplot.ai/contour-basic/javascript/chartjs",
  "hub": "https://anyplot.ai/contour-basic",
  "code_json": "https://api.anyplot.ai/specs/contour-basic/chartjs/code",
  "spec_json": "https://api.anyplot.ai/specs/contour-basic",
  "render_light_png": "https://storage.googleapis.com/anyplot-images/plots/contour-basic/javascript/chartjs/plot-light.png",
  "render_dark_png": "https://storage.googleapis.com/anyplot-images/plots/contour-basic/javascript/chartjs/plot-dark.png",
  "interactive_light_html": "https://storage.googleapis.com/anyplot-images/plots/contour-basic/javascript/chartjs/plot-light.html",
  "interactive_dark_html": "https://storage.googleapis.com/anyplot-images/plots/contour-basic/javascript/chartjs/plot-dark.html",
  "quality_score": 82.0,
  "license": "MIT",
  "guide": "https://anyplot.ai/llms.txt"
}
Part of Basic Contour Plot on anyplot.ai.