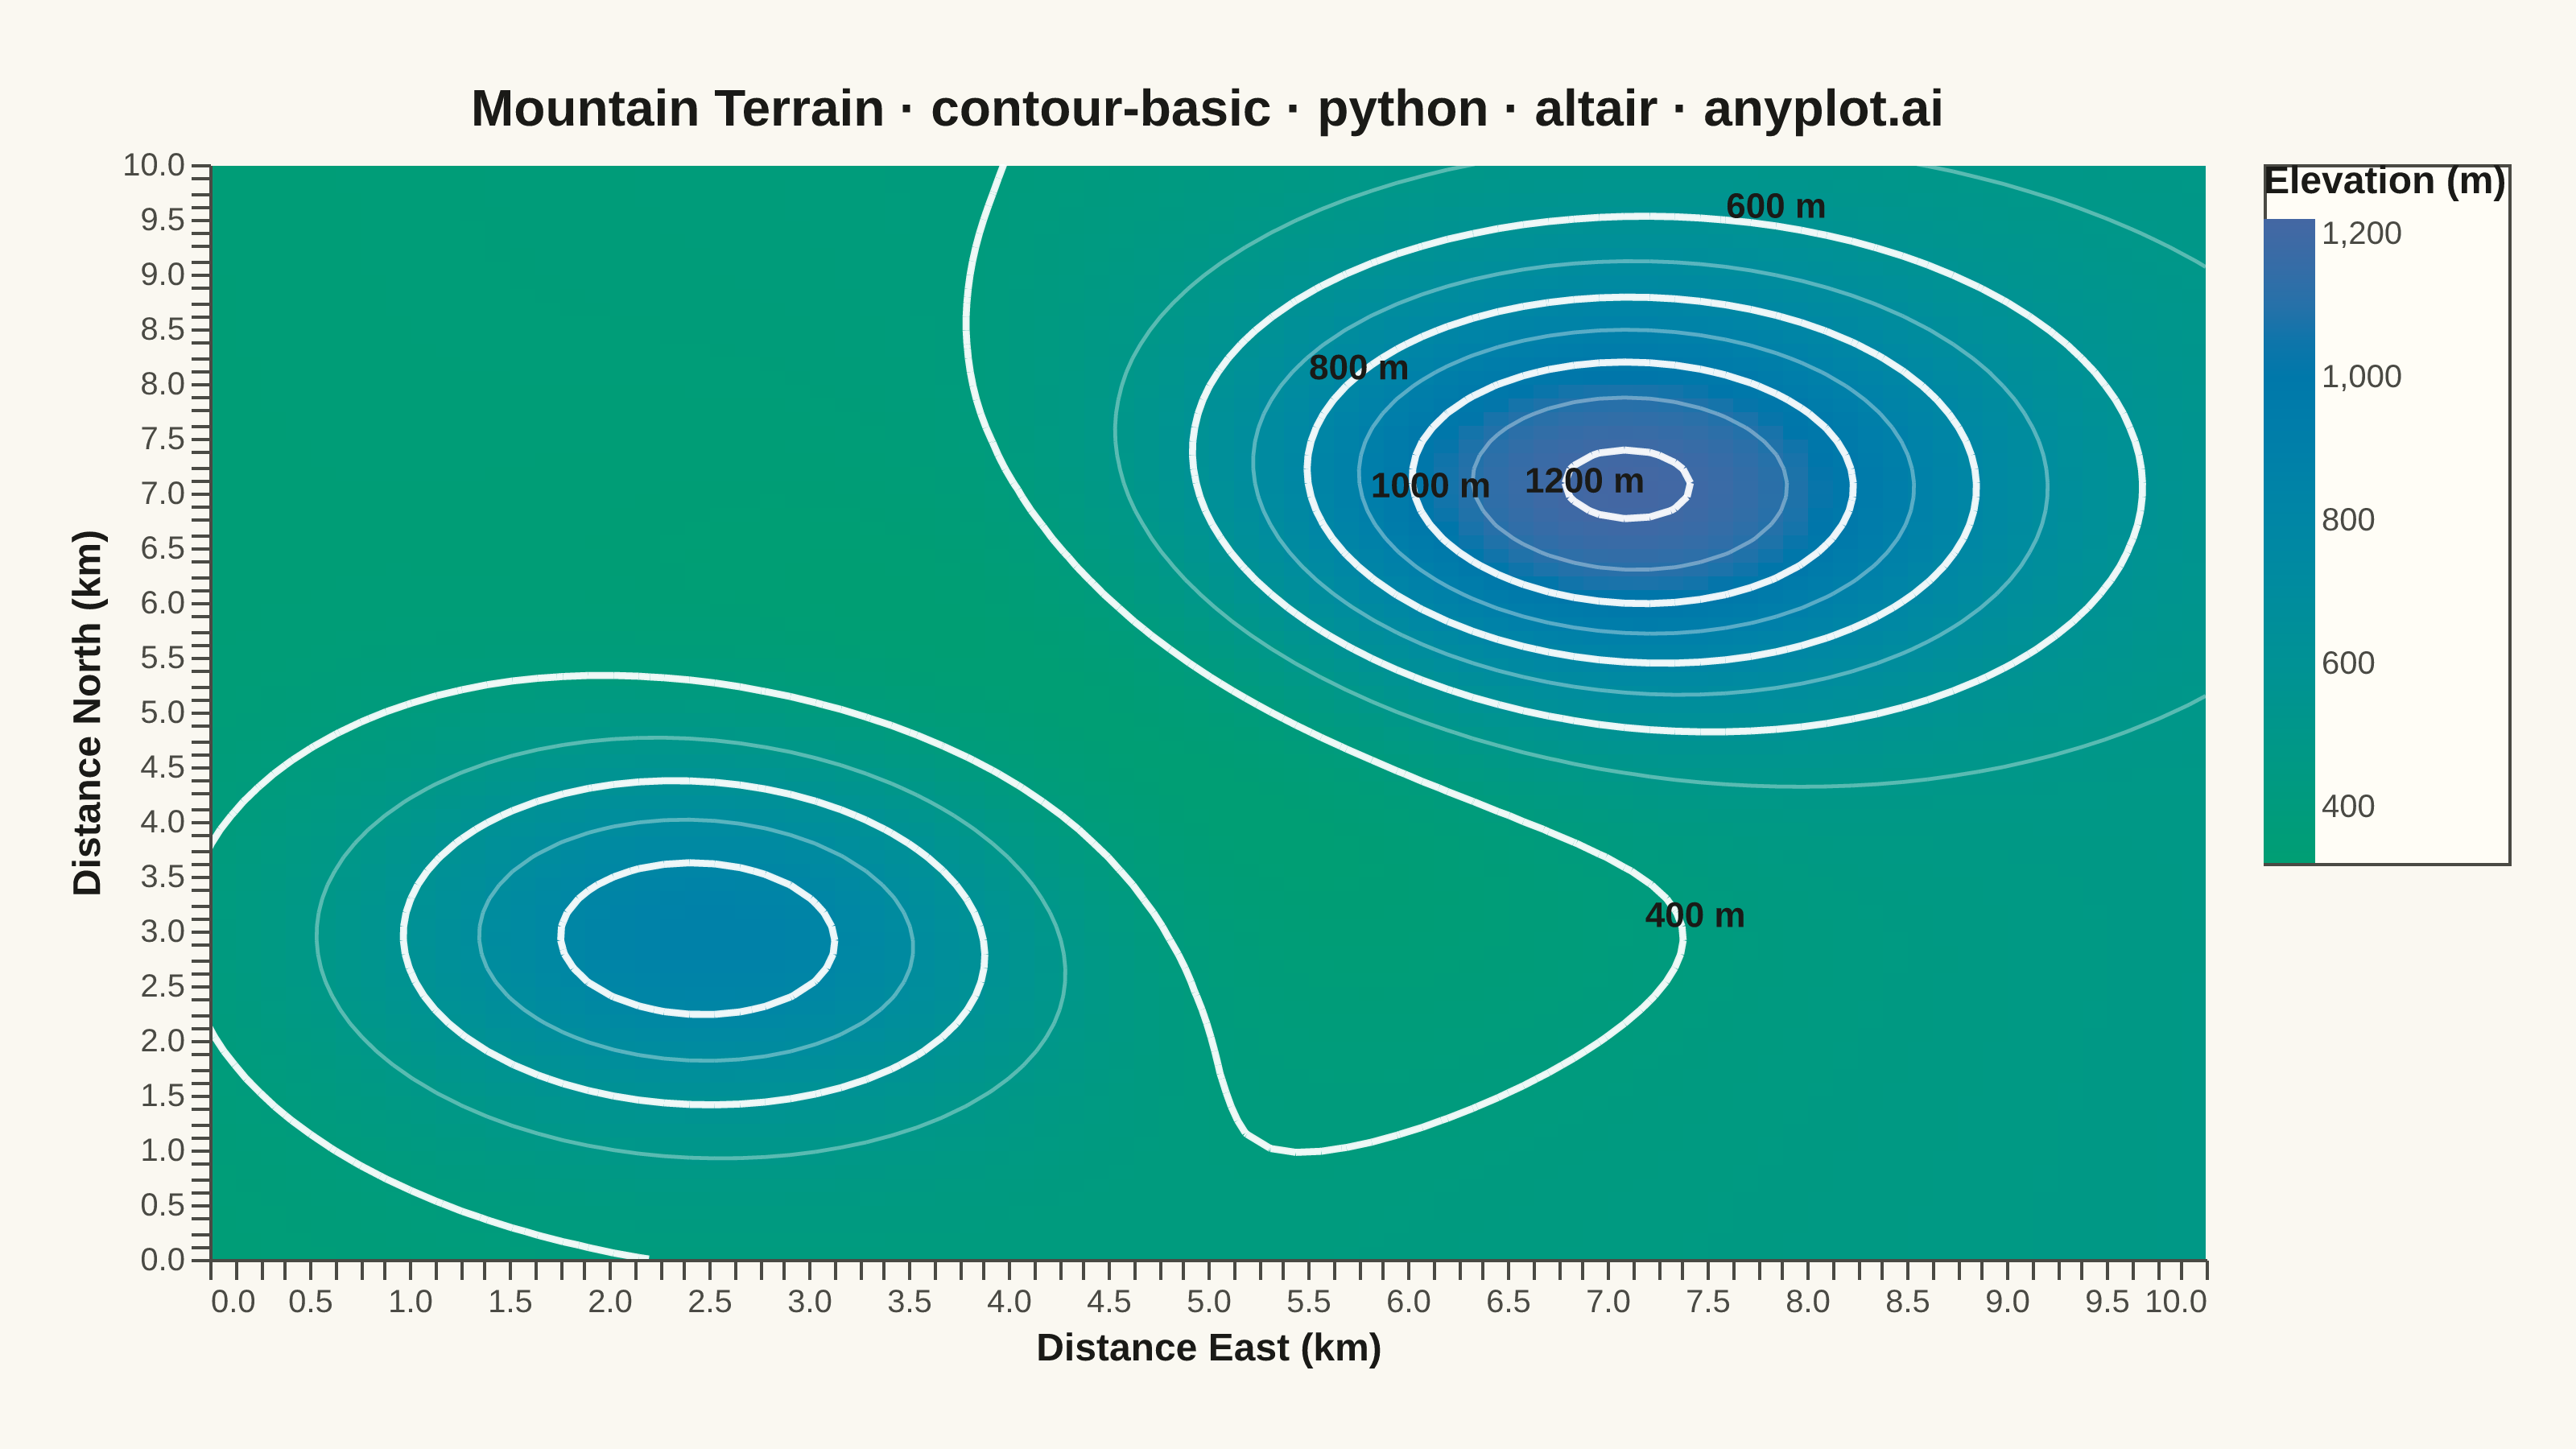
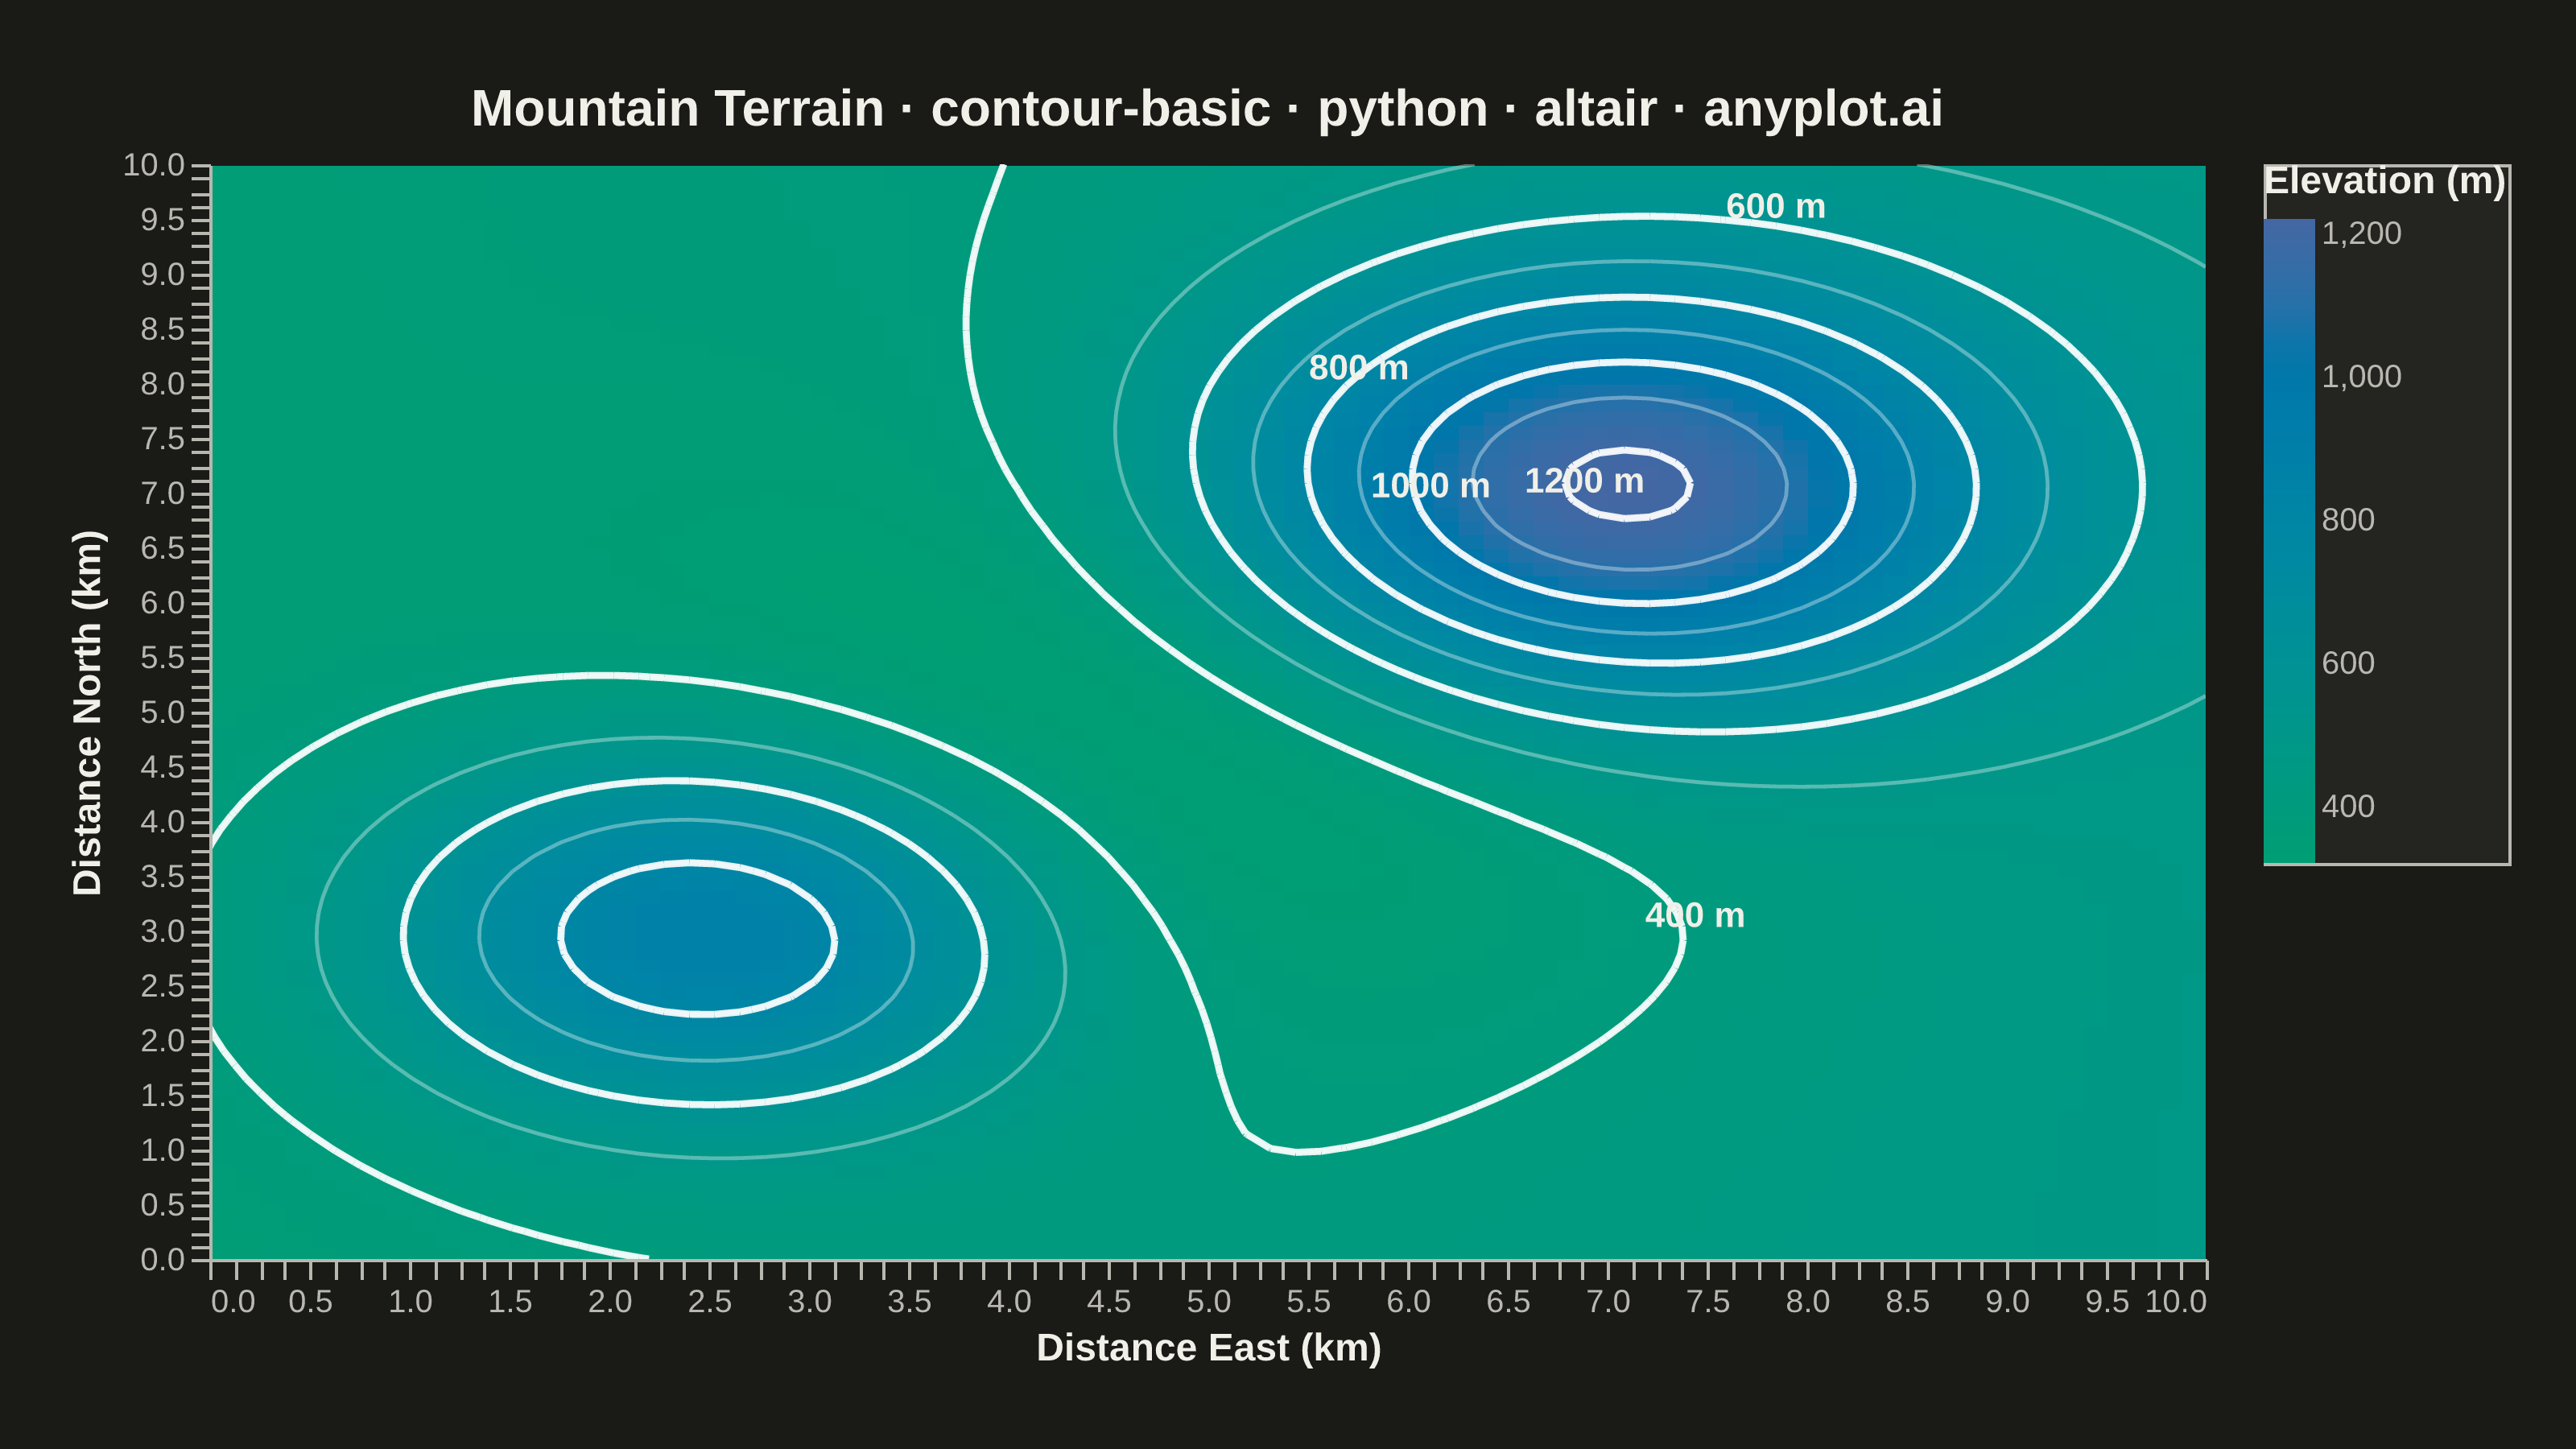
A contour plot displays isolines (level curves) of a 2D scalar field, connecting points of equal value across a surface. It transforms 3D data into an intuitive 2D representation, making it easy to identify regions of high and low values, gradients, and patterns. Contour plots are essential for visualizing continuous surfaces where the relationship between X, Y coordinates and a Z value needs to be understood.
""" anyplot.ai
contour-basic: Basic Contour Plot
Library: altair 6.2.2 | Python 3.13.14
Quality: 86/100 | Updated: 2026-06-25
"""

import importlib
import math
import os
import sys

from PIL import Image


# Drop this script's dir so `altair` resolves to the installed package, not this file
sys.path[:] = [p for p in sys.path if os.path.abspath(p or ".") != os.path.dirname(os.path.abspath(__file__))]
alt = importlib.import_module("altair")
np = importlib.import_module("numpy")
pd = importlib.import_module("pandas")

# Theme tokens — Imprint palette, theme-adaptive chrome
THEME = os.getenv("ANYPLOT_THEME", "light")
PAGE_BG = "#FAF8F1" if THEME == "light" else "#1A1A17"
ELEVATED_BG = "#FFFDF6" if THEME == "light" else "#242420"
INK = "#1A1A17" if THEME == "light" else "#F0EFE8"
INK_SOFT = "#4A4A44" if THEME == "light" else "#B8B7B0"

# Data — topographic elevation of a 10 km × 10 km mountain region
x = np.linspace(0, 10, 80)
y = np.linspace(0, 10, 80)
X, Y = np.meshgrid(x, y)
elevation = (
    850 * np.exp(-((X - 7) ** 2 + (Y - 7) ** 2) / 4.0)
    + 550 * np.exp(-((X - 2.5) ** 2 + (Y - 3) ** 2) / 3.0)
    - 180 * np.exp(-((X - 5) ** 2 + (Y - 5) ** 2) / 8.0)
    + 12 * X
    + 350
)
df_fill = pd.DataFrame({"x": X.ravel(), "y": Y.ravel(), "elevation": elevation.ravel()})

# Contour line segments — marching squares
levels = np.arange(400, 1251, 100)
segments = []
# Collect all midpoints per major level for angular spread placement
level_midpts = {lv: [] for lv in range(400, 1201, 200)}

for level in levels:
    lv = int(level)
    for i in range(len(y) - 1):
        for j in range(len(x) - 1):
            z00 = elevation[i, j]
            z10 = elevation[i + 1, j]
            z01 = elevation[i, j + 1]
            z11 = elevation[i + 1, j + 1]
            case = int(z00 >= level) | (int(z10 >= level) << 1) | (int(z01 >= level) << 2) | (int(z11 >= level) << 3)
            if case == 0 or case == 15:
                continue
            x0, x1, y0, y1 = x[j], x[j + 1], y[i], y[i + 1]
            edges = []
            if (case & 1) != ((case >> 1) & 1):
                t = (level - z00) / (z10 - z00) if z10 != z00 else 0.5
                edges.append((x0, y0 + t * (y1 - y0)))
            if ((case >> 1) & 1) != ((case >> 3) & 1):
                t = (level - z10) / (z11 - z10) if z11 != z10 else 0.5
                edges.append((x0 + t * (x1 - x0), y1))
            if ((case >> 2) & 1) != ((case >> 3) & 1):
                t = (level - z01) / (z11 - z01) if z11 != z01 else 0.5
                edges.append((x1, y0 + t * (y1 - y0)))
            if (case & 1) != ((case >> 2) & 1):
                t = (level - z00) / (z01 - z00) if z01 != z00 else 0.5
                edges.append((x0 + t * (x1 - x0), y0))
            if len(edges) >= 2:
                segments.append(
                    {"x1": edges[0][0], "y1": edges[0][1], "x2": edges[1][0], "y2": edges[1][1], "level": float(lv)}
                )
                if lv % 200 == 0:
                    mx = (edges[0][0] + edges[1][0]) / 2
                    my = (edges[0][1] + edges[1][1]) / 2
                    level_midpts[lv].append((mx, my))
                if len(edges) == 4:
                    segments.append(
                        {"x1": edges[2][0], "y1": edges[2][1], "x2": edges[3][0], "y2": edges[3][1], "level": float(lv)}
                    )

df_lines = pd.DataFrame(segments)
df_major = (
    df_lines[df_lines["level"] % 200 == 0].copy()
    if not df_lines.empty
    else pd.DataFrame(columns=["x1", "y1", "x2", "y2", "level"])
)

# Spread elevation labels at distinct angles from main peak to avoid clustering
PEAK_X, PEAK_Y = 7.0, 7.0
# Each level targets a different angular direction from the main peak (degrees)
spread_targets = {400: 0, 600: 72, 800: 144, 1000: 216, 1200: 288}
label_pts = {}
for lv, pts in sorted(level_midpts.items()):
    if not pts:
        continue
    target_rad = math.radians(spread_targets[lv])
    best_score = float("inf")
    best_pt = None
    for mx, my in pts:
        ang = math.atan2(my - PEAK_Y, mx - PEAK_X)
        diff = abs(ang - target_rad)
        diff = min(diff, 2 * math.pi - diff)
        if diff < best_score:
            best_score = diff
            best_pt = (mx, my)
    if best_pt:
        label_pts[lv] = best_pt

df_labels = pd.DataFrame([{"x": v[0], "y": v[1], "label": f"{k} m"} for k, v in sorted(label_pts.items())])

# Plot title — 64 chars ≤ 67-char baseline, no font-size reduction needed
title_str = "Mountain Terrain · contour-basic · python · altair · anyplot.ai"

# Filled contour — step=0.125 matches data spacing (80 pts / 10 km) to minimize pixelation
filled = (
    alt.Chart(df_fill)
    .mark_rect()
    .encode(
        x=alt.X("x:Q", bin=alt.Bin(step=0.125), title="Distance East (km)"),
        y=alt.Y("y:Q", bin=alt.Bin(step=0.125), title="Distance North (km)"),
        color=alt.Color(
            "mean(elevation):Q",
            scale=alt.Scale(range=["#009E73", "#4467A3"]),
            title="Elevation (m)",
            legend=alt.Legend(titleFontSize=12, labelFontSize=10, gradientLength=200, gradientThickness=16),
        ),
        tooltip=[
            alt.Tooltip("x:Q", title="East (km)", format=".1f"),
            alt.Tooltip("y:Q", title="North (km)", format=".1f"),
            alt.Tooltip("mean(elevation):Q", title="Elevation (m)", format=".0f"),
        ],
    )
)

# Minor contour lines (all levels, semi-transparent white)
lines = (
    alt.Chart(df_lines)
    .mark_rule(strokeWidth=1.2, opacity=0.35, color="white")
    .encode(x="x1:Q", y="y1:Q", x2="x2:Q", y2="y2:Q")
)

# Major contour lines at 200 m intervals (thicker, more opaque)
major_lines = (
    alt.Chart(df_major)
    .mark_rule(strokeWidth=2.2, opacity=0.90, color="white")
    .encode(x="x1:Q", y="y1:Q", x2="x2:Q", y2="y2:Q")
)

# Elevation labels spread radially across the field to avoid clustering at peak
level_labels = (
    alt.Chart(df_labels)
    .mark_text(fontSize=11, fontWeight="bold", color=INK, dx=4, dy=-5)
    .encode(x="x:Q", y="y:Q", text="label:N")
)

chart = (
    (filled + lines + major_lines + level_labels)
    .properties(
        width=620, height=340, title=alt.Title(title_str, fontSize=16, anchor="middle", color=INK), background=PAGE_BG
    )
    .interactive()
    .configure_view(fill=PAGE_BG, stroke=None)
    .configure_axis(
        domainColor=INK_SOFT,
        tickColor=INK_SOFT,
        gridColor=INK,
        gridOpacity=0.10,
        labelColor=INK_SOFT,
        titleColor=INK,
        labelFontSize=10,
        titleFontSize=12,
        tickSize=6,
    )
    .configure_legend(fillColor=ELEVATED_BG, strokeColor=INK_SOFT, labelColor=INK_SOFT, titleColor=INK)
)

# Save PNG then pad to exactly 3200 × 1800 (altair.md canvas rule)
chart.save(f"plot-{THEME}.png", scale_factor=4.0)

TW, TH = 3200, 1800
_img = Image.open(f"plot-{THEME}.png").convert("RGB")
_w, _h = _img.size
if _w > TW or _h > TH:
    raise SystemExit(
        f"altair vl-convert produced {_w}×{_h}, exceeds target {TW}×{TH}. "
        "Shrink chart .properties(width=, height=) values and re-render."
    )
if _w < TW or _h < TH:
    _bg = (250, 248, 241) if THEME == "light" else (26, 26, 23)
    _canvas = Image.new("RGB", (TW, TH), _bg)
    _canvas.paste(_img, ((TW - _w) // 2, (TH - _h) // 2))
    _canvas.save(f"plot-{THEME}.png")

# Save interactive HTML
chart.save(f"plot-{THEME}.html")
Runnable source as JSON, for any HTTP client: https://api.anyplot.ai/specs/contour-basic/altair/code. Any spec id and library id listed in llms-full.txt fit the same URL shape; every URL below is complete and callable.
{
  "spec_id": "contour-basic",
  "language": "python",
  "library": "altair",
  "page": "https://anyplot.ai/contour-basic/python/altair",
  "hub": "https://anyplot.ai/contour-basic",
  "code_json": "https://api.anyplot.ai/specs/contour-basic/altair/code",
  "spec_json": "https://api.anyplot.ai/specs/contour-basic",
  "render_light_png": "https://storage.googleapis.com/anyplot-images/plots/contour-basic/python/altair/plot-light.png",
  "render_dark_png": "https://storage.googleapis.com/anyplot-images/plots/contour-basic/python/altair/plot-dark.png",
  "interactive_light_html": "https://storage.googleapis.com/anyplot-images/plots/contour-basic/python/altair/plot-light.html",
  "interactive_dark_html": "https://storage.googleapis.com/anyplot-images/plots/contour-basic/python/altair/plot-dark.html",
  "quality_score": 86.0,
  "license": "MIT",
  "guide": "https://anyplot.ai/llms.txt"
}
Part of Basic Contour Plot on anyplot.ai.