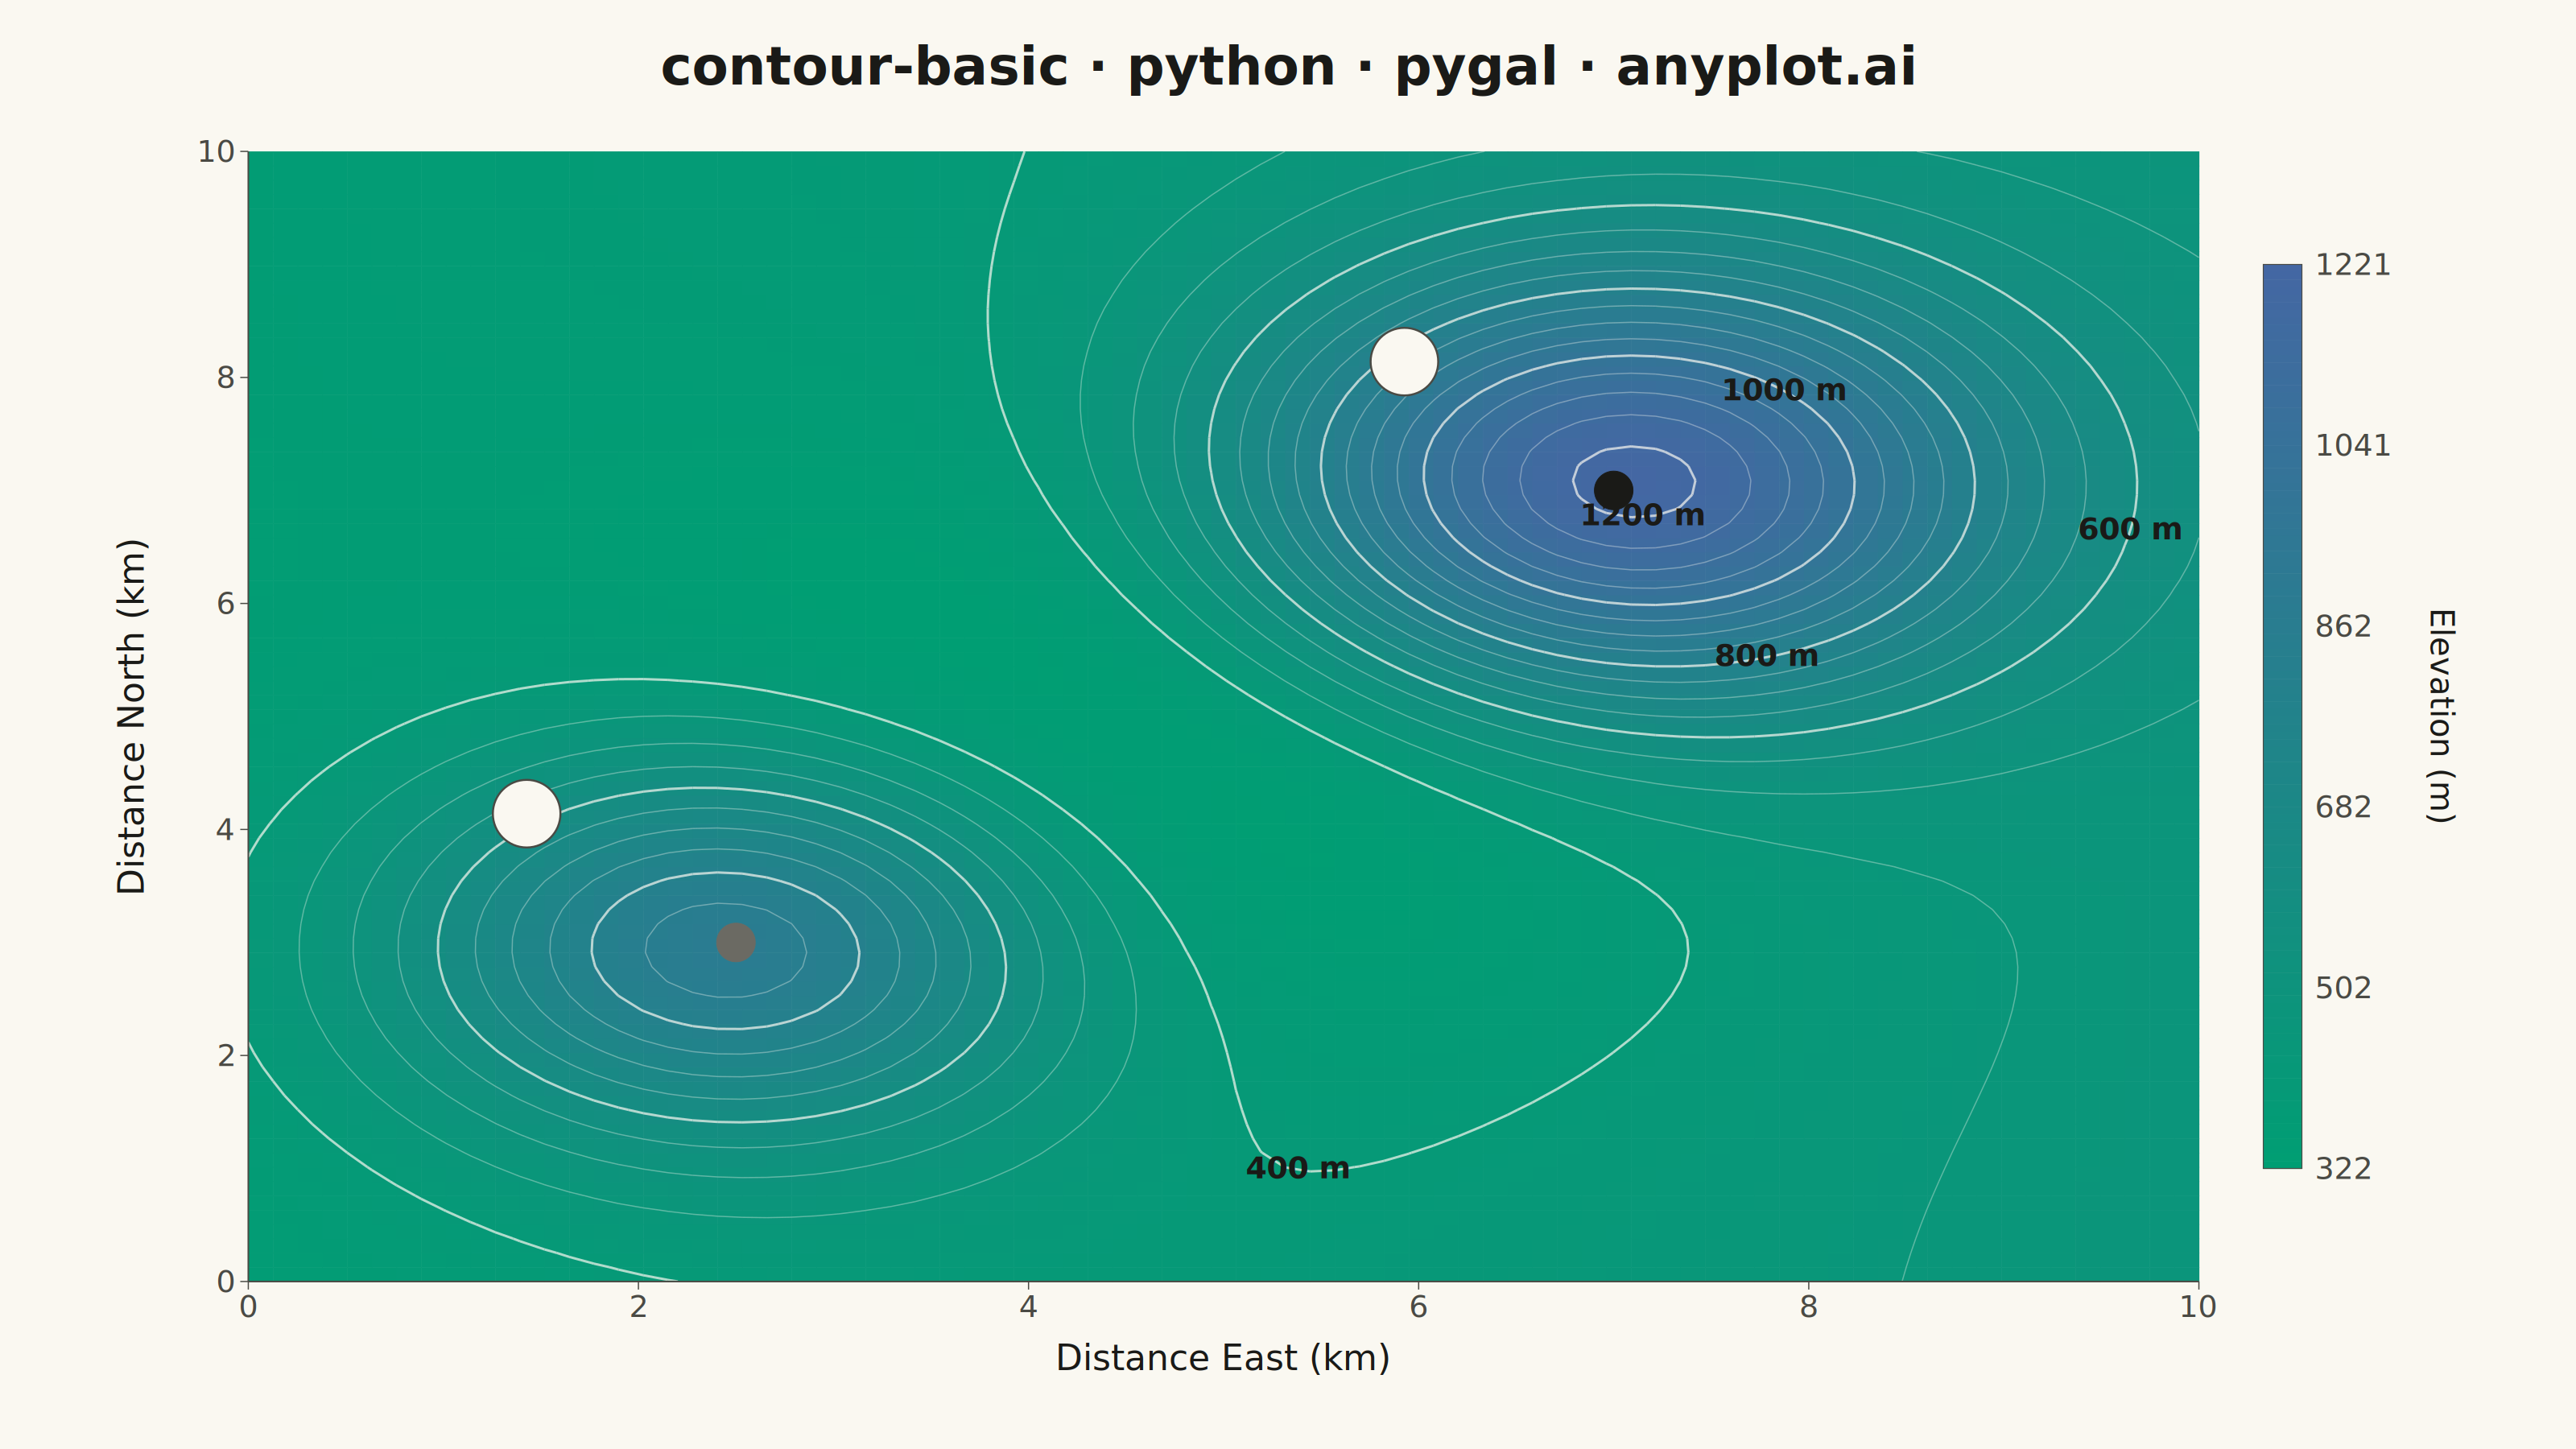
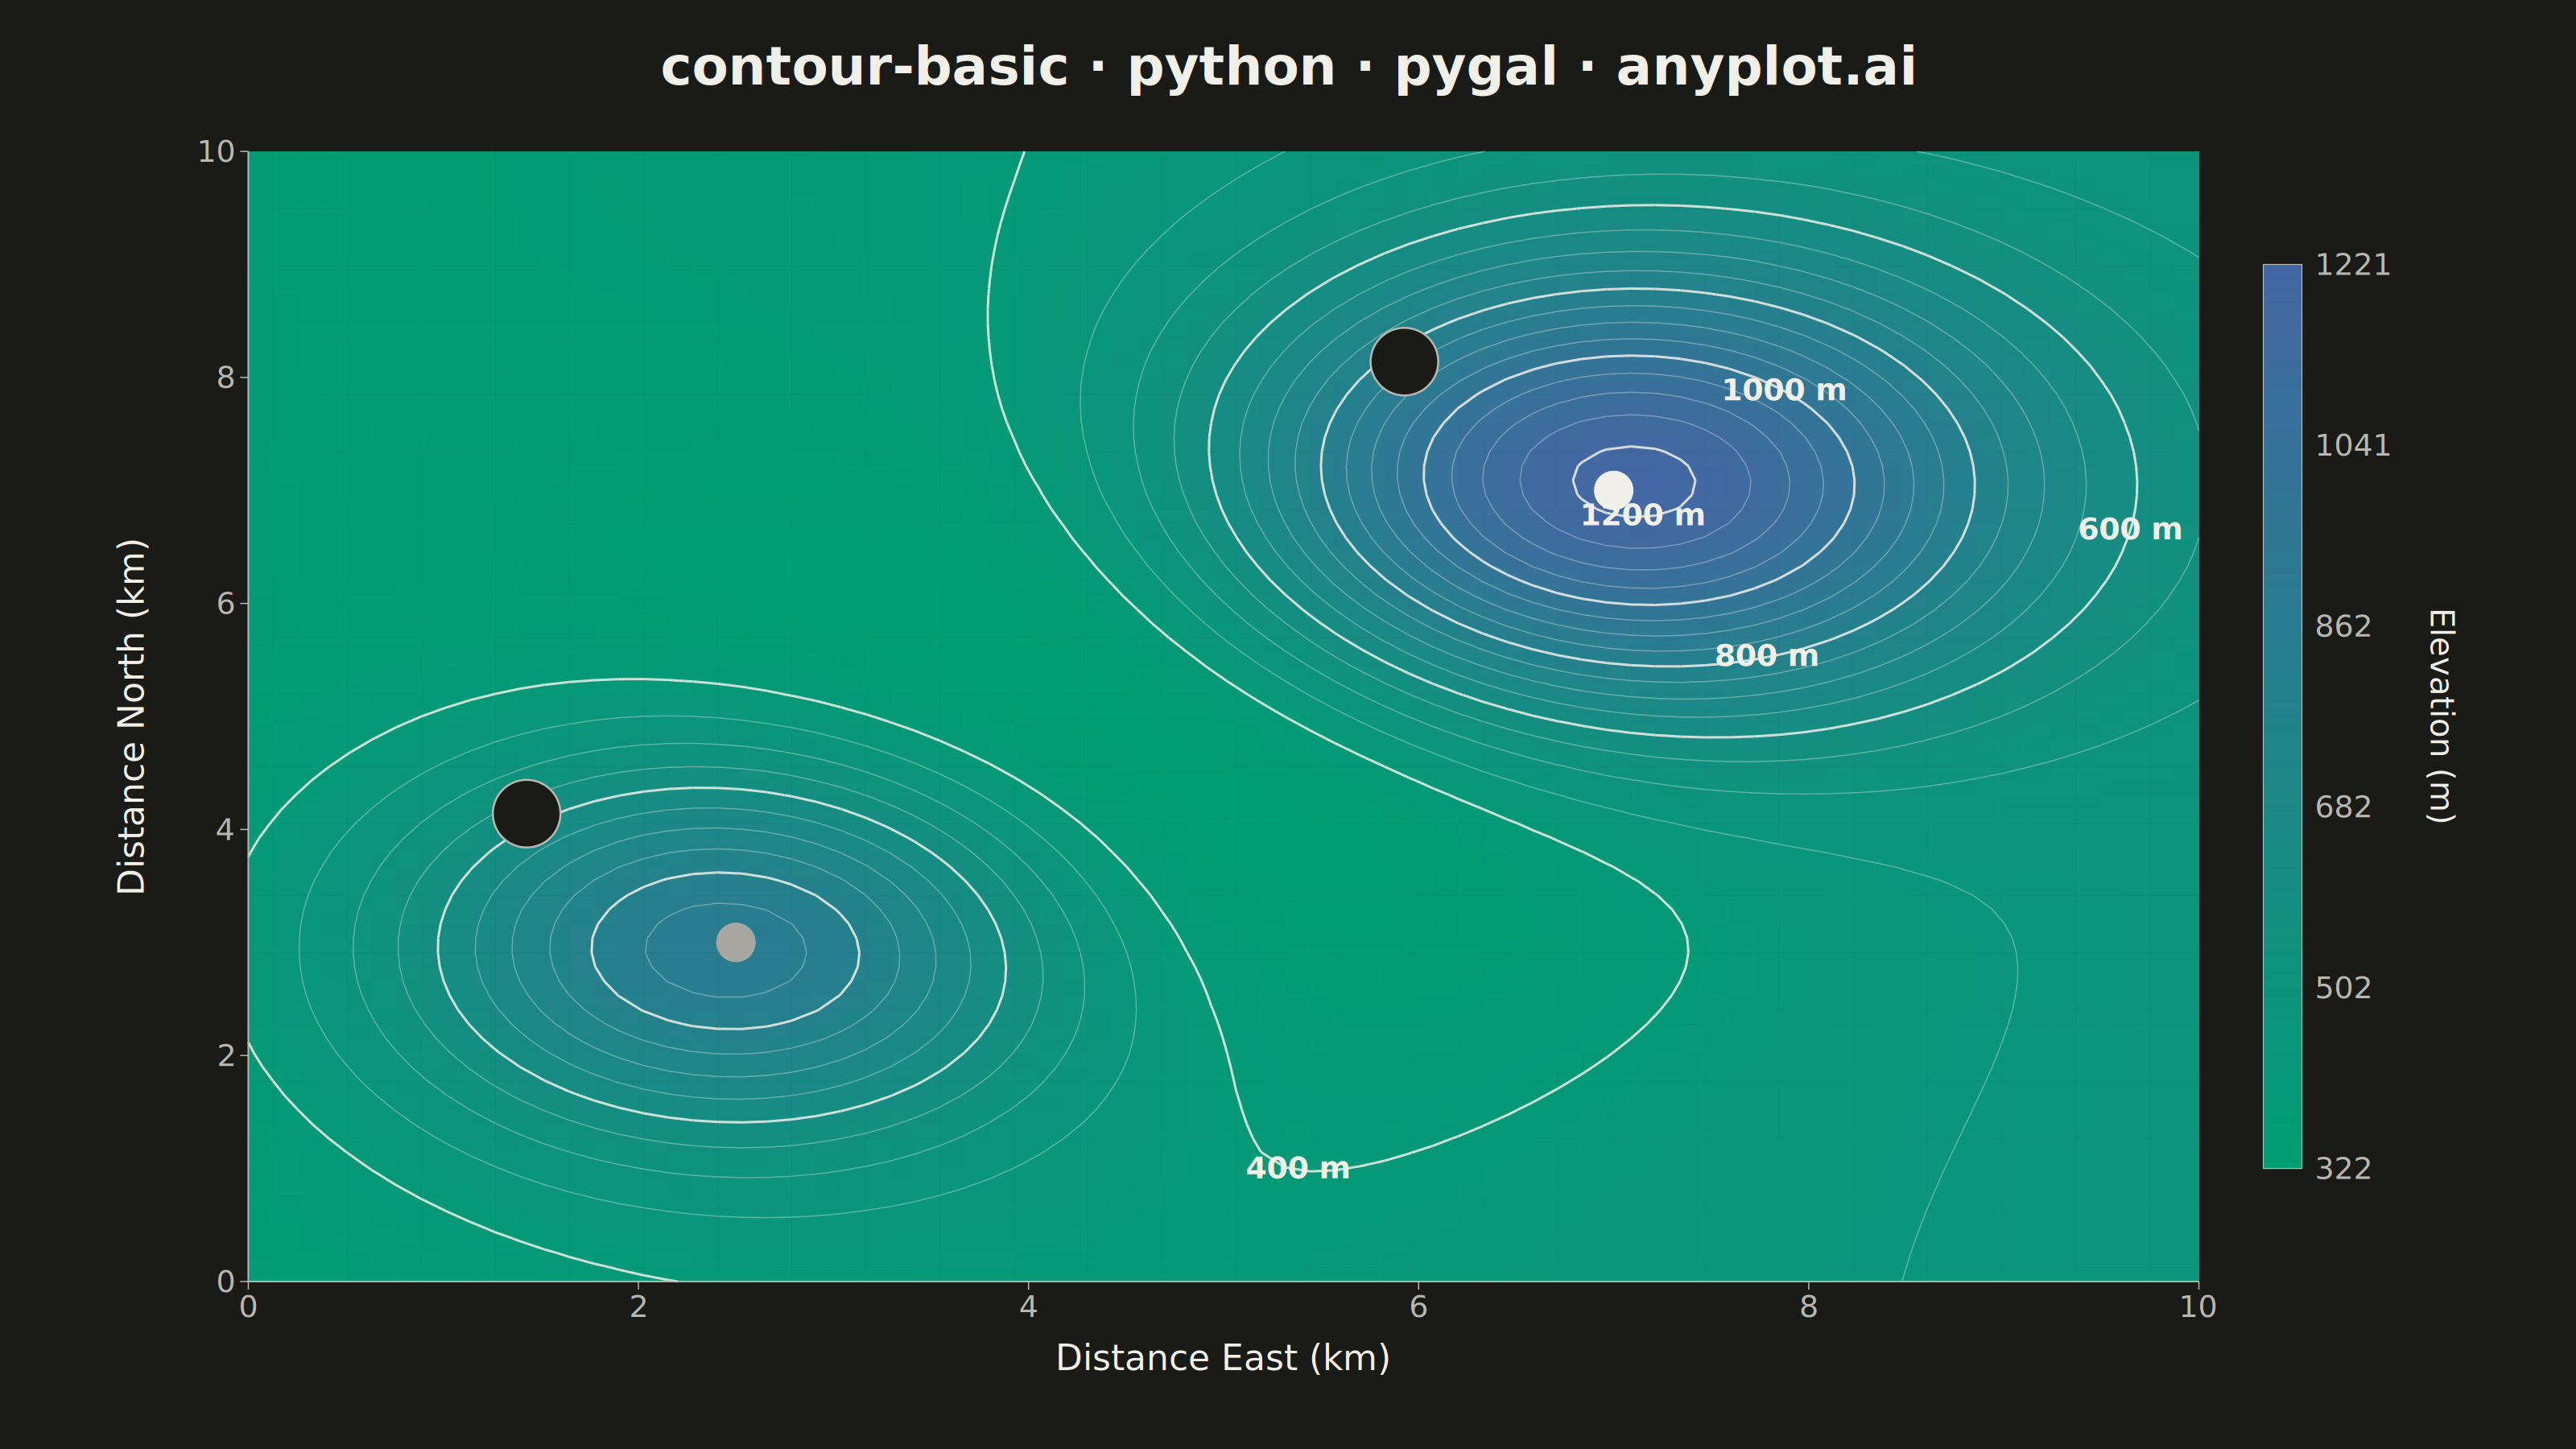
A contour plot displays isolines (level curves) of a 2D scalar field, connecting points of equal value across a surface. It transforms 3D data into an intuitive 2D representation, making it easy to identify regions of high and low values, gradients, and patterns. Contour plots are essential for visualizing continuous surfaces where the relationship between X, Y coordinates and a Z value needs to be understood.
""" anyplot.ai
contour-basic: Basic Contour Plot
Library: pygal 3.1.3 | Python 3.13.14
Quality: 87/100 | Updated: 2026-06-25
"""

import os
import re
import sys


# Script filename shadows the installed `pygal` package when run as `python pygal.py`;
# dropping the script directory from sys.path lets the real package resolve.
sys.path.pop(0)

import cairosvg
import numpy as np
import pygal
from pygal.style import Style


# Theme tokens
THEME = os.getenv("ANYPLOT_THEME", "light")
PAGE_BG = "#FAF8F1" if THEME == "light" else "#1A1A17"
INK = "#1A1A17" if THEME == "light" else "#F0EFE8"
INK_SOFT = "#4A4A44" if THEME == "light" else "#B8B7B0"
INK_MUTED = "#6B6A63" if THEME == "light" else "#A8A79F"
LINE_COLOR = "#FAF8F1" if THEME == "light" else "#F0EFE8"
LINE_OPACITY = 0.70 if THEME == "light" else 0.85

# Imprint sequential colormap: #009E73 (brand green) → #4467A3 (blue)
# Single-polarity sequential for all-positive elevation data (no natural midpoint).
SEQ_R0, SEQ_G0, SEQ_B0 = 0, 158, 115  # #009E73 — brand green (low elevation)
SEQ_R1, SEQ_G1, SEQ_B1 = 68, 103, 163  # #4467A3 — blue (high elevation)

# Data — topographic elevation map of a 10 km × 10 km mountain region
np.random.seed(42)
n_points = 80
x = np.linspace(0, 10, n_points)
y = np.linspace(0, 10, n_points)
X, Y = np.meshgrid(x, y)

elevation = (
    850 * np.exp(-((X - 7) ** 2 + (Y - 7) ** 2) / 4.0)
    + 550 * np.exp(-((X - 2.5) ** 2 + (Y - 3) ** 2) / 3.0)
    - 180 * np.exp(-((X - 5) ** 2 + (Y - 5) ** 2) / 8.0)
    + 12 * X
    + 350
)

z_min, z_max = float(elevation.min()), float(elevation.max())
primary_peak = (7.0, 7.0)
secondary_peak = (2.5, 3.0)
primary_elev = int(
    round(
        float(
            850 * np.exp(0)
            + 550 * np.exp(-((7 - 2.5) ** 2 + (7 - 3) ** 2) / 3.0)
            - 180 * np.exp(-((7 - 5) ** 2 + (7 - 5) ** 2) / 8.0)
            + 12 * 7
            + 350
        )
    )
)
secondary_elev = int(
    round(
        float(
            850 * np.exp(-((2.5 - 7) ** 2 + (3 - 7) ** 2) / 4.0)
            + 550 * np.exp(0)
            - 180 * np.exp(-((2.5 - 5) ** 2 + (3 - 5) ** 2) / 8.0)
            + 12 * 2.5
            + 350
        )
    )
)

# Canvas: 3200×1800 (style guide canonical landscape size)
CANVAS_W, CANVAS_H = 3200, 1800
MARGIN_L, MARGIN_R = 260, 420
MARGIN_T, MARGIN_B = 160, 180

font = "DejaVu Sans, Helvetica, Arial, sans-serif"

# Peak marker colors: INK (theme-adaptive neutral) treats peaks as structural
# annotations rather than categorical data series, avoiding green-on-green invisibility
# while using the correct semantic anchor for landmark overlays.
custom_style = Style(
    background=PAGE_BG,
    plot_background="transparent",
    foreground=INK_SOFT,
    foreground_strong=INK,
    foreground_subtle=INK_MUTED,
    colors=(INK, INK_MUTED),
    font_family=font,
    title_font_family=font,
    label_font_family=font,
    major_label_font_family=font,
    tooltip_font_family=font,
    tooltip_font_size=28,
    legend_font_size=32,
    stroke_width=4,
    opacity=".95",
    opacity_hover=".65",
    transition="200ms ease-in",
)

# Pygal XY chart: peak markers with native hover tooltips retained in HTML export.
chart = pygal.XY(
    width=CANVAS_W,
    height=CANVAS_H,
    style=custom_style,
    show_legend=False,
    show_x_labels=False,
    show_y_labels=False,
    show_x_guides=False,
    show_y_guides=False,
    margin_left=MARGIN_L,
    margin_right=MARGIN_R,
    margin_top=MARGIN_T,
    margin_bottom=MARGIN_B,
    xrange=(0, 10),
    range=(0, 10),
    dots_size=24,
    stroke=False,
    truncate_label=-1,
)

chart.add("Primary Peak", [{"value": primary_peak, "label": f"Primary Peak · {primary_elev} m"}])
chart.add("Secondary Peak", [{"value": secondary_peak, "label": f"Secondary Peak · {secondary_elev} m"}])

# Render pygal to read back exact plot-box placement from peak dot pixel positions.
base_svg = chart.render(is_unicode=True)

dot_re = re.compile(r'<circle cx="([-\d.]+)" cy="([-\d.]+)"[^>]*class="dot')
peaks = [(float(cx), float(cy)) for cx, cy in dot_re.findall(base_svg)]
(p1x, p1y), (p2x, p2y) = peaks[0], peaks[1]
x_scale = (p1x - p2x) / (primary_peak[0] - secondary_peak[0])
x_off = p1x - primary_peak[0] * x_scale
y_scale = (p1y - p2y) / (primary_peak[1] - secondary_peak[1])
y_off = p1y - primary_peak[1] * y_scale

plot_x = MARGIN_L + x_off
plot_y = MARGIN_T + y_off + 10 * y_scale
plot_width = 10 * x_scale
plot_height = -10 * y_scale

cell_w = plot_width / (n_points - 1)
cell_h = plot_height / (n_points - 1)

svg_parts = []

# Filled contour — Imprint sequential colormap (#009E73 → #4467A3)
cell_mean = (elevation[:-1, :-1] + elevation[:-1, 1:] + elevation[1:, :-1] + elevation[1:, 1:]) / 4
cell_t = np.clip((cell_mean - z_min) / (z_max - z_min), 0.0, 1.0)
cell_r = np.clip(np.round(SEQ_R0 + (SEQ_R1 - SEQ_R0) * cell_t), 0, 255).astype(int)
cell_g = np.clip(np.round(SEQ_G0 + (SEQ_G1 - SEQ_G0) * cell_t), 0, 255).astype(int)
cell_b = np.clip(np.round(SEQ_B0 + (SEQ_B1 - SEQ_B0) * cell_t), 0, 255).astype(int)

for i in range(n_points - 1):
    for j in range(n_points - 1):
        cx = plot_x + j * cell_w
        cy = plot_y + plot_height - (i + 1) * cell_h
        color = f"#{cell_r[i, j]:02x}{cell_g[i, j]:02x}{cell_b[i, j]:02x}"
        svg_parts.append(
            f'<rect x="{cx:.2f}" y="{cy:.2f}" width="{cell_w + 0.6:.2f}" '
            f'height="{cell_h + 0.6:.2f}" fill="{color}" stroke="none"/>'
        )

# Marching-squares contour extraction
minor_levels = list(range(400, 1251, 50))
major_levels = list(range(400, 1251, 200))
major_set = set(major_levels)
all_levels = sorted(set(minor_levels + major_levels))

major_segments_by_level = {}

for lvl in all_levels:
    is_major = lvl in major_set
    segments = []
    for i in range(n_points - 1):
        for j in range(n_points - 1):
            z00 = elevation[i, j]
            z01 = elevation[i, j + 1]
            z10 = elevation[i + 1, j]
            z11 = elevation[i + 1, j + 1]

            case = 0
            if z00 >= lvl:
                case |= 1
            if z01 >= lvl:
                case |= 2
            if z11 >= lvl:
                case |= 4
            if z10 >= lvl:
                case |= 8
            if case == 0 or case == 15:
                continue

            x0 = plot_x + j * cell_w
            y_bot = plot_y + plot_height - i * cell_h
            y_top = plot_y + plot_height - (i + 1) * cell_h

            fl = 0.5 if abs(z10 - z00) < 1e-10 else (lvl - z00) / (z10 - z00)
            fr = 0.5 if abs(z11 - z01) < 1e-10 else (lvl - z01) / (z11 - z01)
            ft = 0.5 if abs(z11 - z10) < 1e-10 else (lvl - z10) / (z11 - z10)
            fb = 0.5 if abs(z01 - z00) < 1e-10 else (lvl - z00) / (z01 - z00)

            left = (x0, y_bot - cell_h * fl)
            right = (x0 + cell_w, y_bot - cell_h * fr)
            top = (x0 + cell_w * ft, y_top)
            bottom = (x0 + cell_w * fb, y_bot)

            if case == 1 or case == 14:
                segments.append((left, bottom))
            elif case == 2 or case == 13:
                segments.append((bottom, right))
            elif case == 3 or case == 12:
                segments.append((left, right))
            elif case == 4 or case == 11:
                segments.append((right, top))
            elif case == 5:
                segments.append((left, top))
                segments.append((bottom, right))
            elif case == 6 or case == 9:
                segments.append((bottom, top))
            elif case == 7 or case == 8:
                segments.append((left, top))
            elif case == 10:
                segments.append((left, bottom))
                segments.append((right, top))

    stroke_w = 3 if is_major else 1.5
    stroke_op = LINE_OPACITY if is_major else 0.35
    for (x1, y1), (x2, y2) in segments:
        svg_parts.append(
            f'<line x1="{x1:.2f}" y1="{y1:.2f}" x2="{x2:.2f}" y2="{y2:.2f}" '
            f'stroke="{LINE_COLOR}" stroke-width="{stroke_w}" stroke-opacity="{stroke_op}"/>'
        )

    if is_major:
        major_segments_by_level[lvl] = segments

# Contour level labels — maximize distance from placed anchors.
# A buffer ring of ghost points around the primary peak fans labels away from the
# high-elevation crowding zone, reducing overlap near the 1200 m contour.
label_font_px = 38
placed_positions = [
    (p1x, p1y),
    (p2x, p2y),
    (p1x - 110, p1y),
    (p1x + 110, p1y),
    (p1x, p1y - 110),
    (p1x, p1y + 110),
    (p1x - 80, p1y - 80),
    (p1x + 80, p1y - 80),
    (p1x - 80, p1y + 80),
    (p1x + 80, p1y + 80),
    (p1x - 140, p1y - 40),
    (p1x + 140, p1y - 40),
    (p1x - 40, p1y - 140),
    (p1x + 40, p1y - 140),
]
for lvl, segs in major_segments_by_level.items():
    if not segs:
        continue
    best_cx, best_cy, best_score = 0.0, 0.0, -1.0
    for (x1, y1), (x2, y2) in segs:
        mx, my = (x1 + x2) / 2, (y1 + y2) / 2
        nearest_sq = min((mx - px) ** 2 + (my - py) ** 2 for px, py in placed_positions)
        if nearest_sq > best_score:
            best_score = nearest_sq
            best_cx, best_cy = mx, my
    cx, cy = best_cx, best_cy
    placed_positions.append((cx, cy))
    text = f"{lvl} m"
    svg_parts.append(
        f'<text x="{cx:.2f}" y="{cy + 11:.2f}" text-anchor="middle" '
        f'fill="none" stroke="{PAGE_BG}" stroke-width="7" stroke-linejoin="round" '
        f'style="font-size:{label_font_px}px;font-family:{font};font-weight:600">{text}</text>'
    )
    svg_parts.append(
        f'<text x="{cx:.2f}" y="{cy + 11:.2f}" text-anchor="middle" '
        f'fill="{INK}" '
        f'style="font-size:{label_font_px}px;font-family:{font};font-weight:600">{text}</text>'
    )

# L-shaped frame (left + bottom only)
svg_parts.append(
    f'<line x1="{plot_x:.2f}" y1="{plot_y:.2f}" x2="{plot_x:.2f}" '
    f'y2="{plot_y + plot_height:.2f}" stroke="{INK_SOFT}" stroke-width="2"/>'
)
svg_parts.append(
    f'<line x1="{plot_x:.2f}" y1="{plot_y + plot_height:.2f}" '
    f'x2="{plot_x + plot_width:.2f}" y2="{plot_y + plot_height:.2f}" '
    f'stroke="{INK_SOFT}" stroke-width="2"/>'
)

# X-axis ticks + labels
n_x_ticks = 6
for i in range(n_x_ticks):
    frac = i / (n_x_ticks - 1)
    tick_x = plot_x + frac * plot_width
    tick_y = plot_y + plot_height
    val = frac * 10
    svg_parts.append(
        f'<line x1="{tick_x:.2f}" y1="{tick_y:.2f}" x2="{tick_x:.2f}" '
        f'y2="{tick_y + 10:.2f}" stroke="{INK_SOFT}" stroke-width="1.5"/>'
    )
    svg_parts.append(
        f'<text x="{tick_x:.2f}" y="{tick_y + 44:.2f}" text-anchor="middle" '
        f'fill="{INK_SOFT}" style="font-size:38px;font-family:{font}">{val:.0f}</text>'
    )

svg_parts.append(
    f'<text x="{plot_x + plot_width / 2:.2f}" y="{plot_y + plot_height + 110:.2f}" '
    f'text-anchor="middle" fill="{INK}" '
    f'style="font-size:44px;font-weight:500;font-family:{font}">Distance East (km)</text>'
)

# Y-axis ticks + labels
n_y_ticks = 6
for i in range(n_y_ticks):
    frac = i / (n_y_ticks - 1)
    tick_y = plot_y + plot_height - frac * plot_height
    tick_x = plot_x
    val = frac * 10
    svg_parts.append(
        f'<line x1="{tick_x - 10:.2f}" y1="{tick_y:.2f}" x2="{tick_x:.2f}" '
        f'y2="{tick_y:.2f}" stroke="{INK_SOFT}" stroke-width="1.5"/>'
    )
    svg_parts.append(
        f'<text x="{tick_x - 18:.2f}" y="{tick_y + 13:.2f}" text-anchor="end" '
        f'fill="{INK_SOFT}" style="font-size:38px;font-family:{font}">{val:.0f}</text>'
    )

y_title_x = plot_x - 130
y_title_y = plot_y + plot_height / 2
svg_parts.append(
    f'<text x="{y_title_x:.2f}" y="{y_title_y:.2f}" text-anchor="middle" fill="{INK}" '
    f'style="font-size:44px;font-weight:500;font-family:{font}" '
    f'transform="rotate(-90, {y_title_x:.2f}, {y_title_y:.2f})">Distance North (km)</text>'
)

# Colorbar — right of plot, Imprint sequential colormap (green=low, blue=high)
cb_width = 48
cb_height = int(plot_height * 0.80)
cb_x = plot_x + plot_width + 80
cb_y = plot_y + (plot_height - cb_height) / 2

n_cb_segments = 120
cb_t = np.clip(1.0 - np.arange(n_cb_segments) / (n_cb_segments - 1), 0.0, 1.0)
cb_r = np.clip(np.round(SEQ_R0 + (SEQ_R1 - SEQ_R0) * cb_t), 0, 255).astype(int)
cb_g = np.clip(np.round(SEQ_G0 + (SEQ_G1 - SEQ_G0) * cb_t), 0, 255).astype(int)
cb_b = np.clip(np.round(SEQ_B0 + (SEQ_B1 - SEQ_B0) * cb_t), 0, 255).astype(int)
seg_h = cb_height / n_cb_segments
for i in range(n_cb_segments):
    color = f"#{cb_r[i]:02x}{cb_g[i]:02x}{cb_b[i]:02x}"
    seg_y = cb_y + i * seg_h
    svg_parts.append(
        f'<rect x="{cb_x:.2f}" y="{seg_y:.2f}" width="{cb_width}" '
        f'height="{seg_h + 0.6:.2f}" fill="{color}" stroke="none"/>'
    )

svg_parts.append(
    f'<rect x="{cb_x:.2f}" y="{cb_y:.2f}" width="{cb_width}" height="{cb_height}" '
    f'fill="none" stroke="{INK_SOFT}" stroke-width="1.2"/>'
)

n_cb_labels = 6
for i in range(n_cb_labels):
    frac = i / (n_cb_labels - 1)
    val = z_max - (z_max - z_min) * frac
    label_y = cb_y + frac * cb_height + 13
    svg_parts.append(
        f'<text x="{cb_x + cb_width + 16:.2f}" y="{label_y:.2f}" fill="{INK_SOFT}" '
        f'style="font-size:38px;font-family:{font}">{int(round(val))}</text>'
    )

cb_title_x = cb_x + cb_width + 160
cb_title_y = cb_y + cb_height / 2
svg_parts.append(
    f'<text x="{cb_title_x:.2f}" y="{cb_title_y:.2f}" text-anchor="middle" fill="{INK}" '
    f'style="font-size:40px;font-weight:500;font-family:{font}" '
    f'transform="rotate(90, {cb_title_x:.2f}, {cb_title_y:.2f})">Elevation (m)</text>'
)

# Peak marker halos — PAGE_BG ring makes INK dots visible against colored contour surface.
# Rendered after fill/lines (on top in SVG order) but before pygal dots (which render last).
for px, py in [(p1x, p1y), (p2x, p2y)]:
    svg_parts.append(
        f'<circle cx="{px:.2f}" cy="{py:.2f}" r="42" fill="{PAGE_BG}" stroke="{INK_SOFT}" stroke-width="2.5"/>'
    )

# Title
title_text = "contour-basic · python · pygal · anyplot.ai"
bg_rect = f'<rect x="0" y="0" width="{CANVAS_W}" height="{CANVAS_H}" fill="{PAGE_BG}" stroke="none"/>'
title_svg_elem = (
    f'<text x="{CANVAS_W / 2:.2f}" y="105" text-anchor="middle" fill="{INK}" '
    f'style="font-size:66px;font-weight:600;font-family:{font}">'
    f"{title_text}</text>"
)

custom_svg = "\n".join([bg_rect, title_svg_elem] + svg_parts)
plot_group_idx = base_svg.find('class="plot"')
if plot_group_idx != -1:
    insert_idx = base_svg.rfind("<g", 0, plot_group_idx)
    output_svg = base_svg[:insert_idx] + custom_svg + "\n" + base_svg[insert_idx:]
else:
    output_svg = base_svg.replace("</svg>", f"{custom_svg}\n</svg>")

cairosvg.svg2png(bytestring=output_svg.encode("utf-8"), write_to=f"plot-{THEME}.png")

html_content = f"""<!DOCTYPE html>
<html>
<head>
    <meta charset="utf-8">
    <title>contour-basic · python · pygal · anyplot.ai</title>
    <style>
        body {{ margin: 0; background: {PAGE_BG}; display: flex;
                justify-content: center; align-items: center; min-height: 100vh; }}
        .chart {{ max-width: 100%; height: auto; }}
    </style>
</head>
<body>
    <figure class="chart">
        {output_svg}
    </figure>
</body>
</html>
"""

with open(f"plot-{THEME}.html", "w", encoding="utf-8") as f:
    f.write(html_content)
Runnable source as JSON, for any HTTP client: https://api.anyplot.ai/specs/contour-basic/pygal/code. Any spec id and library id listed in llms-full.txt fit the same URL shape; every URL below is complete and callable.
{
  "spec_id": "contour-basic",
  "language": "python",
  "library": "pygal",
  "page": "https://anyplot.ai/contour-basic/python/pygal",
  "hub": "https://anyplot.ai/contour-basic",
  "code_json": "https://api.anyplot.ai/specs/contour-basic/pygal/code",
  "spec_json": "https://api.anyplot.ai/specs/contour-basic",
  "render_light_png": "https://storage.googleapis.com/anyplot-images/plots/contour-basic/python/pygal/plot-light.png",
  "render_dark_png": "https://storage.googleapis.com/anyplot-images/plots/contour-basic/python/pygal/plot-dark.png",
  "interactive_light_html": "https://storage.googleapis.com/anyplot-images/plots/contour-basic/python/pygal/plot-light.html",
  "interactive_dark_html": "https://storage.googleapis.com/anyplot-images/plots/contour-basic/python/pygal/plot-dark.html",
  "quality_score": 87.0,
  "license": "MIT",
  "guide": "https://anyplot.ai/llms.txt"
}
Part of Basic Contour Plot on anyplot.ai.