The same plot in 14 other libraries — JavaScript: Chart.js, D3.js, Highcharts, MUI X Charts; Python: Altair, Bokeh, lets-plot, Matplotlib, Plotly, plotnine, Pygal, Seaborn; R: ggplot2; Julia: Makie.jl. Compare all 15 side by side: Basic Contour Plot in Python, R, Julia and JavaScript.
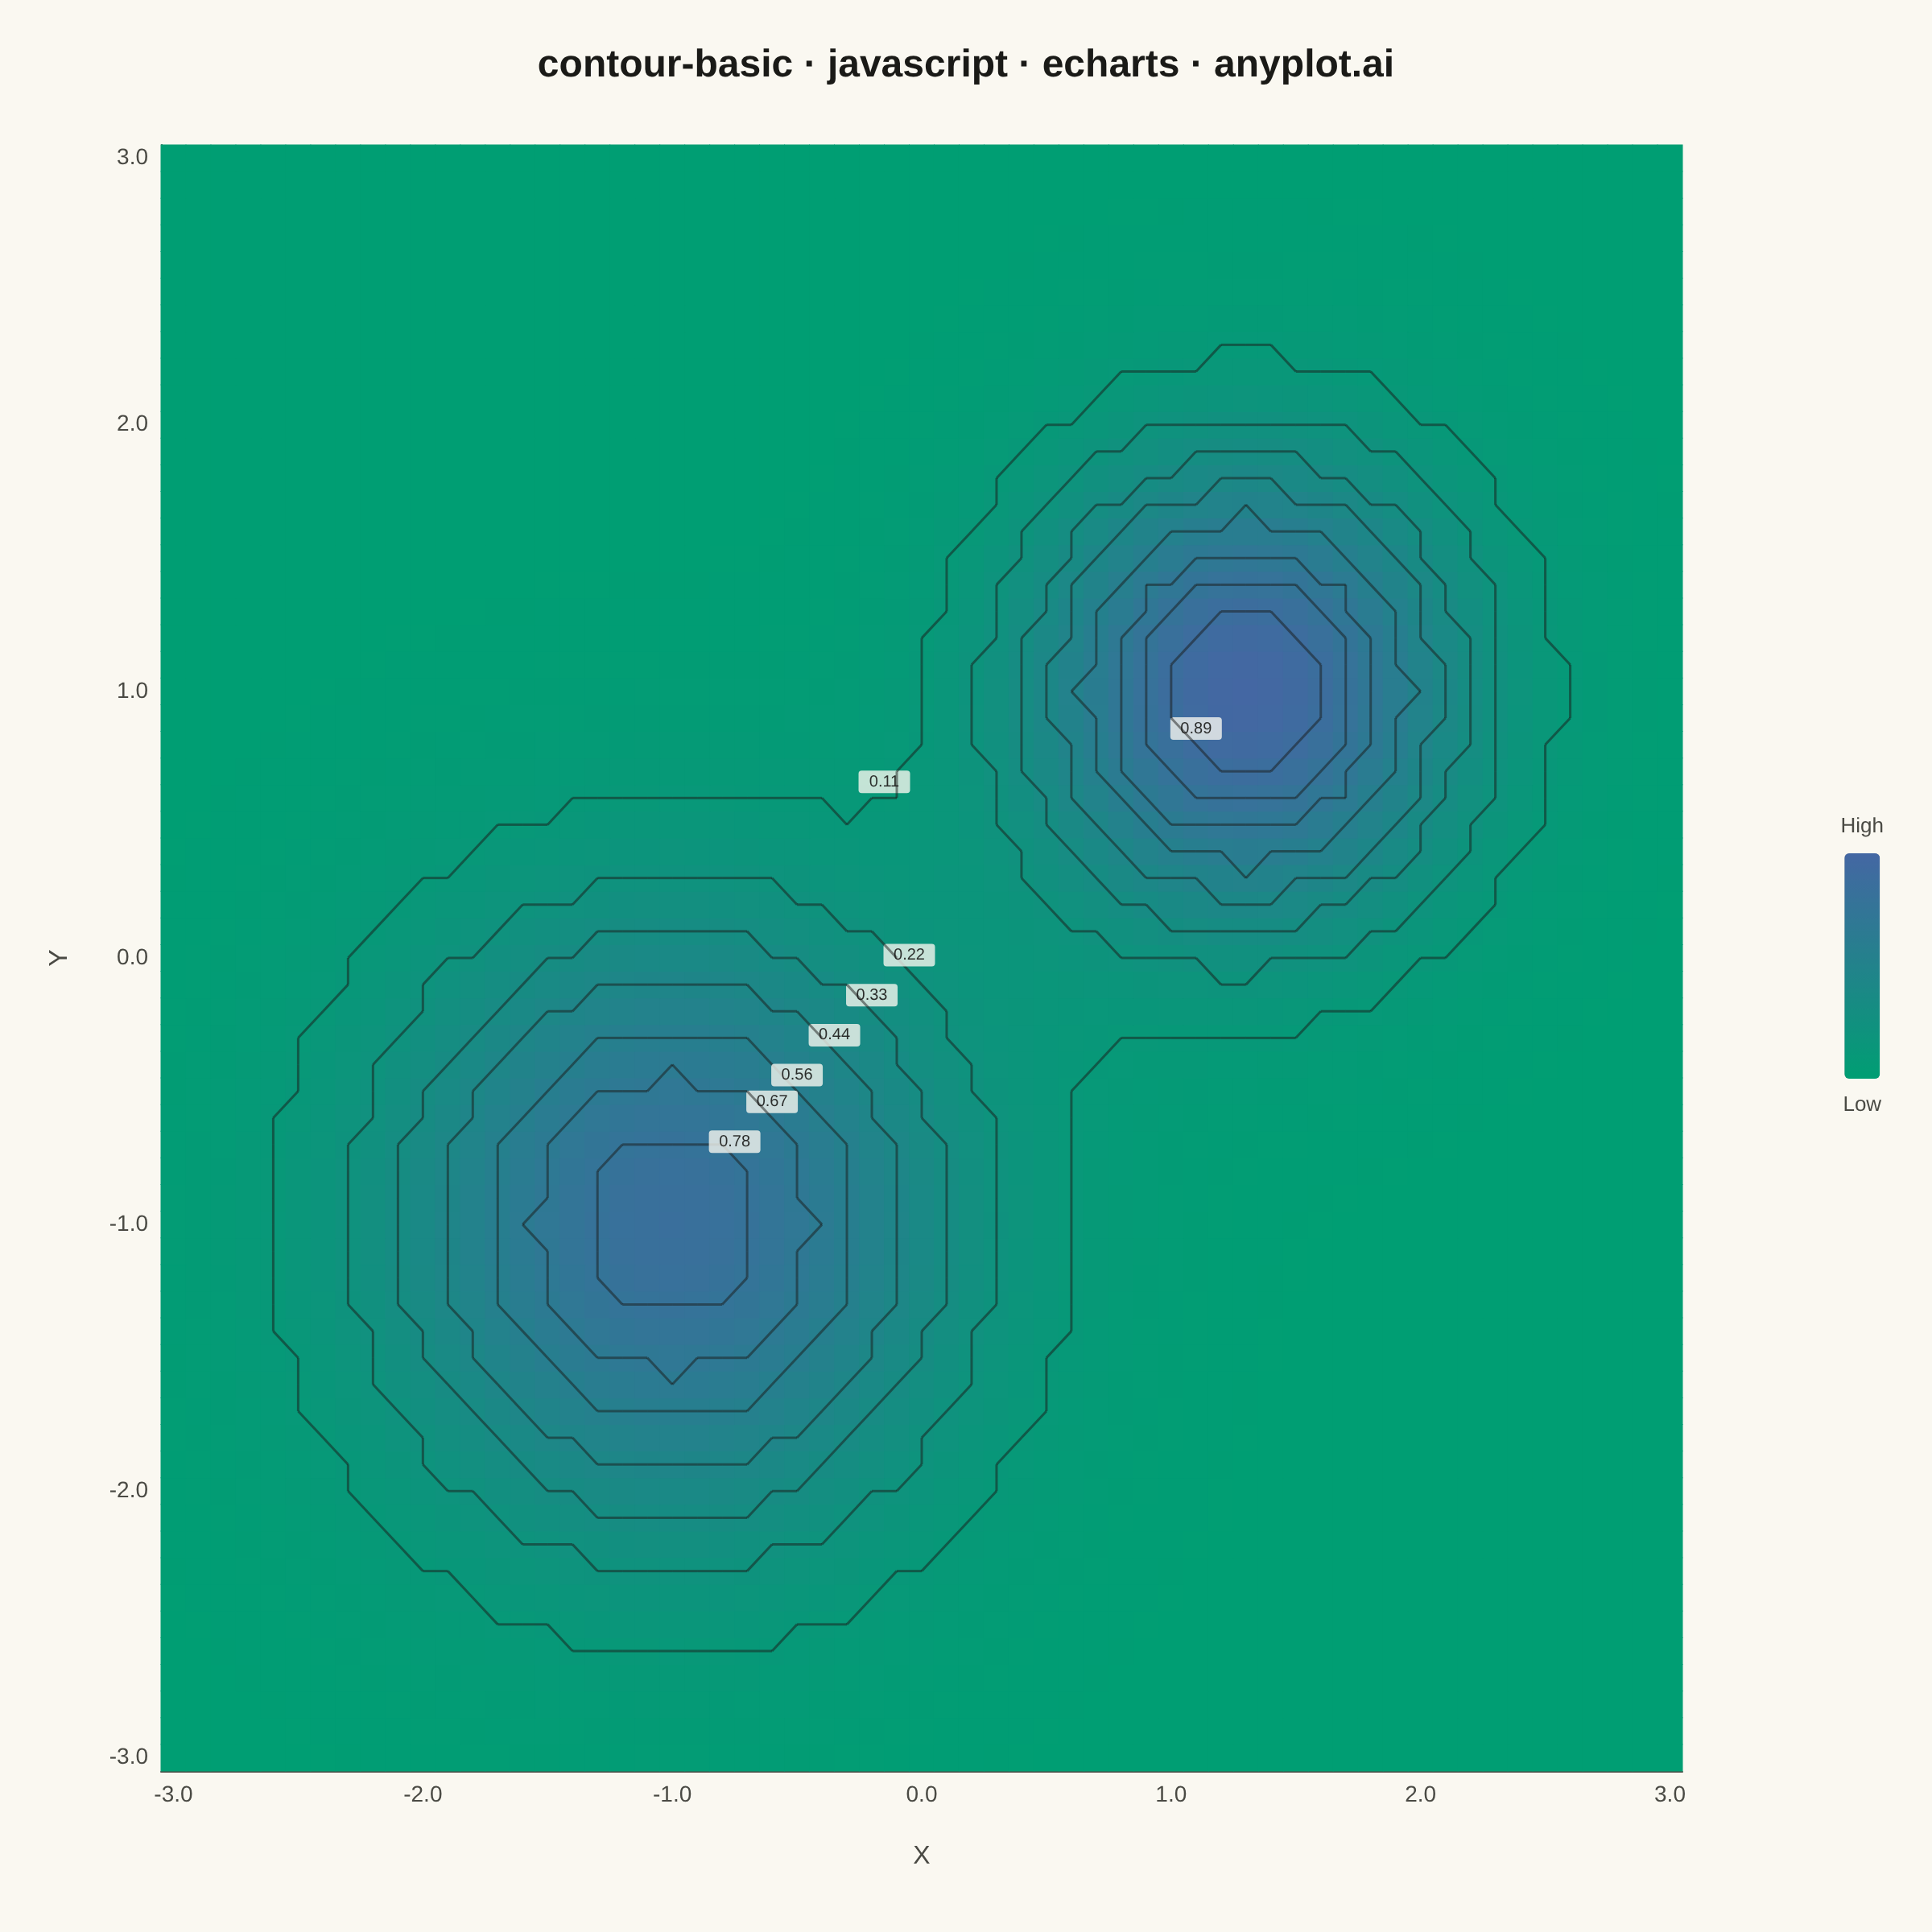
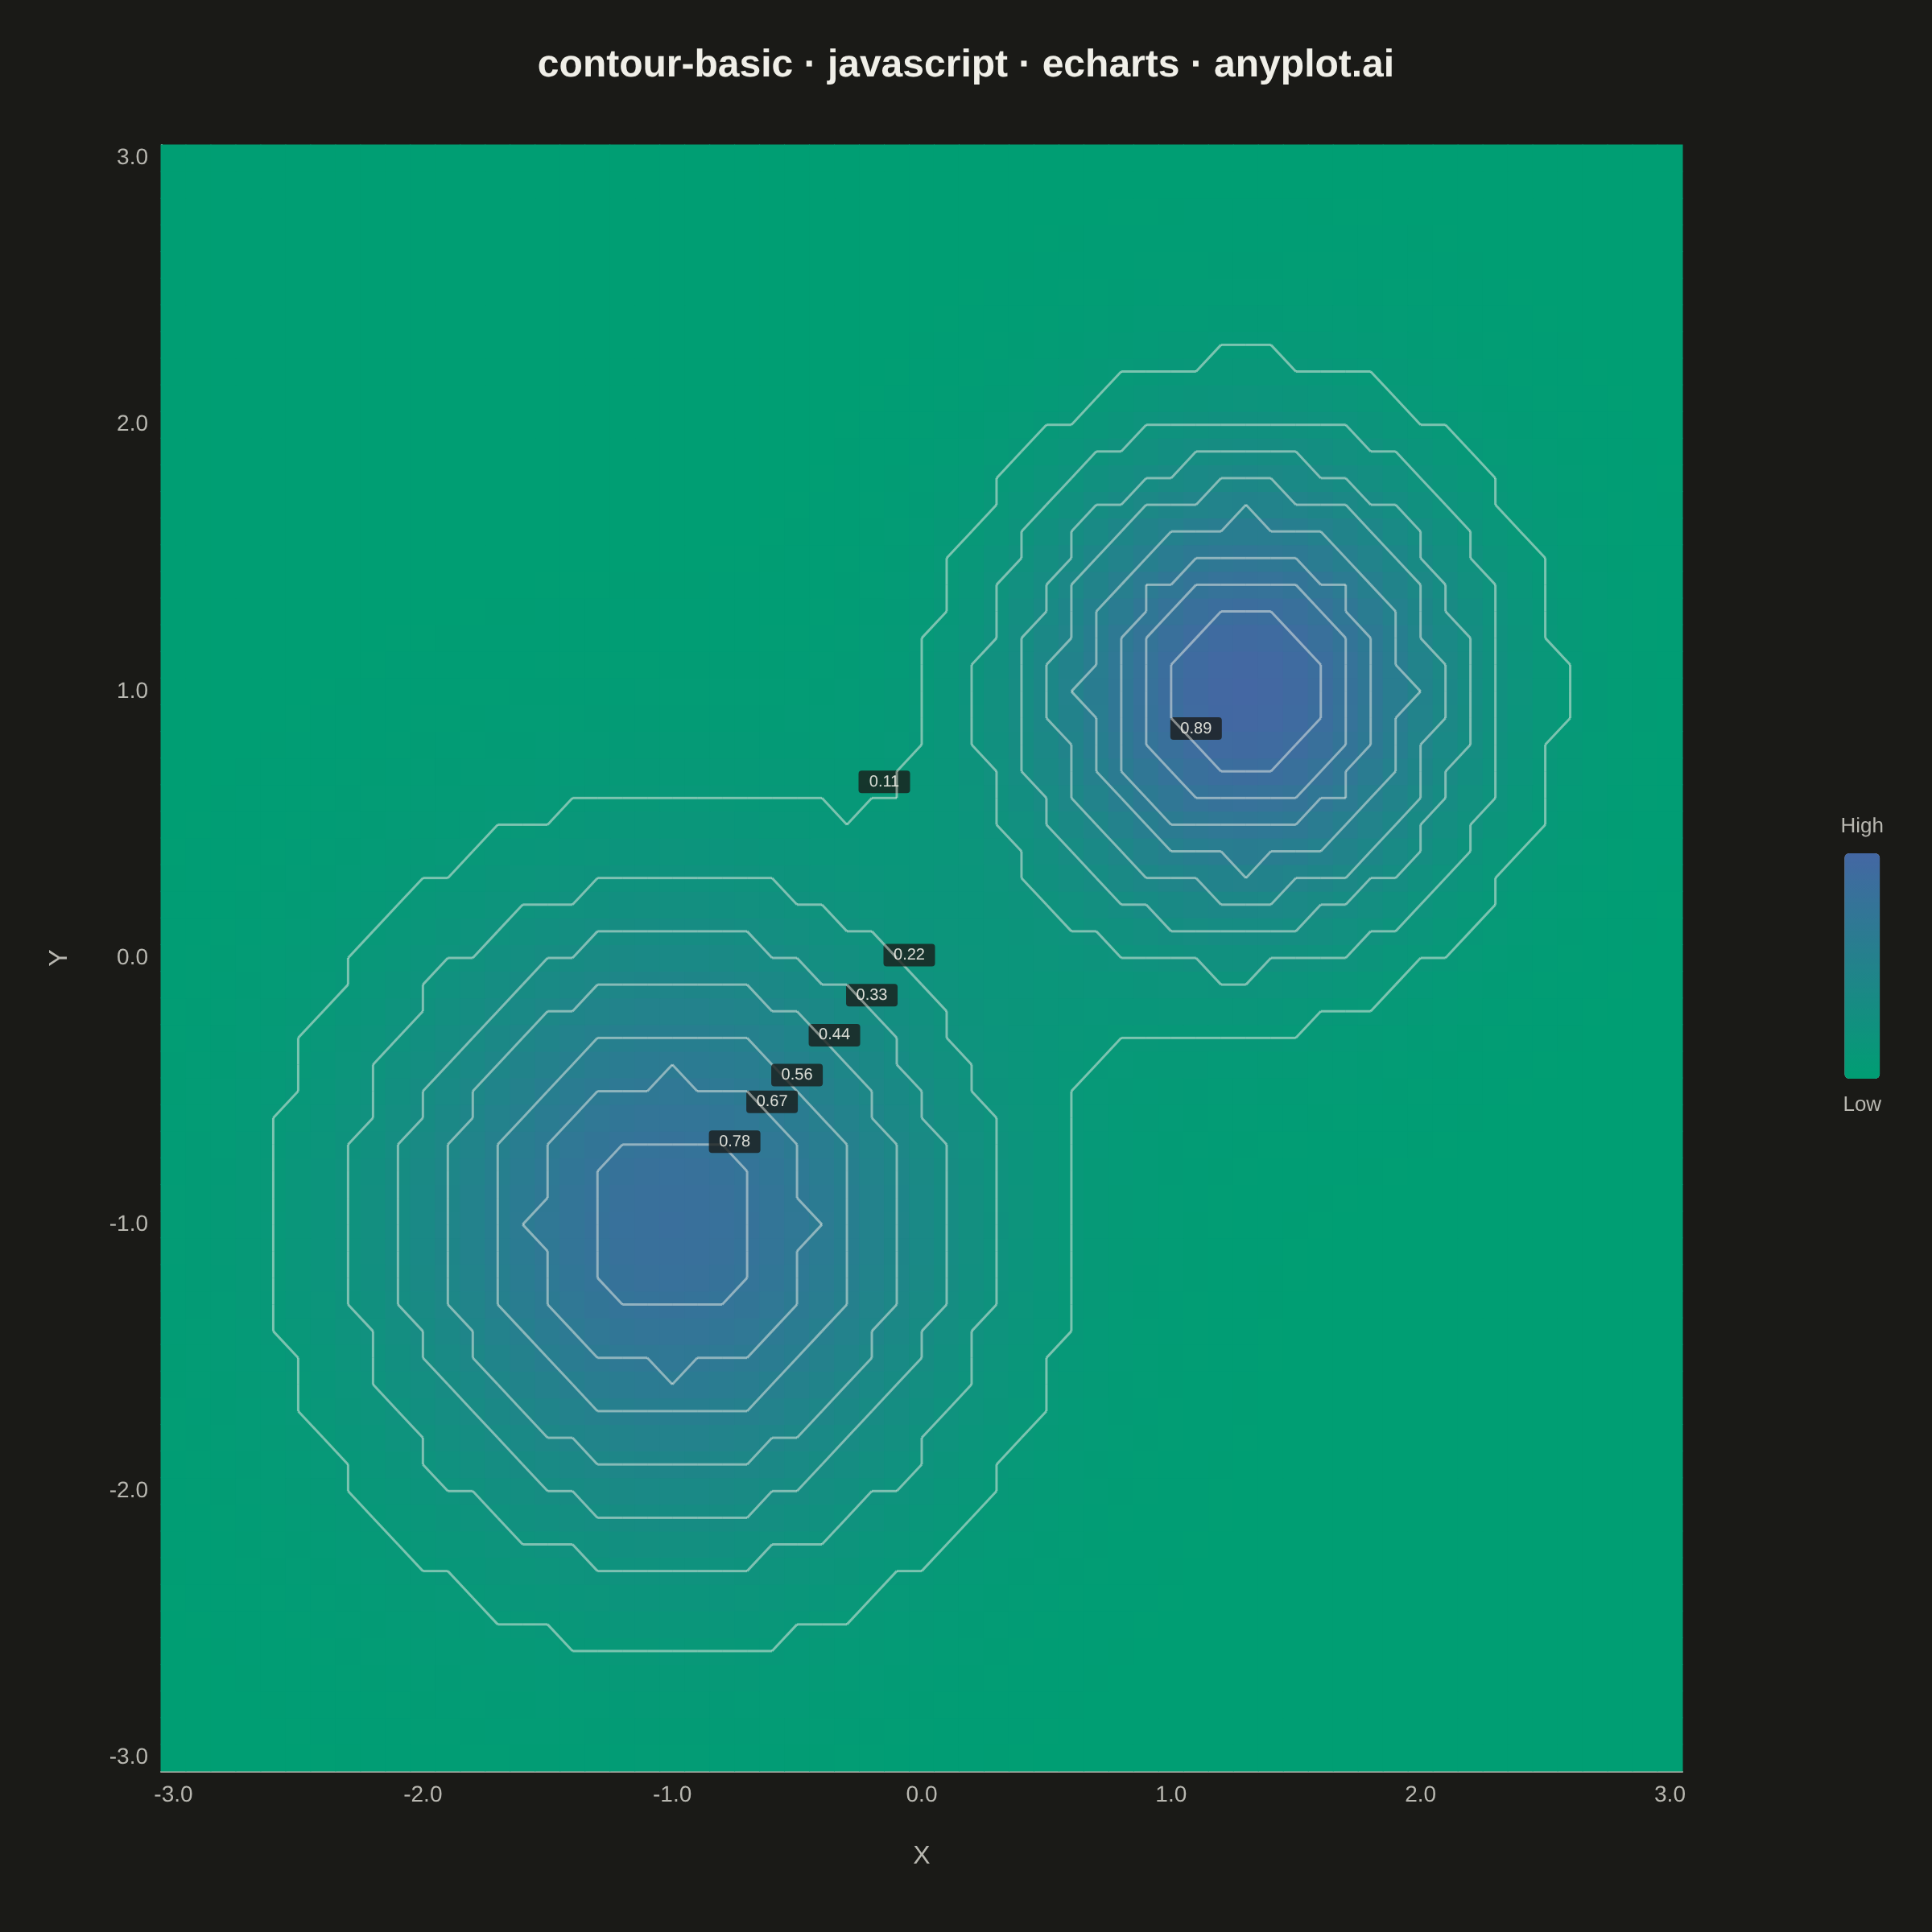
A contour plot displays isolines (level curves) of a 2D scalar field, connecting points of equal value across a surface. It transforms 3D data into an intuitive 2D representation, making it easy to identify regions of high and low values, gradients, and patterns. Contour plots are essential for visualizing continuous surfaces where the relationship between X, Y coordinates and a Z value needs to be understood.
// anyplot.ai
// contour-basic: Basic Contour Plot
// Library: echarts 5.5.1 | JavaScript 22.23.0
// Quality: 84/100 | Created: 2026-06-25
//# anyplot-orientation: square

const t = window.ANYPLOT_TOKENS;

// Grid: 61 points from -3.0 to 3.0 (step=0.1)
const N = 61;
const xVals = [], yVals = [];
for (let i = 0; i < N; i++) {
  const v = parseFloat((-3 + i * 0.1).toFixed(1));
  xVals.push(v);
  yVals.push(v);
}

// Bivariate Gaussian: two distinct peaks
function density(x, y) {
  const g1 = Math.exp(-((x - 1.3) ** 2 + (y - 1.0) ** 2) / (2 * 0.36));
  const g2 = 0.85 * Math.exp(-((x + 1.0) ** 2 + (y + 1.0) ** 2) / (2 * 0.64));
  return g1 + g2;
}

// Build flat grid array and heatmap data
const gridZ = new Array(N * N);
let minVal = Infinity, maxVal = -Infinity;
const gridData = [];
for (let yi = 0; yi < N; yi++) {
  for (let xi = 0; xi < N; xi++) {
    const z = density(xVals[xi], yVals[yi]);
    gridZ[yi * N + xi] = z;
    gridData.push([xi, yi, z]);
    if (z < minVal) minVal = z;
    if (z > maxVal) maxVal = z;
  }
}

const xLabels = xVals.map(v => v.toFixed(1));
const yLabels = yVals.map(v => v.toFixed(1));

// Marching squares: compute isoline segments for one contour level
function contourSegments(threshold) {
  const segs = [];
  for (let yi = 0; yi < N - 1; yi++) {
    for (let xi = 0; xi < N - 1; xi++) {
      const vbl = gridZ[yi * N + xi];
      const vbr = gridZ[yi * N + (xi + 1)];
      const vtr = gridZ[(yi + 1) * N + (xi + 1)];
      const vtl = gridZ[(yi + 1) * N + xi];

      const abl = vbl >= threshold;
      const abr = vbr >= threshold;
      const atr = vtr >= threshold;
      const atl = vtl >= threshold;

      if (abl === abr && abr === atr && atr === atl) continue;

      // Linear interpolation of crossing position along an edge
      const lerp = (a, b, va, vb) => a + (b - a) * (threshold - va) / (vb - va);

      // Edge crossings in order: bottom, right, top, left
      const pts = [];
      if (abl !== abr) pts.push([lerp(xi, xi + 1, vbl, vbr), yi]);
      if (abr !== atr) pts.push([xi + 1, lerp(yi, yi + 1, vbr, vtr)]);
      if (atr !== atl) pts.push([lerp(xi, xi + 1, vtl, vtr), yi + 1]);
      if (atl !== abl) pts.push([xi, lerp(yi, yi + 1, vbl, vtl)]);

      if (pts.length === 2) {
        segs.push([pts[0], pts[1]]);
      } else if (pts.length === 4) {
        // Saddle point: disambiguate via cell-center value
        // code5: bl+tr above; code10: br+tl above — require opposite pairing
        const center = (vbl + vbr + vtr + vtl) / 4;
        const code5 = abl && atr && !abr && !atl;
        const swapped = code5 ? center < threshold : center >= threshold;
        if (swapped) {
          segs.push([pts[0], pts[3]]); // b↔l
          segs.push([pts[1], pts[2]]); // r↔t
        } else {
          segs.push([pts[0], pts[1]]); // b↔r
          segs.push([pts[2], pts[3]]); // t↔l
        }
      }
    }
  }
  return segs;
}

// 8 contour levels evenly spaced between min and max
const N_LEVELS = 8;
const levels = [];
for (let i = 1; i <= N_LEVELS; i++) {
  levels.push(minVal + i * (maxVal - minVal) / (N_LEVELS + 1));
}

// Build segment data for custom series: [x1, y1, x2, y2, labelStr]
// One labeled segment per level — the one closest to the center of the grid
const segData = [];
const midN = (N - 1) / 2;

levels.forEach(threshold => {
  const segs = contourSegments(threshold);
  // Find segment nearest to center (avoid edges for readability)
  let bestI = 0, bestDist = Infinity;
  segs.forEach((seg, si) => {
    const mx = (seg[0][0] + seg[1][0]) / 2;
    const my = (seg[0][1] + seg[1][1]) / 2;
    if (mx < 6 || mx > N - 6 || my < 6 || my > N - 6) return;
    const d = (mx - midN) ** 2 + (my - midN) ** 2;
    if (d < bestDist) { bestDist = d; bestI = si; }
  });

  const lbl = threshold.toFixed(2);
  segs.forEach((seg, si) => {
    segData.push([seg[0][0], seg[0][1], seg[1][0], seg[1][1], si === bestI ? lbl : '']);
  });
});

const chart = echarts.init(document.getElementById('container'));

chart.setOption({
  animation: false,
  color: t.palette,
  backgroundColor: 'transparent',
  title: {
    text: 'contour-basic · javascript · echarts · anyplot.ai',
    left: 'center',
    top: 24,
    textStyle: { color: t.ink, fontSize: 24, fontWeight: 'bold' }
  },
  grid: { left: 100, right: 155, top: 90, bottom: 100 },
  xAxis: {
    type: 'category',
    data: xLabels,
    name: 'X',
    nameLocation: 'middle',
    nameGap: 45,
    nameTextStyle: { color: t.inkSoft, fontSize: 16 },
    axisLabel: { color: t.inkSoft, fontSize: 14, interval: 9 },
    axisLine: { lineStyle: { color: t.inkSoft } },
    axisTick: { show: false },
    splitLine: { show: false }
  },
  yAxis: {
    type: 'category',
    data: yLabels,
    name: 'Y',
    nameLocation: 'middle',
    nameGap: 55,
    nameTextStyle: { color: t.inkSoft, fontSize: 16 },
    axisLabel: { color: t.inkSoft, fontSize: 14, interval: 9 },
    axisLine: { lineStyle: { color: t.inkSoft } },
    axisTick: { show: false },
    splitLine: { show: false }
  },
  visualMap: {
    min: minVal,
    max: maxVal,
    seriesIndex: [0],
    calculable: false,
    orient: 'vertical',
    right: 25,
    top: 'center',
    itemWidth: 22,
    inRange: { color: t.seq },
    textStyle: { color: t.inkSoft, fontSize: 13 },
    text: ['High', 'Low'],
    formatter: v => v.toFixed(2)
  },
  series: [
    {
      type: 'heatmap',
      data: gridData,
      emphasis: { disabled: true }
    },
    {
      // Contour isolines via marching squares, drawn as a custom series
      type: 'custom',
      coordinateSystem: 'cartesian2d',
      renderItem(params, api) {
        const x1 = api.value(0), y1 = api.value(1);
        const x2 = api.value(2), y2 = api.value(3);
        const lbl = api.value(4);
        const p1 = api.coord([x1, y1]);
        const p2 = api.coord([x2, y2]);

        const lineEl = {
          type: 'line',
          shape: { x1: p1[0], y1: p1[1], x2: p2[0], y2: p2[1] },
          style: { stroke: t.ink, lineWidth: 1.5, opacity: 0.5 }
        };

        if (!lbl) return lineEl;

        // Label: small rect background + text for readability over heatmap
        const mx = (p1[0] + p2[0]) / 2;
        const my = (p1[1] + p2[1]) / 2;
        return {
          type: 'group',
          children: [
            lineEl,
            {
              type: 'rect',
              shape: { x: mx - 16, y: my - 17, width: 32, height: 14, r: 2 },
              style: { fill: t.pageBg, opacity: 0.78 }
            },
            {
              type: 'text',
              x: mx,
              y: my - 15,
              style: {
                text: lbl,
                fill: t.ink,
                fontSize: 10,
                fontFamily: 'sans-serif',
                textAlign: 'center',
                opacity: 0.9
              }
            }
          ]
        };
      },
      data: segData,
      encode: { x: 0, y: 1 },
      z: 10,
      silent: true
    }
  ]
});
Runnable source as JSON, for any HTTP client: https://api.anyplot.ai/specs/contour-basic/echarts/code. Any spec id and library id listed in llms-full.txt fit the same URL shape; every URL below is complete and callable.
{
  "spec_id": "contour-basic",
  "language": "javascript",
  "library": "echarts",
  "page": "https://anyplot.ai/contour-basic/javascript/echarts",
  "hub": "https://anyplot.ai/contour-basic",
  "code_json": "https://api.anyplot.ai/specs/contour-basic/echarts/code",
  "spec_json": "https://api.anyplot.ai/specs/contour-basic",
  "render_light_png": "https://storage.googleapis.com/anyplot-images/plots/contour-basic/javascript/echarts/plot-light.png",
  "render_dark_png": "https://storage.googleapis.com/anyplot-images/plots/contour-basic/javascript/echarts/plot-dark.png",
  "interactive_light_html": "https://storage.googleapis.com/anyplot-images/plots/contour-basic/javascript/echarts/plot-light.html",
  "interactive_dark_html": "https://storage.googleapis.com/anyplot-images/plots/contour-basic/javascript/echarts/plot-dark.html",
  "quality_score": 84.0,
  "license": "MIT",
  "guide": "https://anyplot.ai/llms.txt"
}
Part of Basic Contour Plot on anyplot.ai.