The same plot in 14 other libraries — JavaScript: D3.js, Apache ECharts, Highcharts, MUI X Charts; Python: Altair, Bokeh, lets-plot, Matplotlib, Plotly, plotnine, Pygal, Seaborn; R: ggplot2; Julia: Makie.jl. Compare all 15 side by side: Contour Lines on Geographic Map in Python, R, Julia and JavaScript.
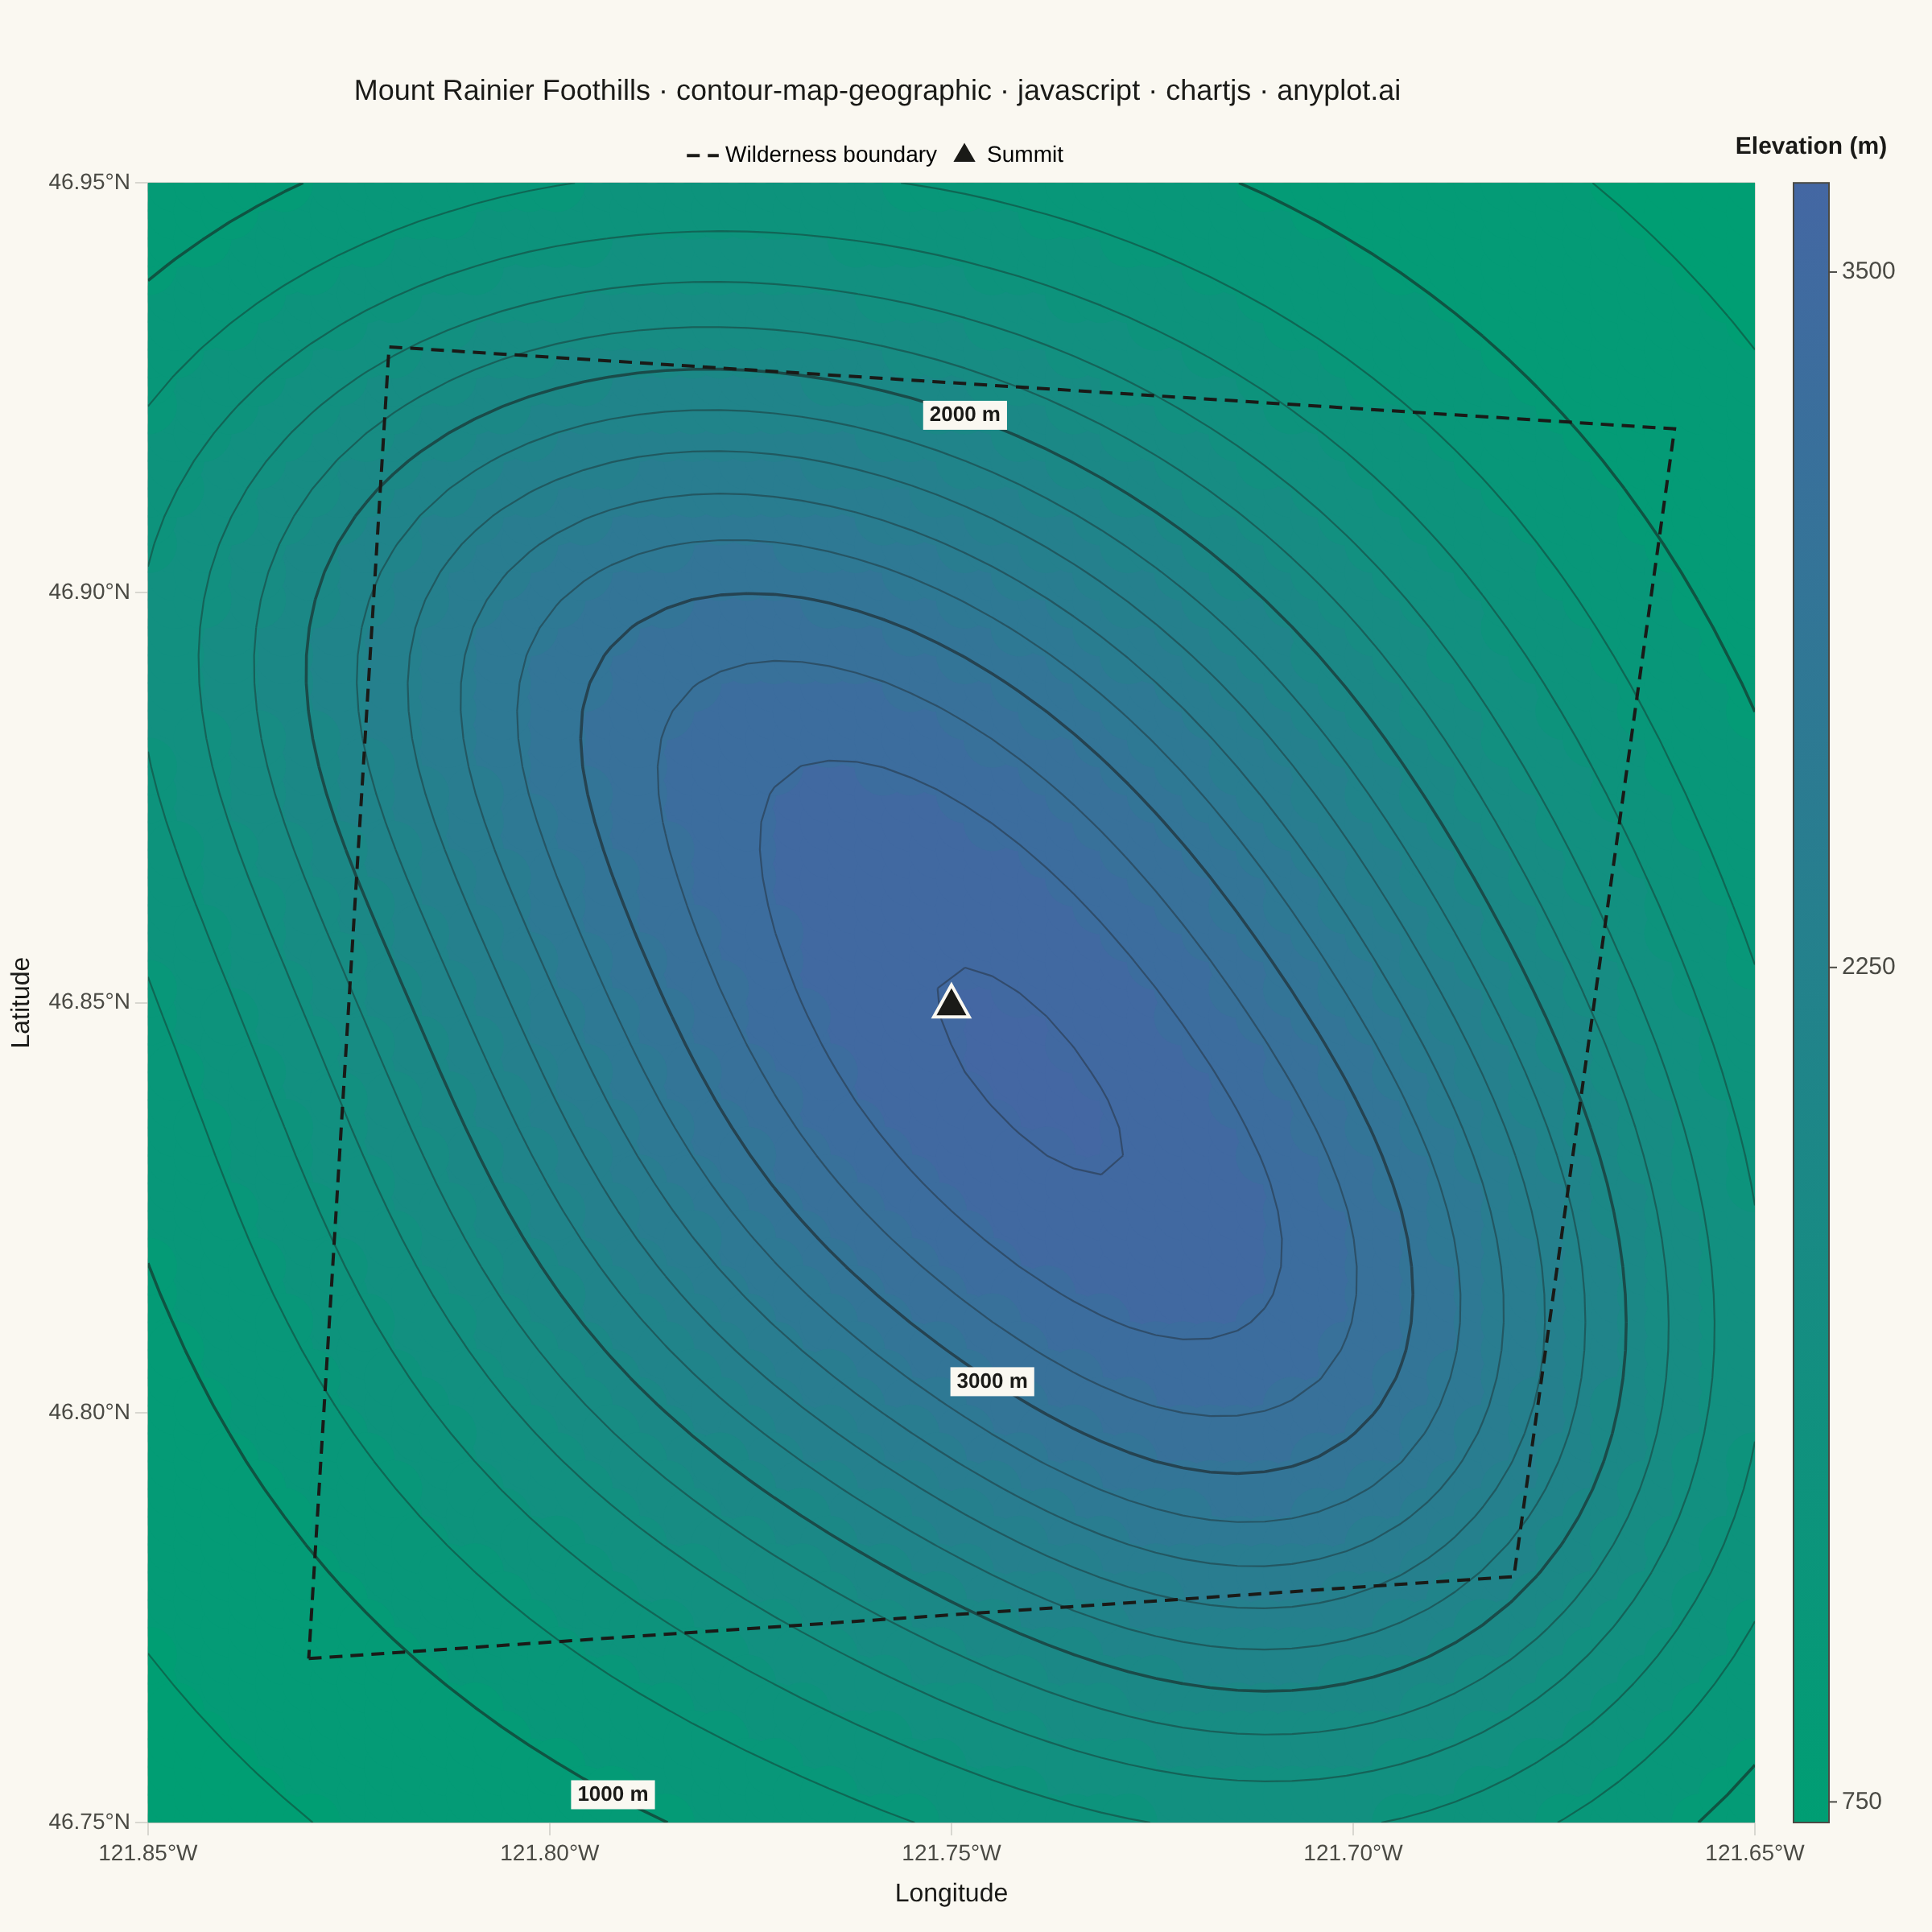
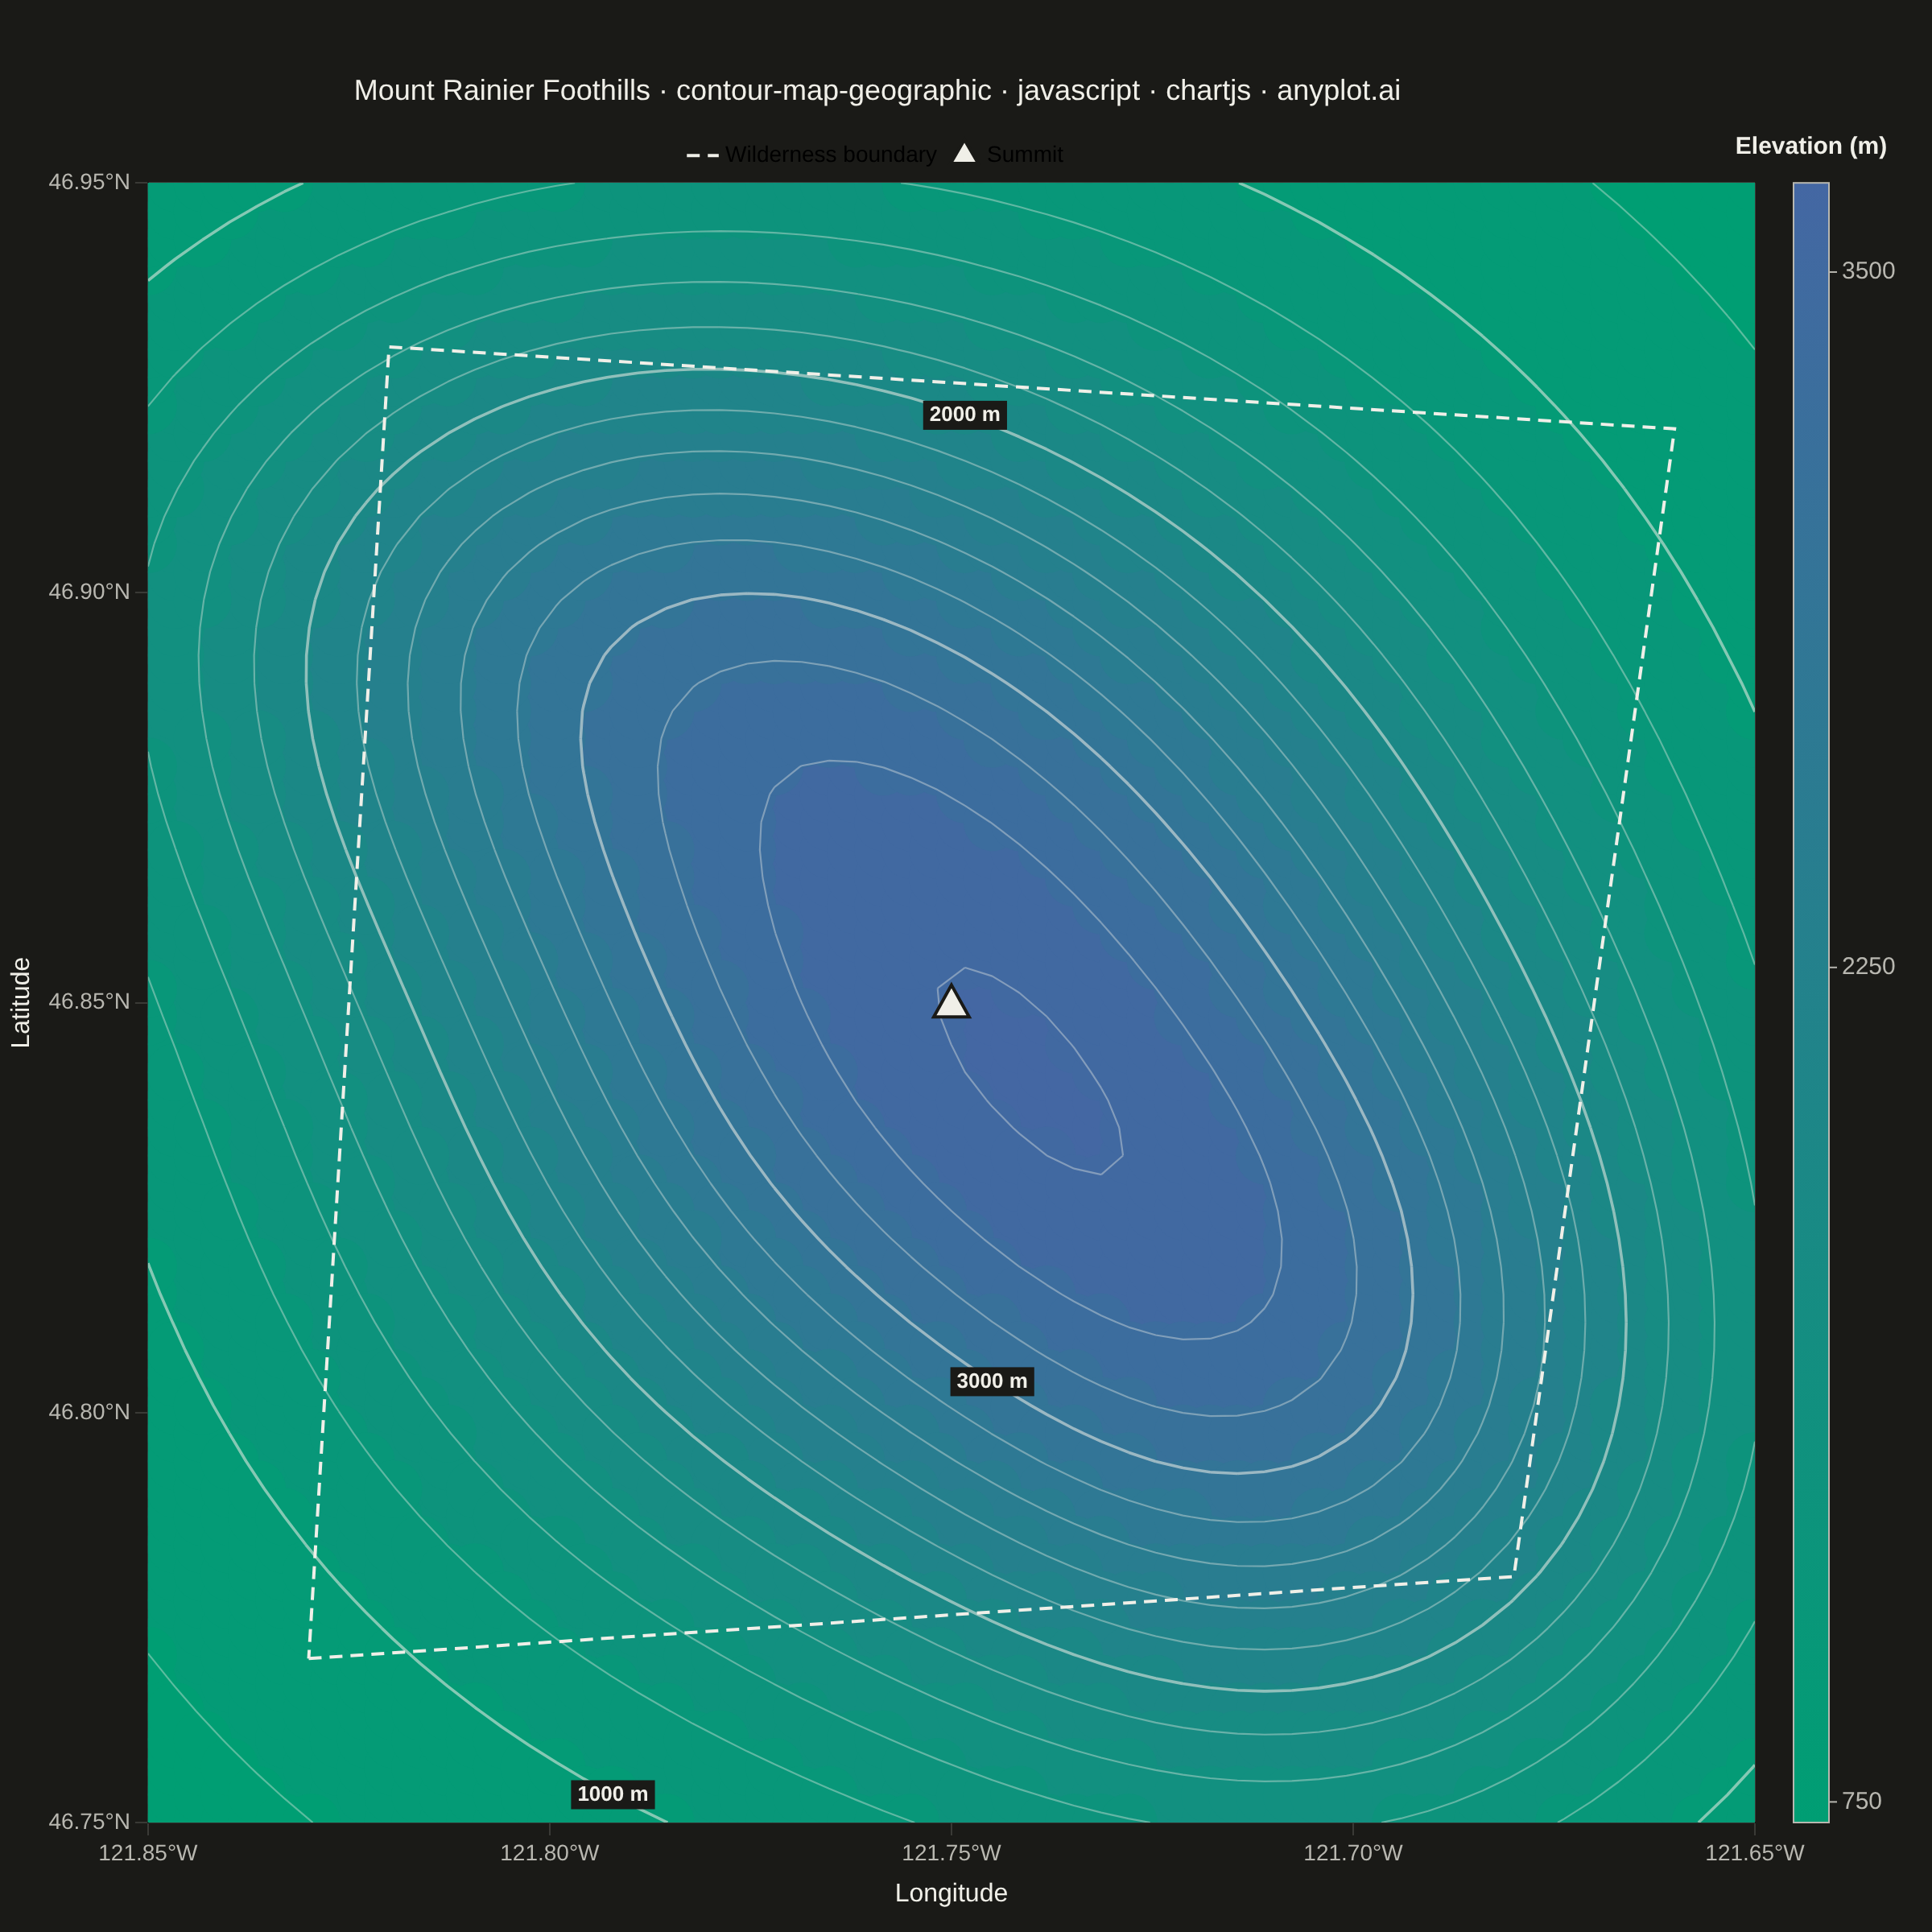
A contour map overlays isolines (lines of equal value) onto a geographic basemap, visualizing continuous spatial data such as elevation, temperature, or atmospheric pressure across real-world coordinates. Unlike basic contour plots that use abstract x/y coordinates, this plot anchors contours to latitude/longitude positions with geographic context like coastlines, borders, or terrain. It combines the precision of isoline visualization with spatial awareness, making it ideal for meteorological, topographic, and environmental applications.
// anyplot.ai
// contour-map-geographic: Contour Lines on Geographic Map
// Library: chartjs 4.4.7 | JavaScript 22.23.2
// Quality: 93/100 | Created: 2026-09-01

//# anyplot-orientation: square

const t = window.ANYPLOT_TOKENS;

// --- Geographic grid (synthetic elevation, western foothills near Mount Rainier, WA) ---
const N = 60;
const LON_MIN = -121.85;
const LON_MAX = -121.65;
const LAT_MIN = 46.75;
const LAT_MAX = 46.95;

const lonArr = [];
const latArr = [];
for (let k = 0; k < N; k++) {
  lonArr.push(LON_MIN + ((LON_MAX - LON_MIN) * k) / (N - 1));
  latArr.push(LAT_MIN + ((LAT_MAX - LAT_MIN) * k) / (N - 1));
}

// Synthetic elevation surface: foothill base + three Gaussian peaks
const BASE_ELEV = 700; // meters
const PEAKS = [
  { lon: -121.75, lat: 46.85, height: 2600, sigmaLon: 0.05, sigmaLat: 0.05 }, // main summit
  { lon: -121.7, lat: 46.8, height: 1400, sigmaLon: 0.035, sigmaLat: 0.035 },
  { lon: -121.8, lat: 46.9, height: 1100, sigmaLon: 0.04, sigmaLat: 0.03 },
];

let Z_MIN = Infinity;
let Z_MAX = -Infinity;
const zGrid = [];
for (let i = 0; i < N; i++) {
  zGrid.push([]);
  for (let j = 0; j < N; j++) {
    const lon = lonArr[i];
    const lat = latArr[j];
    let z = BASE_ELEV;
    for (const p of PEAKS) {
      z +=
        p.height *
        Math.exp(-(((lon - p.lon) ** 2) / (2 * p.sigmaLon ** 2) + ((lat - p.lat) ** 2) / (2 * p.sigmaLat ** 2)));
    }
    zGrid[i].push(z);
    if (z < Z_MIN) Z_MIN = z;
    if (z > Z_MAX) Z_MAX = z;
  }
}

// --- Imprint sequential colormap (elevation is single-polarity magnitude) ---
function hexToRgb(hex) {
  return [parseInt(hex.slice(1, 3), 16), parseInt(hex.slice(3, 5), 16), parseInt(hex.slice(5, 7), 16)];
}
function lerpColor(h1, h2, frac) {
  const [r1, g1, b1] = hexToRgb(h1);
  const [r2, g2, b2] = hexToRgb(h2);
  return `rgb(${Math.round(r1 + (r2 - r1) * frac)},${Math.round(g1 + (g2 - g1) * frac)},${Math.round(b1 + (b2 - b1) * frac)})`;
}
function seqColor(z) {
  const frac = Math.max(0, Math.min(1, (z - Z_MIN) / (Z_MAX - Z_MIN)));
  return lerpColor(t.seq[0], t.seq[1], frac);
}

// --- Contour levels: 200 m spacing, index (bold+labeled) lines every 1000 m ---
const CONTOUR_INTERVAL = 200;
const INDEX_INTERVAL = 1000;

const LEVEL_LO = Math.floor(Z_MIN / CONTOUR_INTERVAL) * CONTOUR_INTERVAL;
const LEVEL_HI = Math.ceil(Z_MAX / CONTOUR_INTERVAL) * CONTOUR_INTERVAL;
const levels = [];
for (let z = LEVEL_LO; z <= LEVEL_HI; z += CONTOUR_INTERVAL) levels.push(z);

const bandLevels = levels.slice(0, -1); // [low, low + interval) pairs
const isoThresholds = levels.filter((z) => z > Z_MIN && z < Z_MAX);

// --- Filled elevation bands ---
const datasets = [];
for (const zLow of bandLevels) {
  const zHigh = zLow + CONTOUR_INTERVAL;
  const color = seqColor((zLow + zHigh) / 2);
  const points = [];
  for (let i = 0; i < N; i++) {
    for (let j = 0; j < N; j++) {
      const z = zGrid[i][j];
      if (z >= zLow && z < zHigh) points.push({ x: lonArr[i], y: latArr[j] });
    }
  }
  if (points.length > 0) {
    datasets.push({
      label: `${zLow}–${zHigh} m`,
      data: points,
      backgroundColor: color,
      borderWidth: 0,
      pointRadius: 18,
      pointHoverRadius: 18,
      showLine: false,
    });
  }
}

// --- Wilderness boundary (schematic protected-area outline, basemap context) ---
// Drawn by the overlay plugin (afterDraw) rather than as a dataset, so it
// always renders above the dense elevation-band fill instead of racing it
// for z-order.
const boundary = [
  { x: -121.83, y: 46.77 },
  { x: -121.68, y: 46.78 },
  { x: -121.66, y: 46.92 },
  { x: -121.82, y: 46.93 },
  { x: -121.83, y: 46.77 },
];
const summit = { x: -121.75, y: 46.85 };

// --- Marching squares for contour isolines ---
// For each 4-bit corner code (BL=bit0, BR=bit1, TR=bit2, TL=bit3, 1=above threshold),
// which pairs of edge indices to connect as a line segment.
// Edges: 0=bottom (BL-BR), 1=right (BR-TR), 2=top (TL-TR), 3=left (BL-TL)
const SEG = [
  [], // 0: all below
  [[0, 3]], // 1: BL
  [[0, 1]], // 2: BR
  [[3, 1]], // 3: BL,BR
  [[1, 2]], // 4: TR
  [
    [0, 3],
    [1, 2],
  ], // 5: BL,TR (saddle)
  [[0, 2]], // 6: BR,TR
  [[3, 2]], // 7: BL,BR,TR
  [[3, 2]], // 8: TL
  [[0, 2]], // 9: BL,TL
  [
    [0, 1],
    [2, 3],
  ], // 10: BR,TL (saddle)
  [[1, 2]], // 11: BL,BR,TL
  [[3, 1]], // 12: TR,TL
  [[0, 1]], // 13: BL,TR,TL
  [[0, 3]], // 14: BR,TR,TL
  [], // 15: all above
];

// --- Isoline + colorbar overlay plugin ---
const contourPlugin = {
  id: 'contourOverlay',
  afterDraw(chart) {
    const ctx = chart.ctx;
    const ca = chart.chartArea;
    if (!ca) return;

    const xs = chart.scales.x;
    const ys = chart.scales.y;
    const xPx = lonArr.map((v) => xs.getPixelForValue(v));
    const yPx = latArr.map((v) => ys.getPixelForValue(v));

    function edgePx(e, i, j, z00, z10, z11, z01, thresh) {
      const f = (a, b, za, zb) => a + ((thresh - za) / (zb - za)) * (b - a);
      switch (e) {
        case 0:
          return [f(xPx[i], xPx[i + 1], z00, z10), yPx[j]];
        case 1:
          return [xPx[i + 1], f(yPx[j], yPx[j + 1], z10, z11)];
        case 2:
          return [f(xPx[i], xPx[i + 1], z01, z11), yPx[j + 1]];
        default:
          return [xPx[i], f(yPx[j], yPx[j + 1], z00, z01)];
      }
    }

    ctx.save();
    ctx.beginPath();
    ctx.rect(ca.left, ca.top, ca.right - ca.left, ca.bottom - ca.top);
    ctx.clip();

    for (const thresh of isoThresholds) {
      const isIndex = thresh % INDEX_INTERVAL === 0;
      const segments = [];
      for (let i = 0; i < N - 1; i++) {
        for (let j = 0; j < N - 1; j++) {
          const z00 = zGrid[i][j];
          const z10 = zGrid[i + 1][j];
          const z11 = zGrid[i + 1][j + 1];
          const z01 = zGrid[i][j + 1];
          const code =
            (z00 >= thresh ? 1 : 0) | (z10 >= thresh ? 2 : 0) | (z11 >= thresh ? 4 : 0) | (z01 >= thresh ? 8 : 0);
          for (const [e0, e1] of SEG[code]) {
            segments.push([edgePx(e0, i, j, z00, z10, z11, z01, thresh), edgePx(e1, i, j, z00, z10, z11, z01, thresh)]);
          }
        }
      }
      if (segments.length === 0) continue;

      ctx.beginPath();
      ctx.strokeStyle = t.ink;
      ctx.globalAlpha = isIndex ? 0.55 : 0.38;
      ctx.lineWidth = isIndex ? 1.8 : 1.1;
      for (const [a, b] of segments) {
        ctx.moveTo(a[0], a[1]);
        ctx.lineTo(b[0], b[1]);
      }
      ctx.stroke();

      // Index contours (multiples of INDEX_INTERVAL) carry an elevation label
      if (isIndex) {
        const [lx, ly] = segments[Math.floor(segments.length / 2)][0];
        const label = `${thresh} m`;
        ctx.font = 'bold 13px sans-serif';
        const w = ctx.measureText(label).width;
        ctx.globalAlpha = 1;
        ctx.fillStyle = t.pageBg;
        ctx.fillRect(lx - w / 2 - 4, ly - 9, w + 8, 18);
        ctx.fillStyle = t.ink;
        ctx.textAlign = 'center';
        ctx.textBaseline = 'middle';
        ctx.fillText(label, lx, ly);
      }
    }
    // --- Wilderness boundary ---
    ctx.beginPath();
    boundary.forEach((p, idx) => {
      const px = xs.getPixelForValue(p.x);
      const py = ys.getPixelForValue(p.y);
      if (idx === 0) ctx.moveTo(px, py);
      else ctx.lineTo(px, py);
    });
    ctx.globalAlpha = 1;
    ctx.setLineDash([8, 5]);
    ctx.strokeStyle = t.ink;
    ctx.lineWidth = 2;
    ctx.stroke();
    ctx.setLineDash([]);

    // --- Summit marker (triangle) ---
    const sx = xs.getPixelForValue(summit.x);
    const sy = ys.getPixelForValue(summit.y);
    const r = 11;
    ctx.beginPath();
    ctx.moveTo(sx, sy - r);
    ctx.lineTo(sx + r, sy + r * 0.8);
    ctx.lineTo(sx - r, sy + r * 0.8);
    ctx.closePath();
    ctx.fillStyle = t.ink;
    ctx.fill();
    ctx.strokeStyle = t.pageBg;
    ctx.lineWidth = 2;
    ctx.stroke();

    ctx.restore();

    // --- Colorbar (elevation, meters) ---
    const barX = ca.right + 24;
    const barW = 22;
    const barH = ca.bottom - ca.top;

    const grad = ctx.createLinearGradient(0, ca.bottom, 0, ca.top);
    grad.addColorStop(0, t.seq[0]);
    grad.addColorStop(1, t.seq[1]);
    ctx.fillStyle = grad;
    ctx.fillRect(barX, ca.top, barW, barH);

    ctx.strokeStyle = t.inkSoft;
    ctx.lineWidth = 1;
    ctx.strokeRect(barX, ca.top, barW, barH);

    ctx.fillStyle = t.ink;
    ctx.font = 'bold 15px sans-serif';
    ctx.textAlign = 'center';
    ctx.fillText('Elevation (m)', barX + barW / 2, ca.top - 22);

    // Ticks are inset from the bar's top/bottom edges so their labels never
    // collide with the "Elevation (m)" title or the axis below. Values are
    // snapped to the nearest 250 m so the colorbar reads round numbers
    // instead of raw min/mid/max data values.
    const TICK_INSET = 12;
    const TICK_ROUND = 250;
    const ticks = [
      Math.floor(Z_MAX / TICK_ROUND) * TICK_ROUND,
      Math.round((Z_MIN + Z_MAX) / 2 / TICK_ROUND) * TICK_ROUND,
      Math.ceil(Z_MIN / TICK_ROUND) * TICK_ROUND,
    ];
    ctx.strokeStyle = t.inkSoft;
    ctx.fillStyle = t.inkSoft;
    ctx.font = '15px sans-serif';
    ctx.textAlign = 'left';
    ctx.textBaseline = 'middle';
    for (const zTick of ticks) {
      const frac = (zTick - Z_MIN) / (Z_MAX - Z_MIN);
      const ty = ca.bottom - TICK_INSET - frac * (barH - 2 * TICK_INSET);
      ctx.beginPath();
      ctx.moveTo(barX + barW, ty);
      ctx.lineTo(barX + barW + 5, ty);
      ctx.stroke();
      ctx.fillText(Math.round(zTick).toString(), barX + barW + 8, ty);
    }
  },
};

// --- Title (scales fontsize down when the descriptive prefix pushes past the 67-char baseline) ---
const TITLE = 'Mount Rainier Foothills · contour-map-geographic · javascript · chartjs · anyplot.ai';
const TITLE_FONT_DEFAULT = 22;
const TITLE_FONT_FLOOR = 14;
const titleFontSize = Math.max(TITLE_FONT_FLOOR, Math.round(TITLE_FONT_DEFAULT * Math.min(1, 67 / TITLE.length)));

// --- Mount ---
const canvas = document.createElement('canvas');
document.getElementById('container').appendChild(canvas);

// --- Chart ---
new Chart(canvas, {
  type: 'scatter',
  data: { datasets },
  options: {
    responsive: true,
    maintainAspectRatio: false,
    animation: false,
    layout: { padding: { right: 110, top: 34, bottom: 10 } },
    plugins: {
      title: {
        display: true,
        text: TITLE,
        color: t.ink,
        font: { size: titleFontSize, weight: '500' },
        padding: { top: 12, bottom: 12 },
      },
      legend: {
        onClick: () => {},
        labels: {
          color: t.ink,
          font: { size: 14 },
          usePointStyle: true,
          generateLabels: () => [
            { text: 'Wilderness boundary', pointStyle: 'line', strokeStyle: t.ink, lineWidth: 2, lineDash: [8, 5] },
            { text: 'Summit', pointStyle: 'triangle', fillStyle: t.ink, strokeStyle: t.pageBg, lineWidth: 2 },
          ],
        },
      },
    },
    scales: {
      x: {
        type: 'linear',
        min: LON_MIN,
        max: LON_MAX,
        ticks: { color: t.inkSoft, font: { size: 14 }, callback: (v) => `${Math.abs(v).toFixed(2)}°W` },
        grid: { color: t.grid },
        title: { display: true, text: 'Longitude', color: t.ink, font: { size: 16 } },
      },
      y: {
        type: 'linear',
        min: LAT_MIN,
        max: LAT_MAX,
        ticks: { color: t.inkSoft, font: { size: 14 }, callback: (v) => `${v.toFixed(2)}°N` },
        grid: { color: t.grid },
        title: { display: true, text: 'Latitude', color: t.ink, font: { size: 16 } },
      },
    },
  },
  plugins: [contourPlugin],
});
Runnable source as JSON, for any HTTP client: https://api.anyplot.ai/specs/contour-map-geographic/chartjs/code. Any spec id and library id listed in llms-full.txt fit the same URL shape; every URL below is complete and callable.
{
  "spec_id": "contour-map-geographic",
  "language": "javascript",
  "library": "chartjs",
  "page": "https://anyplot.ai/contour-map-geographic/javascript/chartjs",
  "hub": "https://anyplot.ai/contour-map-geographic",
  "code_json": "https://api.anyplot.ai/specs/contour-map-geographic/chartjs/code",
  "spec_json": "https://api.anyplot.ai/specs/contour-map-geographic",
  "render_light_png": "https://storage.googleapis.com/anyplot-images/plots/contour-map-geographic/javascript/chartjs/plot-light.png",
  "render_dark_png": "https://storage.googleapis.com/anyplot-images/plots/contour-map-geographic/javascript/chartjs/plot-dark.png",
  "interactive_light_html": "https://storage.googleapis.com/anyplot-images/plots/contour-map-geographic/javascript/chartjs/plot-light.html",
  "interactive_dark_html": "https://storage.googleapis.com/anyplot-images/plots/contour-map-geographic/javascript/chartjs/plot-dark.html",
  "quality_score": 93.0,
  "license": "MIT",
  "guide": "https://anyplot.ai/llms.txt"
}
Part of Contour Lines on Geographic Map on anyplot.ai.